How organizations use satellite data to enable transparency in greenhouse gas emissions

Editor’s note: This article was written as part of EO Hub – a journalistic collaboration between UP42 and Geoawesomeness. Created for policymakers, decision makers, geospatial experts and enthusiasts alike, EO Hub is a key resource for anyone trying to understand how Earth observation is transforming our world. Read more about EO Hub here.
To prevent catastrophic global warming, the rise in global average temperature must be limited to 1.5 degrees Celsius. This is the threshold the Intergovernmental Panel on Climate Change (IPCC) has defined as safe, and this is why it is necessary to achieve carbon neutrality by the middle of the 21st century. The goal is written into the Paris Agreement, signed by 195 countries, including all EU member states. According to this agreement, the signatories are obliged to make rapid reductions to greenhouse gas emissions.
In addition, in December 2019, the European Commission presented its flagship ‘Green Deal’ plan, which aims to make Europe climate neutral by 2050. All countries’ actions will be verified through the European Climate Law, which establishes climate neutrality as a legally binding EU goal—a challenging task, given the lack of up-to-date, reliable information about where pollution comes from. Currently, most information on greenhouse gas emissions is based on years of data provided by the emitters themselves. In light of this situation, several organizations and start-ups have emerged with an overarching goal of mapping the sources of damaging greenhouse gas emissions in real-time.
Climate TRACE
Climate Trace is an association of non-profit organizations, academic institutions, and individuals including Al Gore, whose goal is to accelerate and facilitate climate action through independent tracking of greenhouse gas emissions (GHG). One of the main goals of Climate Trace is to reveal all individual sources of CO2 emissions worldwide. For this purpose, satellite imagery and machine learning are being used to locate the major sources of harmful gas emissions. Additionally, in order to improve data quality, each team specializes in tracking emissions from a different economic sector. Interested parties can obtain free information on CO2 emissions from the Climate Trace website, where you can search by country and economic sector.
WattTime
One of the organizations supporting Climate Trace is Watt Time. On May 7, 2019, the company announced a new project in partnership with Carbon Tracker and the World Resources Institute (WRI), with the support of Google, which has committed $1.7 million to the enterprise. It intends to audit companies’ promises to reduce the release of GHG. The inspection will involve the creation of a public database that, using artificial intelligence, will track carbon emissions from all major power plants around the world.
The tracking system will make it possible to trace polluting companies, as well as enable the reduction of emissions through the application of new technologies. The project will use a global network of satellites to observe power plants from space, and harness image-processing algorithms to detect traces of emissions. The collected data will combine information from sensors that operate at different wavelengths, including using infrared measurements to detect thermal radiation near smokestacks and cooling water intakes, and visual sensors to record the presence of smoke. The company will also be able to measure pollution levels in places where governments or corporations cannot afford to do so. Data collected in real-time will be made available to the public.
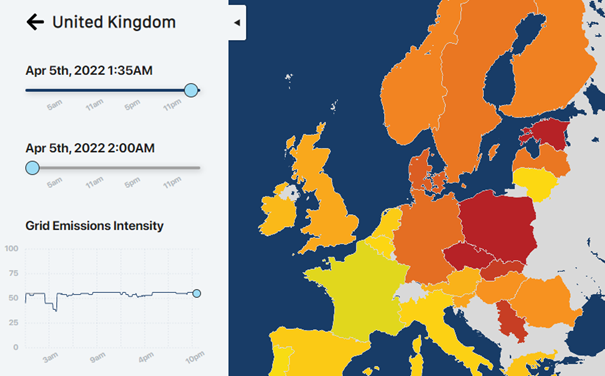
The WattTime website offers an online map that shows carbon emission intensity in real-time.
GHGSat
GHGSat is a company specializing in high-resolution remote sensing of greenhouse gases from space. With very high-quality data, they provide unique emissions information to governments, regulators, and investors around the world. The main objective is to preserve environmental standards. GHGSat operates a constellation of satellites, led by the GHGSat-D ‘Claire.’ Its own sensor technology allows it to track and locate even small methane leaks, pinpointing the source of emissions at the individual facility level. This involves the absorption of light of a specific wavelength, creating a kind of spectral ‘fingerprint’, individual and unique for each gas. The Claire satellite finds these fingerprints by using sunlight and the ‘brightness measurement’ of each gas to determine how much of the gas is in the satellite’s field of view at any given time.
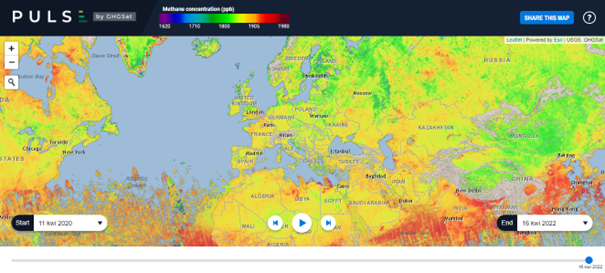
Claire focuses on locating the two most important greenhouse gases: carbon dioxide and methane. While one of the first emissions it detected came from a hydropower plant, Claire is currently used to help industrial emitters from sectors such as oil and gas, waste management, agriculture, power generation, and mining. Additionally, the company has released PULSE, a map showing the concentration of methane in the atmosphere around the world. The map is updated every week and can be accessed for free.
In late 2021, GHGSat announced the commissioning of three more satellites, GHGSat-C3 (‘Luca’), C4 (‘Penny’), and C5 (‘Diako’), which will be launched in the summer of 2022 on a SpaceX Falcon 9 rocket, as part of the Transporter-5 mission. In addition, GHGSat has begun the procurement process for six new methane-monitoring satellites (GHGSat-C6 through GHGSat-C11), as well as an additional CO2 monitoring satellite (GHGSat-C12).
Carbon Mapper
Carbon Mapper is also actively involved in greenhouse gas mitigation. This non-profit coalition includes the State of California, NASA’s Jet Propulsion Laboratory (JPL), the University of Arizona, Arizona State University (ASU), Bloomberg Philanthropies, High Tide Foundation, and RMI. A key component of their mission is to continuously locate, track and quantify high methane and carbon dioxide emissions. This enables greater global availability, transparency, and understanding of data related to greenhouse gases. Data is collected by member organizations, and collaboration with key partners allows for the development of new strategies to reduce emissions. Carbon Mapper conducts many tests that use the coalition’s own aerial satellite prototypes, including JPL’s next-generation Airborne Visible and Infrared Imaging Spectrometer (AVIRIS-NG) and ASU’s Global Air Observatory (GAO).
The investigation of leaks in low-pressure natural gas pipelines in the Los Angeles region is an example of a use case involving the NASA-owned AVIRIS-NG instrument. Using images of methane plumes and coordinates provided by the satellite, leaks can be easily and accurately located. Many urban and rural areas have thousands of miles of natural gas distribution pipelines, and it is difficult to survey them more than once a year. This example shows how incredibly helpful the use of remote sensing can be.
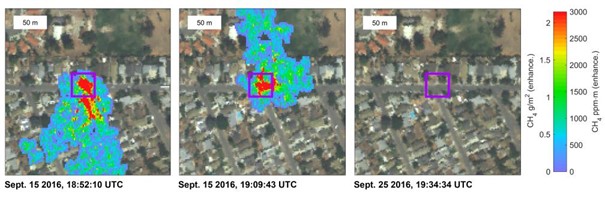
Methane Gas Leak, source: NASA/JPL-Caltech
Access to the data
All the companies and organizations listed here emphasize the importance of monitoring and controlling the current rate of greenhouse gas emissions, and they couldn’t do this without the use of satellite data. Many use data from their own satellites (or collaborators), but as the drive to avert climate disaster becomes more urgent, greater accessibility of data is becoming increasingly relevant—hence the importance of geospatial platform UP42, which was created to solve the problems of limited access to data collected from space and the enormous costs that come with acquiring it.
Conclusions
As mentioned previously on geoawesomeness, access to data is critical, and is still one of the key barriers related to the wide use of satellite data for GHG-related challenges. Democratizing access to such data is of the utmost importance—and the role of satellite data providers such as UP42 cannot be underestimated. The primary goal of such platforms is to better facilitate the access and use of satellite data, making it possible to analyze, build, run, and scale geospatial products.
The activities of the organizations detailed above enable decision-making bodies to make the most effective actions in caring for the environment, but equally importantly, they help to increase the awareness of society in general. As a result of their innovation, we can hold onto the hope of achieving our goal: emissions neutrality by the middle of the 21st century.
Did you like the article? Read more and subscribe to our monthly newsletter!

#Categories

Next article
How Satellite Data Helps Us Understand Climate Change
Editor’s note: This article was written as part of EO Hub – a journalistic collaboration between UP42 and Geoawesomeness. Created for policymakers, decision makers, geospatial experts and enthusiasts alike, EO Hub is a key resource for anyone trying to understand how Earth observation is transforming our world. Read more about EO Hub here.
Climate change is arguably the most existential threat facing humanity. The question of how humanity’s actions will affect the Earth and its environment is no longer solely the domain of academic debate or theoretical research. Today, the scientific community overwhelmingly agrees that climate change is real, and that it will have a severe economic and social impact on all of us. Its effects can be observed and experienced every day—fires, floods, droughts, melting glaciers, hotter summers, snowless winters, and unexpected hurricane-force winds are just a few examples.
By now, we understand that climate change is real (and a serious problem). But how do we define climate change and its causes—and how do we measure it, using satellites and other data sources?
Climate change and its causes
Our climate system is composed of several elements:
- the atmosphere (the air that envelops the Earth’s surface)
- the hydrosphere (the fresh and salt waters of the earth)
- the cryosphere (the ice on the earth’s surface)
- the biosphere (all living plants and animals)
- the lithosphere (solid land on our planet)
They form a complex ecosystem in which all these elements interact and try to remain in harmony. When any of these elements are out of balance, negative consequences start to occur with higher severity and frequency (e.g., sea level rise, heat waves, droughts, floods, or severe storms).
Some argue that climate change is a natural process which has been ongoing for about 4.5 billion years. It’s true that cooling, warming, and the transgressions and regressions of the oceans are a familiar scenario on Earth. However, what is now alarming is the rapid pace of these changes. The pace of this current anthropogenic climate change is the fastest in two thousand years, and concentrations of major greenhouse gasses far exceed those of the last 800,000 years.
Since 1750 (the symbolic date of the start of the Industrial Revolution), atmospheric concentrations of Carbon Dioxide (CO2) have increased by 47 percent, Methane (CH4) by 156 percent, and Nitrous Oxide (N2O) by 23 percent. In the past, such large changes in atmospheric concentrations of these gasses have occurred over thousands, not hundreds, of years. In addition, it should be noted that in the years 2011-2020, the average temperature of the Earth was as much as 1.09°C higher than in the years 1850-1900, and sea levels have risen by 20cm. The numbers speak for themselves, and without concrete actions we will unfortunately experience the devastating effects of global warming during our lifetime.
So, we know what climate change is, but what causes it? Misinformation and debunked climate myths can be found across the media, but scientists are unanimous in agreeing that human activity is the single biggest contributor to climate change. These activities range from the burning of fossil fuels to deforestation, and are associated with multiple human needs, including transportation, increased energy consumption, population growth and the expansion of agricultural land. All these factors contribute to the emission of greenhouse gasses into the atmosphere and what is known as ‘the greenhouse effect’. Despite international commitments, the level of carbon dioxide in the atmosphere continues to rise at an alarming rate.
Observing our climate from space
Since the launch of the first weather satellite in 1959, Earth observation satellites have proven to be essential tools for climate research. This was the first time in the history of humankind that we were able to observe our planet as a whole. Just a decade later, satellites provided early insight into the impact of human activities and helped reveal the widening hole in the ozone layer. The following years brought us the first maps of carbon dioxide concentration and sea surface temperature. Consequently, technological advances and innovations—such as faster data rates, miniaturized designs, and upgraded data storage capabilities—have made satellites an integral part of missions focused on climate change. Estimates of changes and future scenarios would be impossible without the knowledge provided from space.
Today, Earth observation technologies allow us to collect data and information about the Earth’s continents, oceans, and atmosphere. Satellite data helps us understand the climate system and allows us to monitor greenhouse gas concentration, weather patterns, sea levels, temperature, vegetation health, melting of glaciers and polar ice, bleaching of coral reefs, ocean pollution, and changes in wildlife migratory patterns—among others. In fact, more than half of the 50 most useful variables for assessing climate change can be obtained through satellite data.
So we’ve covered the causes of climate change, and how we can monitor it using Earth observation data. Now, let’s see how it works in practice by referring to several studies where Earth observation data is helping to assess different climate variables.
Ice Cover Changes
In 2017, the world was abuzz with the news that a huge iceberg, larger than the state of Delaware, had broken away from the Antarctic ice sheet. This finally woke many people up to the realization that climate change is happening right before our eyes.
It is extremely important to systematically monitor glaciers—including the volumes of ice mass and mass balance—and their effect on rising sea levels. The Sentinel-3 satellite, for example, measures the topography, temperature, and condition of marine and ocean environments, which helps with forecasting climate change.
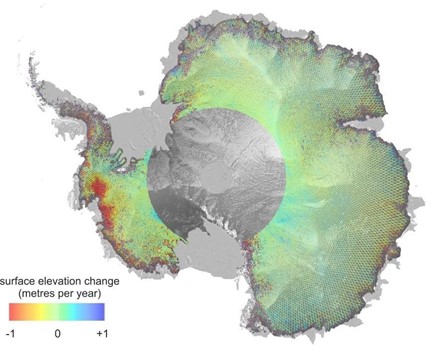
Copernicus Sentinel-3 maps Antarctic Ice Sheet elevation change
Similarly, a study by NASA used data from the ICESat-2 satellite (launched in 2018) and its predecessor ICESat (which operated from 2003 to 2009) to summarize changes in ice thickness in Greenland and Antarctica between 2003 and 2019. The conclusions drawn show that the loss of Antarctic and Greenland ice is responsible for a 14 mm rise in ocean levels over the past 16 years. This is almost a third of the total rise observed globally during this period. In Greenland particularly, historical data shows that melting rates are almost 6 times higher when compared to the 1960s.
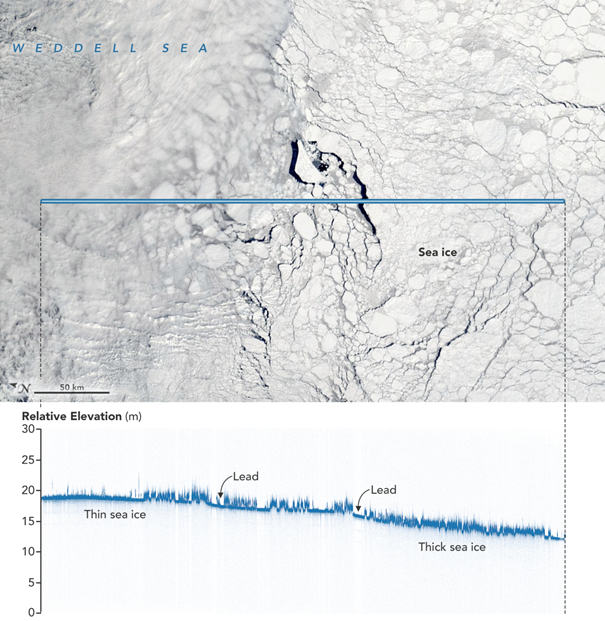
Sea ice of different thickness, in this graph of photon returns from ICESat-2 as it orbits over the Weddell Sea in Antarctica. Image: NASA Earth Observatory/Joshua StevensDeforestation
“In the last 10 years, a forest of 8.4 million football fields has been cleared in the Amazon,” the Royal Statistical Society reported in 2020, basing their claim on data from Brazil’s National Institute for Space Research (INPE). Indeed, every minute, an area of rainforest the size of more than three football fields disappears. It is also worth mentioning that one fifth of the world’s freshwater resources are located in the Amazon basin. A lack of this water results in droughts, which can lead to devastating forest fires.
Trees also act as carbon storage: 180 billion tons of carbon dioxide is stored in the Amazon jungle. When trees are cut down or burned, all that CO₂ is released back into the atmosphere. According to scientists, tropical deforestation produces more carbon dioxide than all the vehicles in the world.
Data from NASA; MODIS images of Amazon deforestation in Rondônia from 2000 to 2010
The state of Rondônia in western Brazil has become one of the most deforested parts of the Amazon. The above images were created using data from NASA’s MODIS Terra satellite from 2000 to 2010. The region presented here shows a rapid deforestation process following a predictable and repeatable pattern. First, trees are cut down along the roads, then more and more spurs and illegal roads appear surrounding the cleared areas.
The spatial resolution of satellite imagery is high enough to clearly see the pattern of ongoing deforestation. Areas are being used for cultivation of crops, but over the course of several years, heavy rains and erosion destroy the soil and consequently the yields decrease. Therefore, farmers convert degraded areas into pastures for cattle, clear more forest areas for cultivation, and the cycle continues.
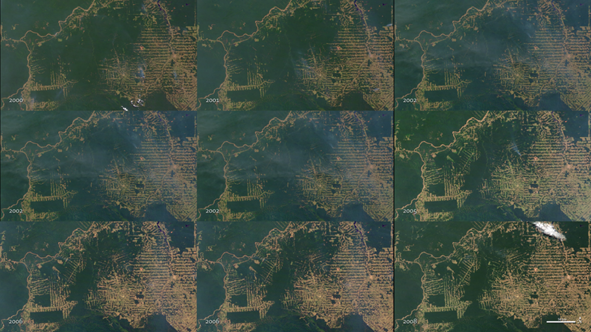
Cambodian authorities are also facing massive deforestation problems. This situation is due to a combination of global rubber prices and land concession agreements. The Global Forest Watch platform provides tools and data on forests based on NASA satellite images, which show a sprawling rubber plantation popping up in place of what once appeared to be dense forest. According to the data, the plantations began appearing in 2009 and in just 5 years, 19,000 hectares of tree cover had been cleared. We can see the current amount of deforestation, the percentage of tree cover loss, and its progress by viewing the satellite images as a time lapse:
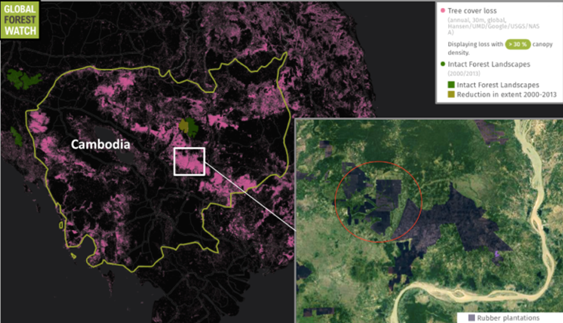
Progressive deforestation in Cambodia shown in Global Forest Watch app
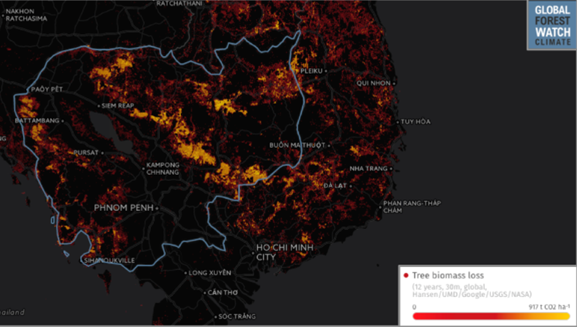
Greenhouse gas detection
As previously mentioned, a major consequence of large-scale deforestation is the release of huge amounts of CO2. Global Forest Watch Climate data shows that the loss of 1.59 million hectares of forest in Cambodia alone, over 14 years, has resulted in the emission of about 533 million metric tons of carbon dioxide. In contrast, Canada’s energy consumption in 2011—which ranks ninth highest in the world—contributed to 552.5 million metric tons of CO2 emissions. A frightening comparison.
On October 13, 2017, ESA launched Sentinel-5P, one of the world’s most advanced pollution-monitoring satellites. Using its data, we can track trace gasses that significantly affect air quality, including carbon monoxide, nitrogen dioxide, and ozone. The use of Sentinel-5P is expected to contribute to the EU’s fight against the global problem of air pollution, which leads to millions of deaths every year. A new spectrometer, the TROPOspheric Monitoring Instrument (or Tropomi), allows the satellite to look more closely at the Earth’s surface and provide highly detailed data on the state of the atmosphere at resolutions as high as 7 x 3.5 km, allowing it to detect air pollution in individual cities. Tropomi has the additional capability to locate emitted pollutants, effectively identifying so-called pollution hot spots.
According to ESA, in 2020, the hole in the ozone layer over Antarctica reached a size of 25 million km2, and was one of the largest and deepest seen in recent years. Diego Loyola of the German Aeronautics and Space Center comments: “Our observations show that the 2020 ozone hole has expanded rapidly since mid-August and covers most of the Antarctic continent—its size is well above average. It is also interesting to note that the 2020 ozone hole is one of the deepest, and shows record low ozone values. Total ozone column measurements from the Tropomi instrument on Sentinel-5P reached nearly 100 Dobson units on October 2.”
Depth of the 2020 ozone hole, Copernicus Sentinel data
However, there is some good news. The findings of a new UN-backed study showing the ongoing healing of the ozone layer are being hailed as a demonstration of what global agreements can achieve. This is an inspiration for more ambitious climate action to halt a catastrophic rise in world temperatures. Projections show that if the rate of ozone layer regeneration continues, it will return to 1980 levels as early as the 2030s in the northern hemisphere’s central latitudes, and around the middle of this century in the southern hemisphere.
Desertification
The greatest environmental challenge of our time—this is how desertification, which is significantly exacerbated by climate change, is described by many. While many may think of it as only a problem for those who dwell at near-equatorial latitudes, the issue actually extends far beyond these areas. Food security and livelihoods could be threatened for up to two billion people globally.
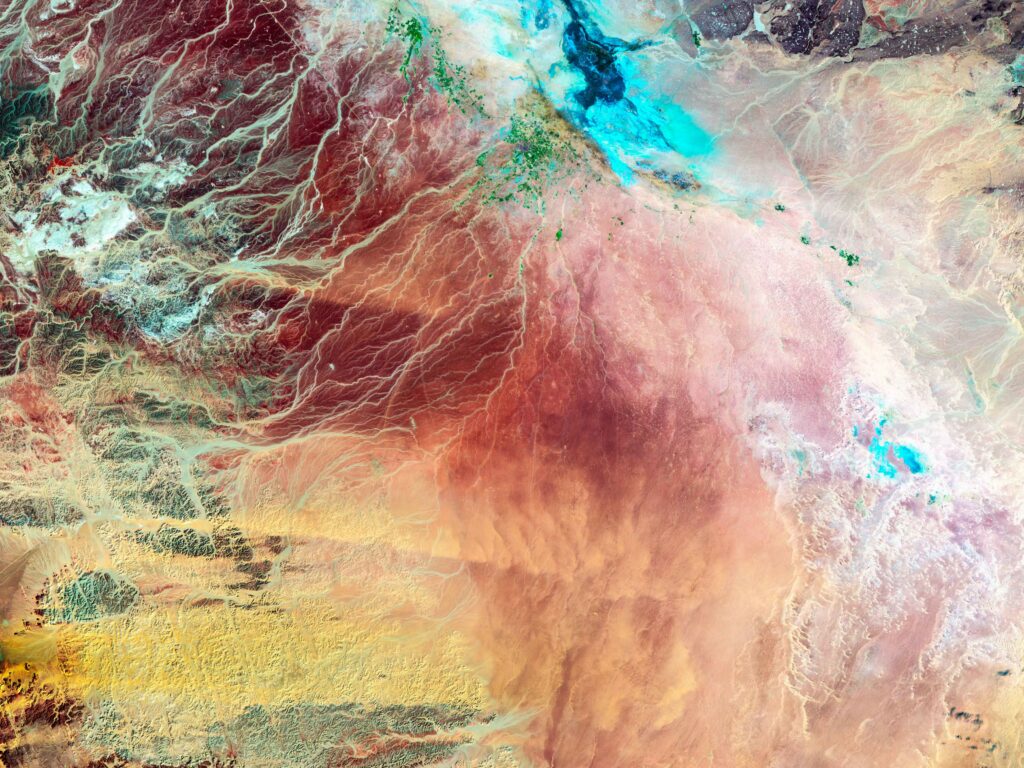
Medium- and high-resolution satellite images provide a glimpse of local land degradation. Additionally, multiple vegetation indices indicate potential desertification sites, the identification of which can help to focus the efforts of scientists conducting fieldwork. The Ikonos image below shows single trees (dark circles), agricultural plots (polygon outlines), and a small village (dark spot in the center) in Mali.
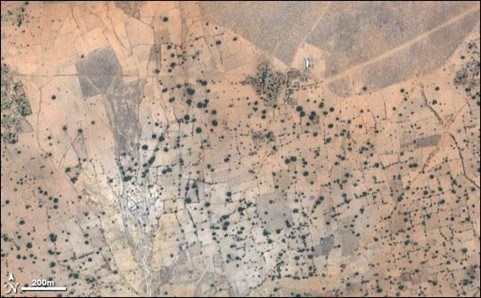
Image by Robert Simmon, based on data copyright GeoEye and distributed via the USGS EarthExplorer
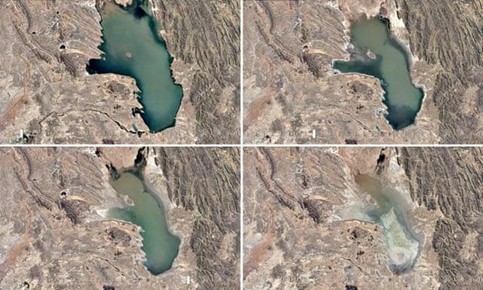
Lake Poopó, Bolivia, photo shows the progressive disappearance of the lake
Coral reef
Although coral reefs cover only 0.1% of the ocean’s surface, they are home to 25% of all marine organisms living on our planet. In addition, they are a source of food and livelihood for millions of people. Alarmingly, we have already lost half of all coral reefs in the world and the remaining parts remain under enormous pressure. Climate models estimate that we could lose up to 90% of this tropical habitat by the middle of this century. All that would take is an average temperature increase of 1.5°C—which is, unfortunately, a very possible scenario.
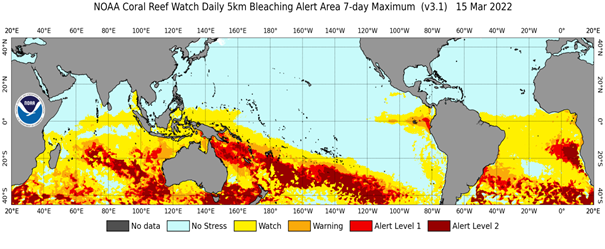
NOAA Coral Reef Watch
Major causes of coral reef extinction include increasing average water temperatures, decreasing oxygen content, increased CO2 absorption (leading to ocean acidification), and overfishing. NOAA Coral Reef Watch (CRW) has continuously provided daily information on heat stress associated with coral bleaching since 1985. It forms the basis of CRW’s Decision Support System (DSS) for coral reef management, allowing it to monitor 95% of the world’s coral reefs.
Conclusions
According to the World Meteorological Organization, carbon dioxide reached another record high in 2019—an increase of almost 150 per cent compared to 1750. The increase of CO2 affects the rising of temperatures on land and in water bodies, which in turn causes melting glaciers and wildfires, which release more carbon dioxide and methane into the atmosphere. It’s a vicious circle.
Some scientists claim that we have reached the point where, even if greenhouse gas emissions are reduced, certain changes are already irreversible. Surely, however, it is worth trying, and that begins by analyzing the data and measuring the change.
With more satellites in Earth’s orbit than ever before, collecting data is no longer the obstacle. The challenge now lies in accessing and analyzing that data. Platforms like UP42 are making this easier: they provide a wide variety of data from different providers, as well as algorithms for faster and easier analysis. This kind of accessibility will ensure that we’re well-equipped in the fight against climate change.