Introduction to Satellite Imagery and its Relevance to Disaster Management

Since the dawn of time, natural disasters have posed a huge problem for life on earth. Consequently, in their aftermath, a rapid assessment of the extent of the damage is necessary in order to mitigate the damage as quickly as possible and to allocate aid to the affected areas. Satellite imagery is playing an increasingly important role in this process by providing comprehensive images of the damage caused by floods, earthquakes and other disasters. Satellite imaging technology has developed significantly over the years, enabling us to see and know more. It enables us to pinpoint the exact location of the disaster, the extent of the damage, and the consequent changes in the landscape. Additionally, technology can be used to monitor the progress of response efforts over time, allowing us to identify areas where further assistance is needed.
Natural disasters are becoming more frequent and destructive, and there is nothing science and technology can do to prevent or control significant disasters. Consequently, the need for better preparedness and response measures is greater than ever before. Disaster management is now the biggest challenge facing vulnerable areas. As such, it is crucial that emergency managers have access to up-to-date and accurate information on the location and severity of disasters. In these situations, every second counts, so data must be updated in real time to fully support rescue processes.
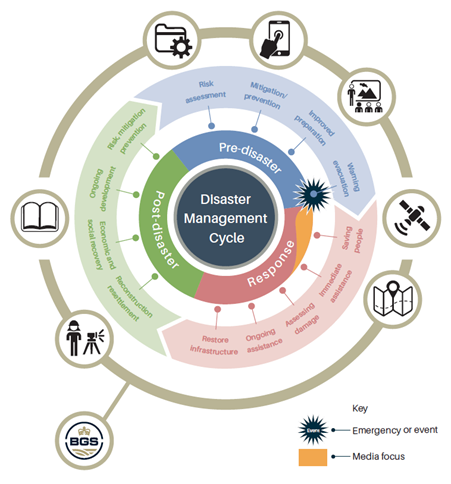
Full cycle of disaster management, Source: The International Charter Space and Major Disaster/ESA GSE RESPOND
This topic will now be narrowed to a discussion of how satellite imagery can help in the event of a specific type of disaster – earthquakes. Satellite data is used extensively by emergency organisations. Scientists analyse ground movement, providing valuable information for authorities to make informed decisions about planning and reconstruction. Rescue teams, in turn, can use maps generated from satellite data to navigate through the rubble to areas that have been severely damaged to help prioritise emergency responses and determine the safest routes, including avoiding bridges that may have been damaged. This enables rescuers to reach remote areas where assistance is severely limited. In addition to providing maps, satellite imagery, and in this case radar imagery, is used to observe and study geological changes resulting from seismic events. This is valuable knowledge that provides scientists with information about potential future earthquakes.
Benefits of using satellite imagery in earthquake disaster management and recovery
As mentioned earlier, satellite imagery has become an important tool in disaster planning and management. The information obtained through EO can be used for more effective disaster management planning, as well as earthquake recovery. Here are some, in my opinion, of its most important advantages:
- Rapid damage and impact assessment – Satellite imagery provides rapid and accurate information about the location of the disaster. This helps decision-makers to immediately assess the situation and plan effective responses.
- Efficient resource allocation and prioritisation – EO data enables damaged locations to be remotely assessed to determine the urgency and extent of the assistance required, and therefore how to prioritise relief efforts.
- Better coordination and communication between the various stakeholders – Thanks to remote data access, all parties involved have simultaneous access to the information. Situation monitoring is fast and efficient due to minute-by-minute earthquake monitoring. Thanks to satellite imagery, the progress of recovery efforts can also be monitored.
- Improved monitoring of recovery and reconstruction efforts – With satellite imagery, the progress of recovery efforts can be more accurately monitored. This imagery can be used to identify areas that are particularly vulnerable to further damage, enabling local authorities to better target their response efforts.
- The ability to commission tasks quickly using platforms such as UP42 – Not every disaster authority has immediate access to specialised data. Platforms that provide satellite data of interest are perfect for this. These images can be processed and analysed as preferred to extract the information that is most important.

Challenges in implementing satellite imagery for earthquake disaster management and recovery
Satellite imagery has very promising potential for earthquake support. However, like all new technologies, it is not without challenges.
- Technical limitations – Satellite imagery has technical limitations that can, unfortunately, make disaster management more difficult after an earthquake. The most important and common limitations include: spatial resolution (which makes it impossible to see fine details), and cloud cover that obscures part of the image, making analysis impossible.
- Financial and logistical constraints – There is no denying that the cost of acquiring and analysing satellite data is high. There are times when it is too high for vulnerable communities to access the necessary resources.
- The need for skilled manpower – Satellites capture a huge variety of data. This data is analysed using complex algorithms and computer models to identify potential seismic activity. To extract the information of interest and then analyse it requires staff who are specialists in this narrow field, and often in short supply.
Real-world examples of satellite imagery in action
The role of satellite imagery in the aftermath of the 2010 Haiti
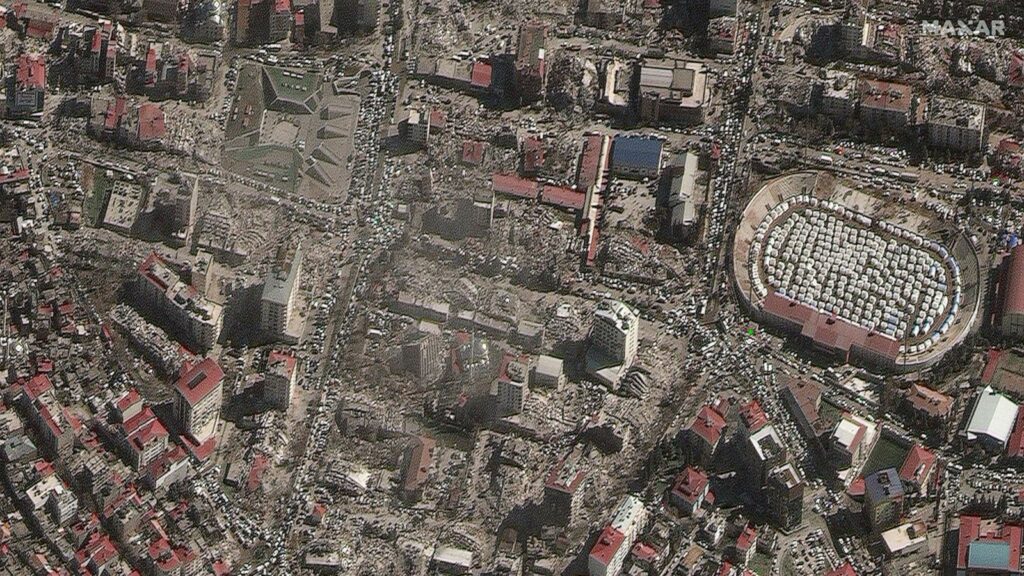
On 14 August 2021, an earthquake measuring 7.2 on the Richter scale struck western Haiti, causing extensive damage and a significant number of deaths. The scale and impact of this disaster raises questions about how to better prepare for and respond to these events. One potential solution is before-and-after satellite imagery that shows the full extent of the devastation. As Space notes, images taken in January 2020 and again on 15 August 2021 show hospitals, churches and hotels before and after the quake, and the extent of the damage. Some of the buildings were completely turned to rubble.
A different view of the impact is proposed by NASA’s Jet Propulsion Laboratory (JPL) on the basis of satellite images it has acquired. Using interferometric radar images acquired before and after the earthquake (3 and 15 August 2021), teams from JPL and the California Institute of Technology created a map of the deformation of the Earth’s surface. The map aims to show the permanent movement of the terrain caused by the earthquake. Areas that were highlighted in blue moved towards the satellite (upwards and eastwards), while those highlighted in red moved away (downwards and westwards). The star represents the epicentre of the quake, which moved westwards along the existing fault line. The dark blue and red areas represent the greatest movement of the Earth’s surface.
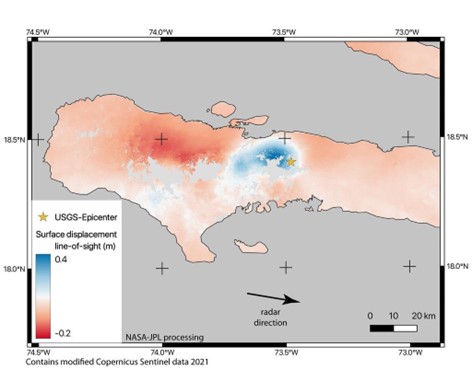
Analysis of these data provides the opportunity to better understand specific fault features, such as depth and direction, which can provide more accurate modelling of earthquakes over time. In addition, these images enable the assessment of areas of increased risk. Continuous imaging can reveal ongoing ground motion that may indicate aftershocks or a potential second earthquake, which in turn helps rescuers prioritise resources in these areas. Interpretation of the data also helps to show damage to buildings or road infrastructure that may pose problems for rescue teams.
Satellite-based assistance in the 2015 Nepal earthquake response and recovery efforts
On 25 April 2015, a powerful 7.8 magnitude tremor, the Gorkha earthquake struck just before noon, local time, along the border where the Indian plate meets the Eurasian plate. Lasting less than a minute, the initial quake killed around 9,000 people, and additional tremors and aftershocks continued for months. In a coordinated effort, analysis began to collect satellite information on the damage from both international and national sources. The data was then disseminated to partners who needed it most, such as USAID, USGS and the International Centre for Integrated Mountain Development (ICIMOD), based in Kathmandu. This effort used multiple NASA satellites, DigitalGlobe and image mosaics. These key optical data helped to initially identify which regions were damaged or destroyed by the earthquake, and where to direct humanitarian aid. Unfortunately, in addition to the initial damage, subsequent aftershocks caused additional landslides, avalanches and flash floods due to blocked rivers and interrupted glacial lakes. Thanks to observations from space and on the ground, it was possible to locate all the dangers and create a composite map of more than 4,300 landslides.
Satellite support during earthquake assessments in Turkey and Syria
The earthquake that hit Turkey and Syria earlier this year caused a huge amount of destruction in both countries, with a death toll of more than 45,000. The Turkish authorities, together with the International Federation of Red Cross and Red Crescent Societies and the United Nations, launched the International Charter, ‘Space and Major Disasters’. The Charter provided satellite images of affected areas from various space agencies, which greatly assisted local teams in rescue operations. More than 350 crisis images from 17 space agencies from around the world were provided. In addition, damage classification maps were created from high-resolution optical images. The entire mapped area covered as much as 664 km2.
Simonetta Cheli, Director of Earth Observation Programmes at ESA, commented, “Space is very relevant in cases of natural disasters such as the Türkiye-Syria earthquakes. It is our job when a natural disaster or a humanitarian crisis occurs to coordinate via the International Charter with partner agencies and with the Copernicus Emergency Mapping Services. We are closely following efforts to provide timely Earth observation data to disaster relief teams on the ground.”
Radar imagery was also used to enable scientists to observe and analyse the impact of earthquakes on land. The Copernicus Sentinel-1 mission is equipped with a radar that can detect land and ‘see’ through clouds, both day and night. This allows surface displacement and deformation to be assessed.
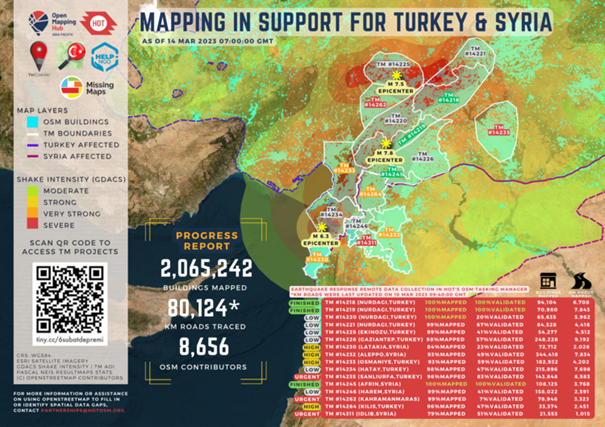
Summary of HOT Tasking Manager Mapping in Support of Turkey & Syria on 14 March 2023
The future of satellite imagery in disaster management and recovery
In recent years, satellite data has become an essential tool for disaster damage assessment. Their ability to provide high-resolution imagery is invaluable in understanding the scale and impact of disasters on both infrastructure and human populations. While the technology has been on the market for a while, it is developing rapidly by integrating ever newer solutions. Increasingly, AI is being used to assess damage after natural disasters, in addition to EO data. These advanced technologies allow for the rapid processing and analysis of vast amounts of data, such as satellite imagery, IoT sensor data and social media input, resulting in more accurate and faster damage assessments. Using machine learning and artificial intelligence algorithms, it is possible to identify patterns, assess the severity of damage and extract key information that would otherwise be difficult or impossible to obtain through manual methods.
Just as important as technology development is collaboration between the private and public sectors. Partnerships enable the pooling of resources, knowledge and innovative solutions, which ultimately contribute to a more effective and rapid response to natural disasters. An example worth mentioning is the collaboration between satellite data providers such as GeoEye and DigitalGlobe and the United Nations after the 2010 earthquake in Haiti. It facilitated the identification of displaced people, and damage assessments, and enabled more targeted and effective relief efforts. Additionally, satellite imagery was widely shared, and engaged the community in mapping initiatives to support rescue and recovery efforts. Collaborations between the private and public sectors are of great value in improving disaster response and recovery efforts.
Did you like the article? Read more and subscribe to our monthly newsletter!

#Categories

Next article
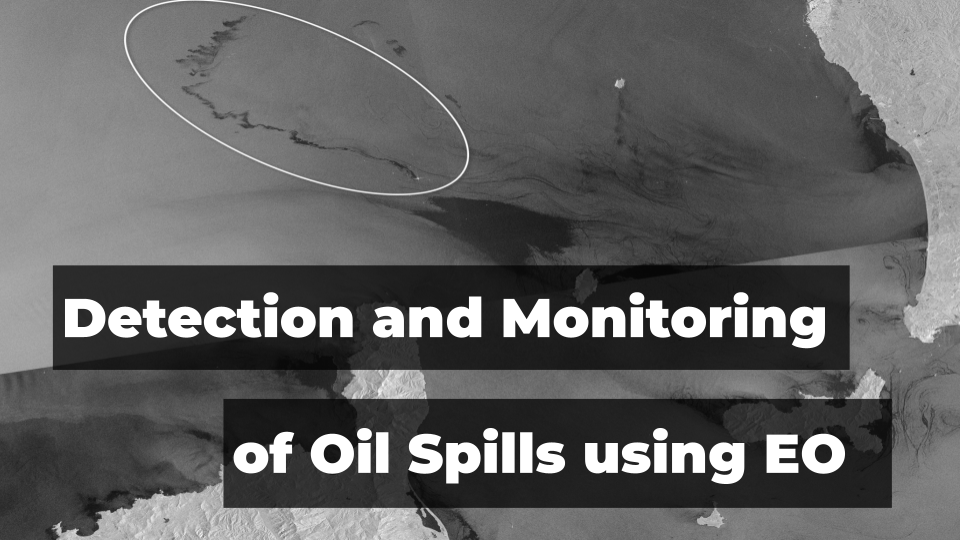
Leveraging Satellite Technology for Advanced Detection and Monitoring of Oil Spills

The critical importance of marine ecosystems cannot be overstated, given their vast contributions as significant nutrient reservoirs and oxygen providers. These ecosystems also sustain ecological equilibrium, rendering their preservation indispensable. However, these vital systems are perennially threatened by natural and man-made disasters, with oil spills representing one of the most devastating and frequent occurrences. Studies show that approximately 50,000 tons of crude oil find their way into our oceans annually, painting a grim picture of marine pollution.
Oil spills predominantly occur during the marine transportation of oil. Despite numerous international environmental regulations and stringent operating procedures to prevent such catastrophes, the menace of oil spills persists. The types of oil spills range from light oils that, despite their rapid evaporation, pose high toxicity to heavy oils that, while less toxic, persist in the environment for an extended time. Once released into the water, these oils swiftly spread, forming a thin surface layer known as an “oil slick.” Amplified by wind, waves, and currents, spills can expand over vast areas, inflicting severe environmental damage.
Harnessing Satellite Technology for Oil Spills
To mitigate the damage to marine life and human health, oil spills must be detected promptly and monitored carefully to avert subsequent environmental hazards. The evolution of technology has engendered innovative tools and methodologies to achieve rapid and accurate detection and monitoring of oil spills. Among these, remote sensing satellite imagery has proven particularly effective, providing oceanographers and responders with relevant data to detect, track and monitor oil spills in near real-time.
Satellites are the eyes in the sky that can help us identify problems occurring in even the most difficult-to-reach areas on Earth. Oceans, for instance, are too vast to be monitored effectively through any other means. Remote sensing technology can help responders get the visual data required to understand the extent of the disaster over huge areas. Such data can be then combined with other data sources to build advanced analytical workflows using different remote sensing tools and platforms.
Researchers typically rely on both optical and SAR data types for in-depth analysis of the location, shape, size, colour, and orientation of an oil spill at any given time. The baseline analysis starts with passive optical sensors. RGB optical data from satellites such as Landsat or Sentinel-2 allow the detection of sunlight reflected by oil, which can be differentiated from the surrounding water in clear weather conditions. Particularly useful, however, are Infrared (IR) and Near-Infrared data, which have proven to be very effective in the non-visual spectrum of light.
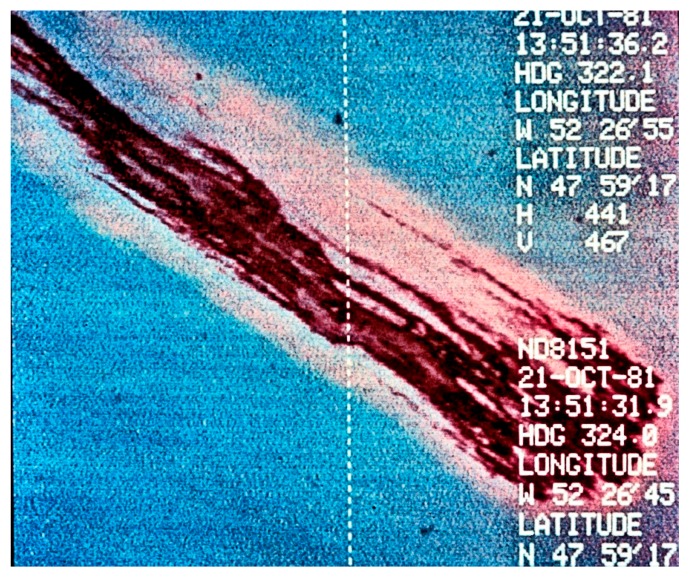
Source: IR example of the oil slick (Photo from Environment Canada)
Visible spectrum imagery is useful but can be obstructed by weather and sun glint, therefore, scientists more often rely on Synthetic Aperture Radar (SAR) data, which can provide data independently of sunlight or weather conditions. Satellite radar is particularly useful for monitoring the progression of oil spills because the presence of oil on the sea surface dampens down wave motion. Since radar basically measures surface texture, oil slicks show up well–as black smears on a grey background.
Source: ESA
Another challenge for scientists is estimating the thickness of an oil slick. One of the most common techniques is to observe its “colour” and assign a thickness based on established guidelines for thickness ranges. Tables and guidelines for visual estimation of oil spill volumes are published by the National Oceanic and Atmospheric Administration (NOAA) on their response and restoration website.
Monitoring Changes and Predicting Trajectories
Satellite technology is an invaluable tool for monitoring changes in oil slicks, enabling responders and oceanographers to accurately predict the oil’s future location. By updating oil spill trajectory models with the latest satellite observations of surface oiling extent, planning of clean-up actions becomes more effective.
The significance of satellite imagery was vividly demonstrated during the Deepwater Horizon oil spill, also known as the “BP oil spill,” which began on April 20, 2010, off the United States Gulf of Mexico coast. With an estimated discharge of 4.9 MMbbl (Million Barrels), this catastrophe marked the largest marine oil spill in the petroleum industry’s history and one of the most significant environmental disasters globally.
Satellite imagery played a critical role in containing this disaster by measuring the spill’s extent and identifying areas off-limits to fishing due to oil contamination. In addition, the National Oceanic and Atmospheric Administration (NOAA) utilized satellite data to monitor circulation patterns in the Gulf of Mexico, closely track the slick’s position relative to the Loop Current, and assess the risk of oil spread to other coasts.
Such cases highlight the importance of having highly accurate satellite data as provided by platforms like UP42.
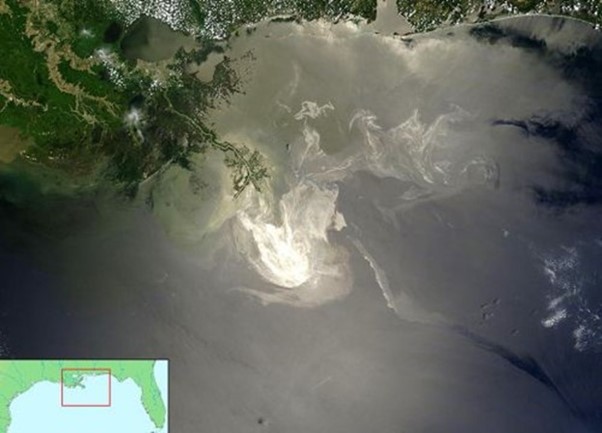
Source: NOAA
Preventing Oil Spills
It has been well established that satellite technology has all the capabilities to provide responders with a comprehensive and timely view of the effects of oil spills. Satellite technology facilitates quick and accurate detection of the presence of oil spills, thereby paving the way for a rapid and more effective response. It is essential to reduce the risk of oil spill disasters to protect the environment and reducing economic losses.
There is ongoing research to further refine remote sensing satellite technology to conduct oil spill surveillance, identify pollution causes, and detect minor spills before they escalate into widespread disasters. This preventative strategy, known as oil spill surveillance, forms a critical component of oil spill disaster management, further highlighting the role of satellite technology in environmental protection.
Did you like the article? Read more and subscribe to our monthly newsletter!