How Satellite Data Helps Us Understand Climate Change

Editor’s note: This article was written as part of EO Hub – a journalistic collaboration between UP42 and Geoawesomeness. Created for policymakers, decision makers, geospatial experts and enthusiasts alike, EO Hub is a key resource for anyone trying to understand how Earth observation is transforming our world. Read more about EO Hub here.
Climate change is arguably the most existential threat facing humanity. The question of how humanity’s actions will affect the Earth and its environment is no longer solely the domain of academic debate or theoretical research. Today, the scientific community overwhelmingly agrees that climate change is real, and that it will have a severe economic and social impact on all of us. Its effects can be observed and experienced every day—fires, floods, droughts, melting glaciers, hotter summers, snowless winters, and unexpected hurricane-force winds are just a few examples.
By now, we understand that climate change is real (and a serious problem). But how do we define climate change and its causes—and how do we measure it, using satellites and other data sources?
Climate change and its causes
Our climate system is composed of several elements:
- the atmosphere (the air that envelops the Earth’s surface)
- the hydrosphere (the fresh and salt waters of the earth)
- the cryosphere (the ice on the earth’s surface)
- the biosphere (all living plants and animals)
- the lithosphere (solid land on our planet)
They form a complex ecosystem in which all these elements interact and try to remain in harmony. When any of these elements are out of balance, negative consequences start to occur with higher severity and frequency (e.g., sea level rise, heat waves, droughts, floods, or severe storms).
Some argue that climate change is a natural process which has been ongoing for about 4.5 billion years. It’s true that cooling, warming, and the transgressions and regressions of the oceans are a familiar scenario on Earth. However, what is now alarming is the rapid pace of these changes. The pace of this current anthropogenic climate change is the fastest in two thousand years, and concentrations of major greenhouse gasses far exceed those of the last 800,000 years.
Since 1750 (the symbolic date of the start of the Industrial Revolution), atmospheric concentrations of Carbon Dioxide (CO2) have increased by 47 percent, Methane (CH4) by 156 percent, and Nitrous Oxide (N2O) by 23 percent. In the past, such large changes in atmospheric concentrations of these gasses have occurred over thousands, not hundreds, of years. In addition, it should be noted that in the years 2011-2020, the average temperature of the Earth was as much as 1.09°C higher than in the years 1850-1900, and sea levels have risen by 20cm. The numbers speak for themselves, and without concrete actions we will unfortunately experience the devastating effects of global warming during our lifetime.
So, we know what climate change is, but what causes it? Misinformation and debunked climate myths can be found across the media, but scientists are unanimous in agreeing that human activity is the single biggest contributor to climate change. These activities range from the burning of fossil fuels to deforestation, and are associated with multiple human needs, including transportation, increased energy consumption, population growth and the expansion of agricultural land. All these factors contribute to the emission of greenhouse gasses into the atmosphere and what is known as ‘the greenhouse effect’. Despite international commitments, the level of carbon dioxide in the atmosphere continues to rise at an alarming rate.
Observing our climate from space
Since the launch of the first weather satellite in 1959, Earth observation satellites have proven to be essential tools for climate research. This was the first time in the history of humankind that we were able to observe our planet as a whole. Just a decade later, satellites provided early insight into the impact of human activities and helped reveal the widening hole in the ozone layer. The following years brought us the first maps of carbon dioxide concentration and sea surface temperature. Consequently, technological advances and innovations—such as faster data rates, miniaturized designs, and upgraded data storage capabilities—have made satellites an integral part of missions focused on climate change. Estimates of changes and future scenarios would be impossible without the knowledge provided from space.
Today, Earth observation technologies allow us to collect data and information about the Earth’s continents, oceans, and atmosphere. Satellite data helps us understand the climate system and allows us to monitor greenhouse gas concentration, weather patterns, sea levels, temperature, vegetation health, melting of glaciers and polar ice, bleaching of coral reefs, ocean pollution, and changes in wildlife migratory patterns—among others. In fact, more than half of the 50 most useful variables for assessing climate change can be obtained through satellite data.
So we’ve covered the causes of climate change, and how we can monitor it using Earth observation data. Now, let’s see how it works in practice by referring to several studies where Earth observation data is helping to assess different climate variables.
Ice Cover Changes
In 2017, the world was abuzz with the news that a huge iceberg, larger than the state of Delaware, had broken away from the Antarctic ice sheet. This finally woke many people up to the realization that climate change is happening right before our eyes.
It is extremely important to systematically monitor glaciers—including the volumes of ice mass and mass balance—and their effect on rising sea levels. The Sentinel-3 satellite, for example, measures the topography, temperature, and condition of marine and ocean environments, which helps with forecasting climate change.
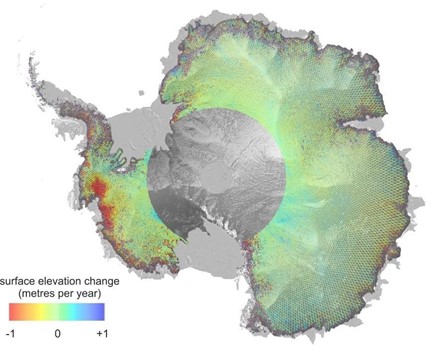
Copernicus Sentinel-3 maps Antarctic Ice Sheet elevation change
Similarly, a study by NASA used data from the ICESat-2 satellite (launched in 2018) and its predecessor ICESat (which operated from 2003 to 2009) to summarize changes in ice thickness in Greenland and Antarctica between 2003 and 2019. The conclusions drawn show that the loss of Antarctic and Greenland ice is responsible for a 14 mm rise in ocean levels over the past 16 years. This is almost a third of the total rise observed globally during this period. In Greenland particularly, historical data shows that melting rates are almost 6 times higher when compared to the 1960s.
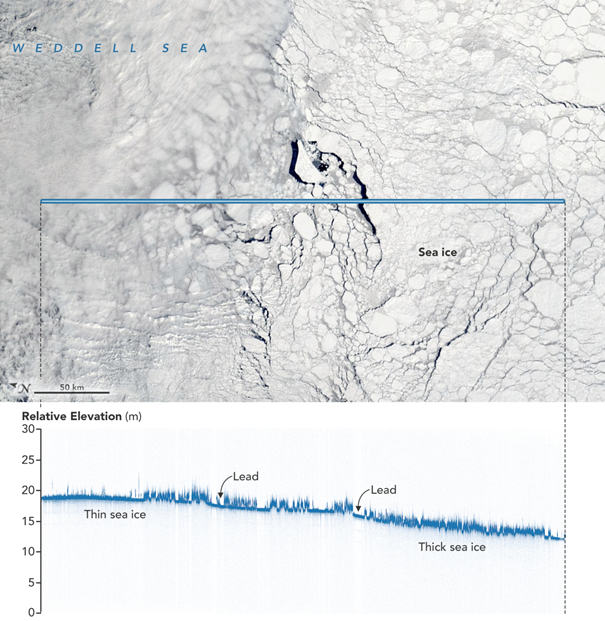
Sea ice of different thickness, in this graph of photon returns from ICESat-2 as it orbits over the Weddell Sea in Antarctica. Image: NASA Earth Observatory/Joshua StevensDeforestation
“In the last 10 years, a forest of 8.4 million football fields has been cleared in the Amazon,” the Royal Statistical Society reported in 2020, basing their claim on data from Brazil’s National Institute for Space Research (INPE). Indeed, every minute, an area of rainforest the size of more than three football fields disappears. It is also worth mentioning that one fifth of the world’s freshwater resources are located in the Amazon basin. A lack of this water results in droughts, which can lead to devastating forest fires.
Trees also act as carbon storage: 180 billion tons of carbon dioxide is stored in the Amazon jungle. When trees are cut down or burned, all that CO₂ is released back into the atmosphere. According to scientists, tropical deforestation produces more carbon dioxide than all the vehicles in the world.
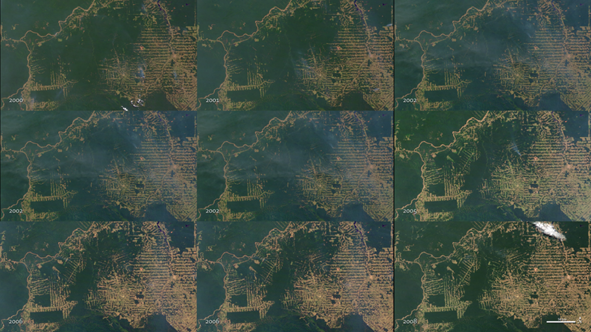
Data from NASA; MODIS images of Amazon deforestation in Rondônia from 2000 to 2010
The state of Rondônia in western Brazil has become one of the most deforested parts of the Amazon. The above images were created using data from NASA’s MODIS Terra satellite from 2000 to 2010. The region presented here shows a rapid deforestation process following a predictable and repeatable pattern. First, trees are cut down along the roads, then more and more spurs and illegal roads appear surrounding the cleared areas.
The spatial resolution of satellite imagery is high enough to clearly see the pattern of ongoing deforestation. Areas are being used for cultivation of crops, but over the course of several years, heavy rains and erosion destroy the soil and consequently the yields decrease. Therefore, farmers convert degraded areas into pastures for cattle, clear more forest areas for cultivation, and the cycle continues.
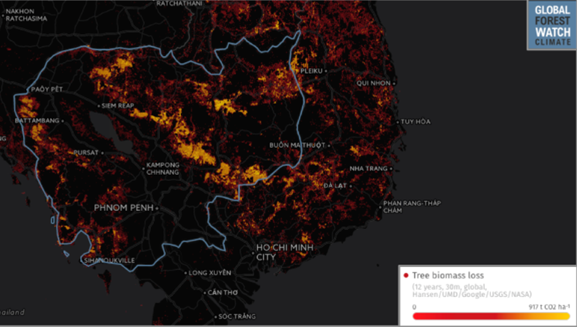
Cambodian authorities are also facing massive deforestation problems. This situation is due to a combination of global rubber prices and land concession agreements. The Global Forest Watch platform provides tools and data on forests based on NASA satellite images, which show a sprawling rubber plantation popping up in place of what once appeared to be dense forest. According to the data, the plantations began appearing in 2009 and in just 5 years, 19,000 hectares of tree cover had been cleared. We can see the current amount of deforestation, the percentage of tree cover loss, and its progress by viewing the satellite images as a time lapse:
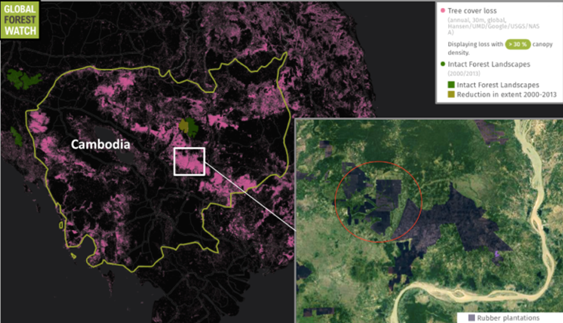
Progressive deforestation in Cambodia shown in Global Forest Watch app
Greenhouse gas detection
As previously mentioned, a major consequence of large-scale deforestation is the release of huge amounts of CO2. Global Forest Watch Climate data shows that the loss of 1.59 million hectares of forest in Cambodia alone, over 14 years, has resulted in the emission of about 533 million metric tons of carbon dioxide. In contrast, Canada’s energy consumption in 2011—which ranks ninth highest in the world—contributed to 552.5 million metric tons of CO2 emissions. A frightening comparison.
On October 13, 2017, ESA launched Sentinel-5P, one of the world’s most advanced pollution-monitoring satellites. Using its data, we can track trace gasses that significantly affect air quality, including carbon monoxide, nitrogen dioxide, and ozone. The use of Sentinel-5P is expected to contribute to the EU’s fight against the global problem of air pollution, which leads to millions of deaths every year. A new spectrometer, the TROPOspheric Monitoring Instrument (or Tropomi), allows the satellite to look more closely at the Earth’s surface and provide highly detailed data on the state of the atmosphere at resolutions as high as 7 x 3.5 km, allowing it to detect air pollution in individual cities. Tropomi has the additional capability to locate emitted pollutants, effectively identifying so-called pollution hot spots.
According to ESA, in 2020, the hole in the ozone layer over Antarctica reached a size of 25 million km2, and was one of the largest and deepest seen in recent years. Diego Loyola of the German Aeronautics and Space Center comments: “Our observations show that the 2020 ozone hole has expanded rapidly since mid-August and covers most of the Antarctic continent—its size is well above average. It is also interesting to note that the 2020 ozone hole is one of the deepest, and shows record low ozone values. Total ozone column measurements from the Tropomi instrument on Sentinel-5P reached nearly 100 Dobson units on October 2.”
Depth of the 2020 ozone hole, Copernicus Sentinel data
However, there is some good news. The findings of a new UN-backed study showing the ongoing healing of the ozone layer are being hailed as a demonstration of what global agreements can achieve. This is an inspiration for more ambitious climate action to halt a catastrophic rise in world temperatures. Projections show that if the rate of ozone layer regeneration continues, it will return to 1980 levels as early as the 2030s in the northern hemisphere’s central latitudes, and around the middle of this century in the southern hemisphere.
Desertification
The greatest environmental challenge of our time—this is how desertification, which is significantly exacerbated by climate change, is described by many. While many may think of it as only a problem for those who dwell at near-equatorial latitudes, the issue actually extends far beyond these areas. Food security and livelihoods could be threatened for up to two billion people globally.
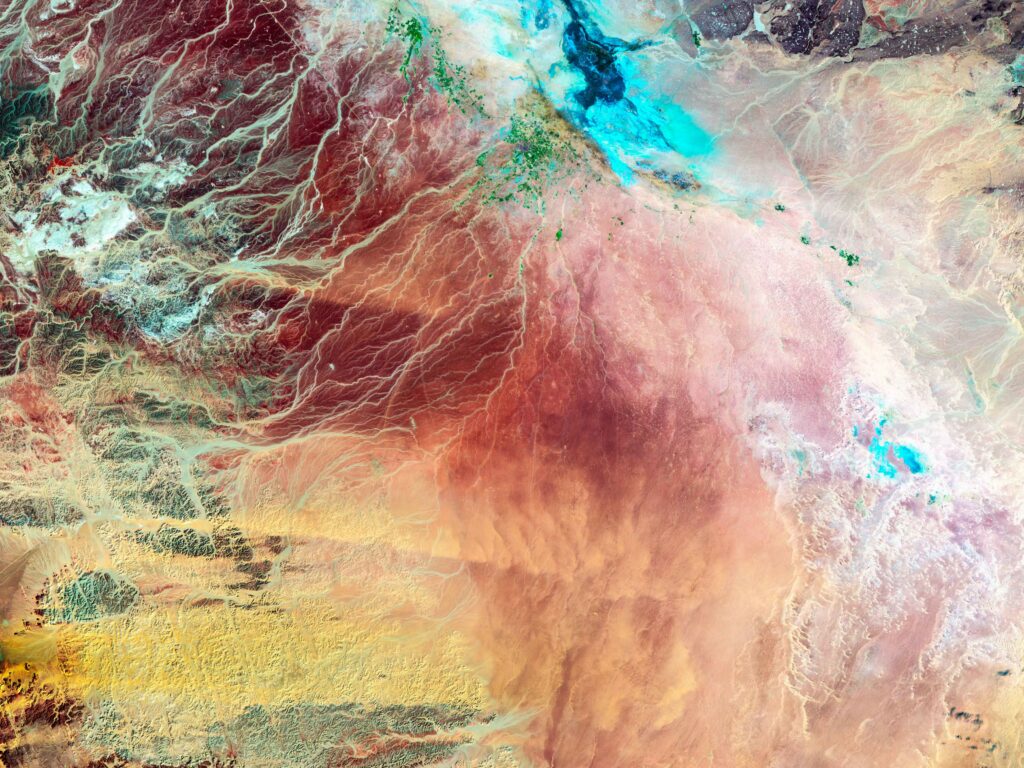
Medium- and high-resolution satellite images provide a glimpse of local land degradation. Additionally, multiple vegetation indices indicate potential desertification sites, the identification of which can help to focus the efforts of scientists conducting fieldwork. The Ikonos image below shows single trees (dark circles), agricultural plots (polygon outlines), and a small village (dark spot in the center) in Mali.
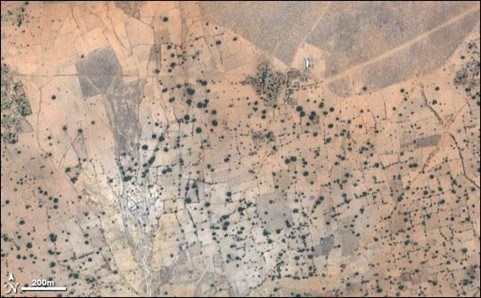
Image by Robert Simmon, based on data copyright GeoEye and distributed via the USGS EarthExplorer
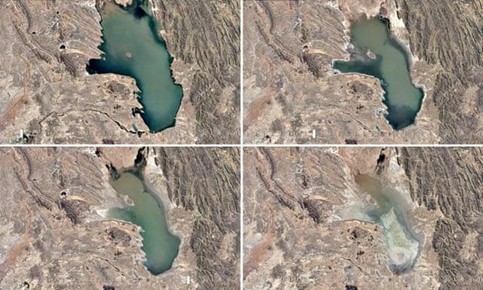
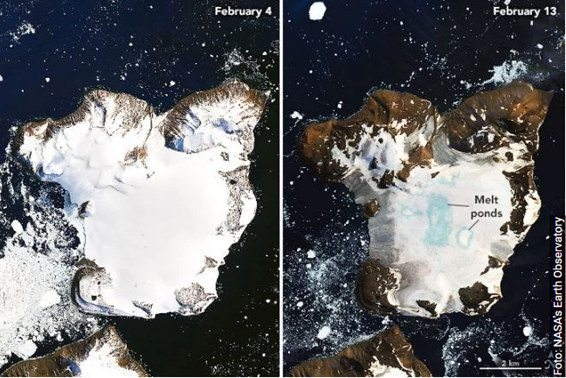
Lake Poopó, Bolivia, photo shows the progressive disappearance of the lake
Coral reef
Although coral reefs cover only 0.1% of the ocean’s surface, they are home to 25% of all marine organisms living on our planet. In addition, they are a source of food and livelihood for millions of people. Alarmingly, we have already lost half of all coral reefs in the world and the remaining parts remain under enormous pressure. Climate models estimate that we could lose up to 90% of this tropical habitat by the middle of this century. All that would take is an average temperature increase of 1.5°C—which is, unfortunately, a very possible scenario.
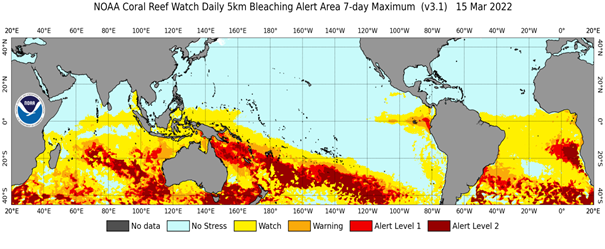
NOAA Coral Reef Watch
Major causes of coral reef extinction include increasing average water temperatures, decreasing oxygen content, increased CO2 absorption (leading to ocean acidification), and overfishing. NOAA Coral Reef Watch (CRW) has continuously provided daily information on heat stress associated with coral bleaching since 1985. It forms the basis of CRW’s Decision Support System (DSS) for coral reef management, allowing it to monitor 95% of the world’s coral reefs.
Conclusions
According to the World Meteorological Organization, carbon dioxide reached another record high in 2019—an increase of almost 150 per cent compared to 1750. The increase of CO2 affects the rising of temperatures on land and in water bodies, which in turn causes melting glaciers and wildfires, which release more carbon dioxide and methane into the atmosphere. It’s a vicious circle.
Some scientists claim that we have reached the point where, even if greenhouse gas emissions are reduced, certain changes are already irreversible. Surely, however, it is worth trying, and that begins by analyzing the data and measuring the change.
With more satellites in Earth’s orbit than ever before, collecting data is no longer the obstacle. The challenge now lies in accessing and analyzing that data. Platforms like UP42 are making this easier: they provide a wide variety of data from different providers, as well as algorithms for faster and easier analysis. This kind of accessibility will ensure that we’re well-equipped in the fight against climate change.

#Categories


Next article
Everything you ever wanted to know about SAR satellite data and the ecosystem but were afraid to ask

Editor’s note: This article was written as part of EO Hub – a journalistic collaboration between UP42 and Geoawesomeness. Created for policymakers, decision makers, geospatial experts and enthusiasts alike, EO Hub is a key resource for anyone trying to understand how Earth observation is transforming our world. Read more about EO Hub here.
The adoption of Earth Observation satellite technologies is accelerating. More and more companies and institutions are using satellite imagery to better understand the world and more closely observe relevant changes. However, those actors are also coming to the realization that optical satellite systems have their limitations.
The biggest barriers to the use of satellite imagery are cloud cover and limited usability of the data at night—of course, earthquakes or floods can happen at any time, regardless of the weather or time of the day.
Fortunately, optical images are not the only way to visualize the earth’s surface from a satellite. Synthetic Aperture Radar, or SAR, is a completely different way of generating a picture, actively ‘illuminating’ the ground rather than utilizing the light from the sun (as with optical images). SAR satellites beam radar waves to the surface of the earth and map the reflected signal. The system can penetrate clouds, see beneath tree canopies, and work in all weather conditions.

Satellite image in Luhansk and Donetsk (credited to Copernicus Open Access Hub) Left: Nothing can be observed in Sentinel-2 optical image, date: 27/02/2022 Right: Everything is clear in Sentinel-1 SAR image, date: 28/02/2022
It is also a rapidly growing part of the New Space movement, with several startups developing SAR microsatellites and challenging the more established players in the sector. The technology is attracting more interest—and with it, more finance. Finnish startup ICEYE has raised a total of $304 million so far and received Series D funding of $136 million in February 2022. Capella Space, a company in the United States, has raised a total of $80 million; and Spacety in China has also completed Series C financing recently. The New Space movement is also accelerating the access and availability of SAR data and analytics that can be built on the top with companies like UP42 among others pushing the industry forward.

Comparison between Optical and SAR (credited to Ursa Space)
How does SAR differ from optical data?
When they hear the words “satellite image”, most people envision something like a photograph taken from space—the sort of image that is easy to interpret with the human eye. SAR, on the other hand, is a totally different story. It is often referred to as “non-literal imagery”, because the raw data does not look like an optical image and is completely unintelligible to humans (see the image below).
The reason for this is that the SAR image doesn’t reflect the direct color and shape of the objects; it only contains the backscatter signal. With some tweaks, the images created by SAR can in fact be rendered into a terrain map more intuitive to humans, but in a typical scenario, SAR data is used to extract information via algorithms and machine learning models without humans ever looking at it.

SAR raw data from ERS-1 satellite (credited to ESA)
If users hope to obtain detailed information from SAR data, they need professional processing tools and knowledge. One of the limitations of working with SAR data is the tedious preprocessing, which can include: applying the orbit file, radiometric calibration, de-bursting, ‘multilooking’, speckle filtering, and terrain correction. After a long series of mathematical calculations and processing, a final image will float up to the surface.

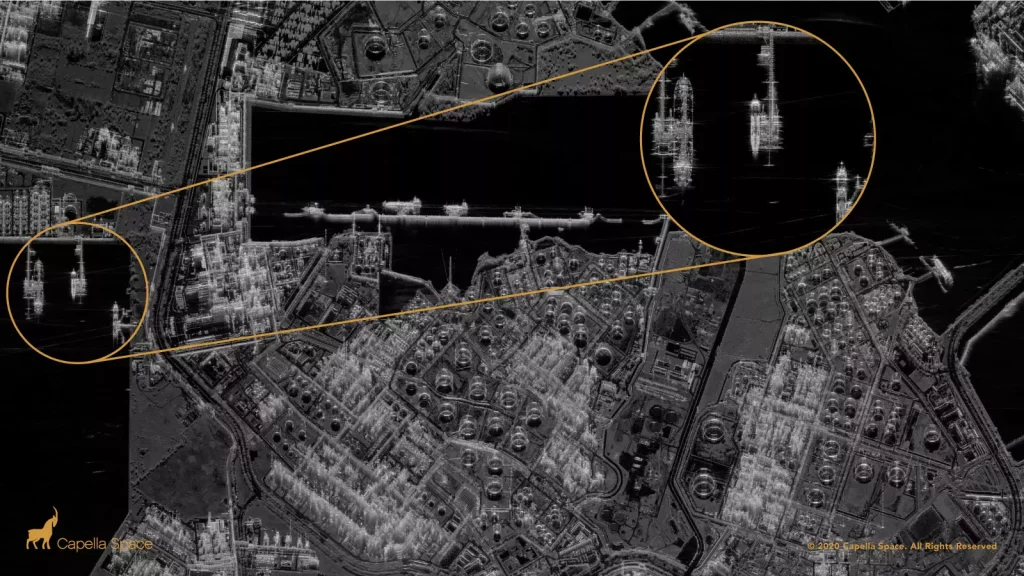
The metallic refining units and piping brightly reflect radar signals (credited to Capella Space)
In contrast to a colourful optical satellite image, SAR images are always black and white. In fact, this is not the color of the object, but the strength of the backscatter signal, which is rendered as brightness. For example, water absorbs most of the energy and doesn’t reflect much back, so it looks black in the image. Objects with a high metal content—such as ships, skyscrapers, and planes—appear much brighter, because they reflect most of the energy.
Since the data is so hard to process and interpret, lots of SAR companies don’t even provide the raw data to clients. Some of them, like ICEYE, only provide useful information from the interpreted results—flooding information, for example, as an Excel Sheet or Shapefile.
SAR market and demand
In recent years, SAR images have played an increasingly important role in international emergency events, such as the drone attacks against Saudi oil installations in 2019 and the Ever Given ship blocking the Suez Canal in 2021. Events like these have a massive effect on the global financial market, and it is intolerable for customers if the satellite images are not instantly available due to weather. In these cases, more and more satellite solution providers are using SAR data in addition to traditional satellite images, to provide a better service.
According to the market report from Mordor Intelligence, the Global SAR Market was valued at $3,3 billion in 2020, and it is expected to reach $6,5 billion by 2026—representing a compound annual growth rate (CAGR) of 11.6% during the period of 2021–2026.
The 11th Edition of NSR’s Satellite-Based Earth Observation reports that the sale of SAR data and derived products is going to see significant growth in annual global revenues, from $700M in 2018 to over $1.7B by 2028. Imagery sales and information products are predicted to dominate, responsible for 63% of SAR revenues in this timeframe. Very-high-resolution imagery (<0.5m) has become the fastest developing market, while high-resolution (0.5-1m) occupies the biggest part of the current market.
However, not all the SAR satellites are able to follow this wave of growth. According to NSR’s report, medium resolution (1-5m) market share began to decrease after 2017. Low resolution, meanwhile, presents limited commercial value. It seems that the providers of low-resolution SAR data will need to adapt as high-resolution commercial data brings much more value to clients.
Market demand
The largest demand for SAR satellite images comes from the Military and Defense Sector. It’s estimated that the government and military currently constitutes 70% of the market in SAR. It’s no wonder, as there are myriad military applications for SAR, such as detecting surface features like building complexes, missile sites, and topographical features of the surrounding terrain.
The biggest individual buyer of SAR satellite image also comes from the Military and Defense Sector: the National Geospatial-Intelligence Agency (NGA). Until 2019, the NGA had a $10 million contract with MDA for SAR satellite images. The agency renewed that contract in 2019 and now pays four image providers a total of $85 million dollars per year.
Besides the Military and Defense Sector, the Financial and Insurance Sectors are also rapidly growing markets, with a CAGR of 14%. It seems that enterprises in this business area are slowly starting to realize the value of SAR data (e.g., flood monitoring in insurance), but such a market requires many years to reach maturity and shift from traditional methods of doing business.
Traditionally, SAR satellite constellations are based on government programs building large, heavy, and costly satellite units and sensors, offering fairly low revisit rates and requiring significant investment—such as the Sentinel-1 mission. But just like the optical imagery sector, startups such as ICEYE and Capella have challenged the traditional model of building microsatellite constellations. These startups believe that the lack of available SAR satellite imagery is the only reason why SAR applications are not more widely used. As more and more SAR satellite images become available, new applications will be explored—and will prove to deliver high-quality data at a fraction of the price.
The history and development of SAR
SAR is not a new technology; it started in the US nearly 70 years ago. However, the application of SAR has only become popular over the past decade. So, why has the development taken such a long time? And what are the critical acceleration factors?
1951–2000: Limited technology in Defense sector
Radar has a history stretching back nearly 100 years. The traditional application of radar is to display the position and motion of highly reflective objects (such as aircraft or ships) by sending out a radio wave signal and then detecting the direction and delay of the reflected signal.
Imaging radar, meanwhile, attempts to form an image of such an object. The origin of the technology dates back to 1951, when Carl Wiley from Goodyear Aircraft Company had a new idea based on the Doppler effect. He realized that if radar pulses were coherent and consistent, users could process the pulses and create two-dimensional imagery with improved resolution. The more observations, the better spatial resolution of the object. These assumptions were the beginning of SAR technology.
In 1960, the first SAR experiment was successfully completed in Washington, and in 1978, NASA’s Jet Propulsion Laboratory launched the first SAR satellite (SEASAT-1). Until 1990, the research of SAR technology was concentrated in the US.
However, from 1990 to 2000, SAR technology started to come out from the laboratory, and Europe, Canada, Russia, Japan, and many other countries started to build SAR satellites. They were quickly followed by China, South Korea and India, and other countries with developing space industries. However, the high-resolution SAR technology was still limited to the Military and Defense sectors due to its high cost.
1995–2013: Rapid development of technology and the beginning of commercial applications
For years, SAR technology has been limited to military and research domains, but the first country to commercialize SAR satellite imagery was Canada. In 1995, RADARSAT-1 was launched, using a C-band sensor at a single microwave frequency of 5.3 GHz. RADARSAT-1 was Canada’s very first commercial Earth observation satellite. Although the resolution of RADARSAT-1 was far from adequate for most industrial applications, the project marked the beginning of the commercial SAR era.
The first sub-meter radar imagery for commercial applications was launched in 2007. Both TerraSAR-X, launched by Germany, and COSMO-SkyMed, used X-band wavelengths. However, at this point, SAR satellites were still large units. The overall number of satellites was insufficient and the data was very expensive. The price of an image could be three times that of optical satellite images at the same resolution.

2014–: Sentinel-1 providing free images
While the commercialization of SAR satellites developed slowly, a breakthrough occurred in 2014, when the European Space Agency launched the first of its Sentinel-1 satellites, as the first part of the Copernicus satellite constellation. This first mission was composed of a constellation of two C-band satellites, Sentinel-1A and Sentinel-1B (the latter launched in 2016). The ESA and European Commission’s policies make it easy to acquire Sentinel-1’s data and use it for public, scientific, or commercial purposes, for free.
At the same time, the ESA Technology Transfer and Business Incubation Office initiated its ESA Business Incubation Centres (ESA BICs) to turn space-connected business ideas into startups. Over 700 startups have been fostered throughout Europe to date—and more than 180 new startups are taken in by the ESA BICs every year. In addition, various startup competitions and accelerators—such as Copernicus Master and Copernicus Accelerator—also push forward the application of SAR satellite images.
With the policy of free data and support, many SAR startups grew rapidly in this period, especially those using InSAR technology. After five years of development, almost all InSAR companies were using Sentinel-1 images.
Sentinel-1’s freely available 10m imagery, with its 6–12-day revisit, proved quite satisfactory for the existing ecosystem of SAR data users. However, while this helped to grow the downstream application by lowering the barrier to entry, it limited the data sale opportunities and therefore piled tremendous pressure on upstream SAR satellite manufacturers. Medium resolution (1m-5m) satellites are now gradually declining, and low-resolution SAR satellites have already lost their market.
The new era of SAR satellites
Around 2015, the new era of the space sector started to emerge with the development of microsatellite constellations. This was triggered by the reduction in launch costs, significantly lowering the entry barrier for startups. As the launch cost dropped—from several dozen million dollars to about $100k—the satellite startups could refocus the approach to building satellites.
Traditionally, the building costs of large satellites could easily reach hundreds of millions of dollars to ensure component stability. The shift, enabled by Planet’s development of small, compact ‘CubeSats’, welcomed in a new paradigm. Companies began getting space platforms ready for launch faster than ever by using commercial off-the-shelf components. Supported by favorable policies and space agencies, the development of the sector accelerated.
In 2014, ICEYE was founded in Aalto University, Finland, and in 2018, the 70kg ICEYE-X1 was launched as the first satellite under 100 kg to carry a SAR sensor—as well as the first Finnish commercial satellite. After eight years of development, the company became the best small satellite startup in Europe. ICEYE has already launched 16 satellites into orbit, and they plan to launch a further 10 in 2022.
In the US, the SAR startup Capella Space was founded in 2016. In 2018, the company launched their first commercial SAR satellite, Denali, as a test mission, and in 2020, launched the Sequoia satellite. Capella Space has so far put 5 satellites into orbit, and the eventual plan is a 36-satellite constellation with hourly global revisits.
Applications
SAR has been used in a wide range of applications, from studying Antarctic icebergs and detecting changes in habitat, to mapping the effects of natural or human disturbance. The applications are still being explored as the private sector and startups enter the market. ICEYE, for example, is today focusing nearly exclusively on flood monitoring, and attempting to disrupt the global insurance business. Capella Space, meanwhile, concentrates on change detection monitoring, maritime, and disaster response applications.
Here are some use cases of the SAR applications:
1. Emergencies:
-
- On August 5th, 2020, a large explosion occurred in the Port of Beirut, equivalent to 100 tons of TNT. Buildings and warehouses nearby were destroyed. The initial destruction, resumption of activity, and reconstruction of the port are all monitored by SAR-based change detection.
- SAR satellites can also detect flood and wildfire emergencies. When Hurricane Dorian struck the Bahamas in 2019, SAR imagery played an important role in revealing the extent of flooding.
2. Maritime and coastal zone monitoring:
-
- On July 25th, 2020, a ship ran aground south of Mauritius, and spilled at least 1,000 tons of oil into the Indian Ocean. The progress of the leak as well as the rescue operations of firefighting vessels were all recorded by the Sentinel-1 satellite.
- Nowadays, detection of oil spills, shallow water bathymetric mapping, ship detection in coastal regions, forecasting sea state for offshore operations and marine engineering, and marine gravity anomaly mapping for offshore hydrocarbon exploration are some examples of Maritime and Coastal zone Monitoring.
3. Land monitoring:
-
- A ground deformation analysis was conducted for approximately three years (July 2018 to June 2021) in Guatemala City and its suburbs by SAR startupSynspective.
- In the past, the amount of ground deformation was seldom measured, and only when a landslide or other ground disaster occurred would the counterpart agency staff go to the site in response. Thanks to SAR technology, localized subsidence phenomena and areas that show sinkage and landslide risks can be identified by characteristic fluctuation analysis.
4. Agriculture and vegetation:
-
- In Peru, canopy formation, density, and the growth rate of asparagus crops have been monitored by Sentinel-1 satellite since 2019.
- Differences in surface ‘roughness’ are indicative of field boundaries and sizes, as well as helping to detect planting and harvest events. The assessment of crop damage caused by a natural disaster can also be detected.
Key players
There are two groups of key players in the SAR satellite industry: Governments and startups. However, they are playing different games.
Government groups tend to focus on large satellites. Limited by the cost and competitive advantage, none of the startups dare to enter the game of large SAR satellites, and almost all large satellites are manufactured by government or state agencies. As a result, the competition between large SAR satellites is actually a competition between countries.
The United States, the traditional top player in the aerospace industry, had a big advantage in SAR technology—until European players joined the game. To ensure their advantage in the military, the US for a long time declined to share SAR technology with potential rivals. The commercial SAR satellite waves therefore mainly came from Canada and European countries (particularly Germany and Italy). In the last ten years, Japan, Argentina, China, and India have also joined the competition.
Since Sentinel-1B stopped working at the end of 2021, faith in large satellites has also been lost to an extent. Pressure is also coming from the small satellite startups—ICEYE from Finland and Capella Space from the US are becoming the main players in this game. Japan and China also have some startups which have successfully launched small SAR satellites into orbit.
Future trends
Compared to the wide range of uses for optical data, there are still only a few applications of SAR data in the commercial space. Thus, there is still a lot of work to be done to encourage adoption. However, the growth in the number of small SAR satellites is likely to at least be maintained in the next five to ten years, and more startups will be keen to get involved.
For the industry, emergency response offers big opportunities for new startups. Climate change is causing extreme weather events to occur with an increasingly alarming frequency. This trend will only increase over the next 50 years. The safety of infrastructure, including buildings and transportation facilities, will have to be carefully monitored by multiple stakeholders.
At the same time, the international political atmosphere hasn’t been this tense for a long time. It is pushing governments to gather better data and information for decision-making purposes regardless of weather conditions or time of the day. SAR satellite is the only tool that has this ability, so more funding will inevitably be pumped into the SAR industry, accelerating the R&D process.
However, the opportunities for new entrants in the space are decreasing. In-orbit verification, financial support, and customer recognition are the three big challenges for startups. New startups will be obsolete quickly if they cannot verify in-orbit within three years. The high risk involved in the commercial satellite industry has resulted in an extreme Matthew Effect (accumulated advantage) from venture capital. More financial support is most likely to be provided for those startups completing in-orbit verification and building constellations progressively—while the ones that fail to verify in time will just be kicked out of the market.
One of the key barriers in working with SAR data is access to high-resolution commercial datasets as well as for analytics. Recently for the first time, Capella Space data has been made publically available on satellite data marketplace UP42. With easier access, the data analysis methods and algorithms will follow. Today working with SAR data requires significant remote sensing experience and using complex tools. Democratisation of SAR data access will also accelerate the ease of use and will make analytical models more available to the general public.
The key characteristics of the future development of the entire industry are as follows:
- Smaller and lighter: The R&D and investment costs of large and medium-sized satellites are prohibitive for a startup. Therefore, the only opportunities left for startups are small satellites (under 200kg).
- Constellations: Every startup has a plan to build a large satellite constellation. But the one who makes it will be the final winner. Talk is cheap; show me the satellite!
- Easier analysis, simpler processing: Analysis of SAR data requires a lot of time, expertise, and computational tools. Industrial image organizing and processing software was originally developed for the human eye—for optical not radar—leaving SAR lagging behind and more expensive. Making analysis easier and simplifying the processing chain will attract more students and players to the SAR industry.
- From upstream to downstream: Increasingly, satellite manufacturers hope to do more in downstream applications—and vice versa.
Conclusions
“A picture is worth a thousand words”, and it is certainly the case for satellite data. However, sometimes these pictures are worth nothing at all if covered by clouds or captured at night. These limitations pushed scientists to create a need for new types of sensor technologies like Synthetic Aperture Radar. The SAR industry is still in the early stage of development but with increasing demand to better understand our environment and changing planet, space is wide open for more New Space companies to emerge and disrupt the sector with new applications of SAR data.