Revolutionizing disaster response with very high–resolution satellite data tasking

Natural and man-made disasters present a significant challenge to societies globally, necessitating swift and effective responses to minimize losses and facilitate rapid recovery. Given the mounting threat of climate change, coupled with rapid urbanization in many parts of the developing world, the impact of these disasters is expected to become increasingly substantial.
Amid these crises, however, satellite data is emerging as a game-changer, offering near real-time observations and insights that have the potential to revolutionize disaster response operations. Recent advances in optical resolution and satellite tasking mean data from constellations including Pléiades Neo can now provide very-high resolution imagery of a target area within hours of a disaster striking. There has also been a proliferation of satellites equipped with Synthetic Aperture Radar (SAR), which can provide data at night, or when clouds or smoke obscure the area of interest—invaluable in the complex and time-sensitive world of disaster response.
Satellite imagery represents part of a wider integration of geospatial data into disaster response in recent years, but is often the best—and in some cases the only— source of data in the immediate aftermath of a disaster. Recognizing this, a number of national and international mechanisms are now in place to provide actionable data where and when it is needed most.
The Cycle of Disaster Management
Satellite data has the potential to make a crucial difference at every stage of disaster preparedness, response, and management.
Pre-Disaster Phase
First, satellite imagery is an invaluable tool for risk assessment and preparedness before a disaster strikes.
By providing detailed data on natural hazards, land-use patterns, topographical features, and vulnerabilities in infrastructure, satellites can lay the groundwork for accurate and effective risk assessment—ideally, predicting and in some cases even preventing disasters before they happen. Detailed spatial information also empowers authorities to develop appropriate disaster response strategies, which might include designing evacuation routes, ensuring emergency access, and designing public awareness campaigns tailored to the local context.
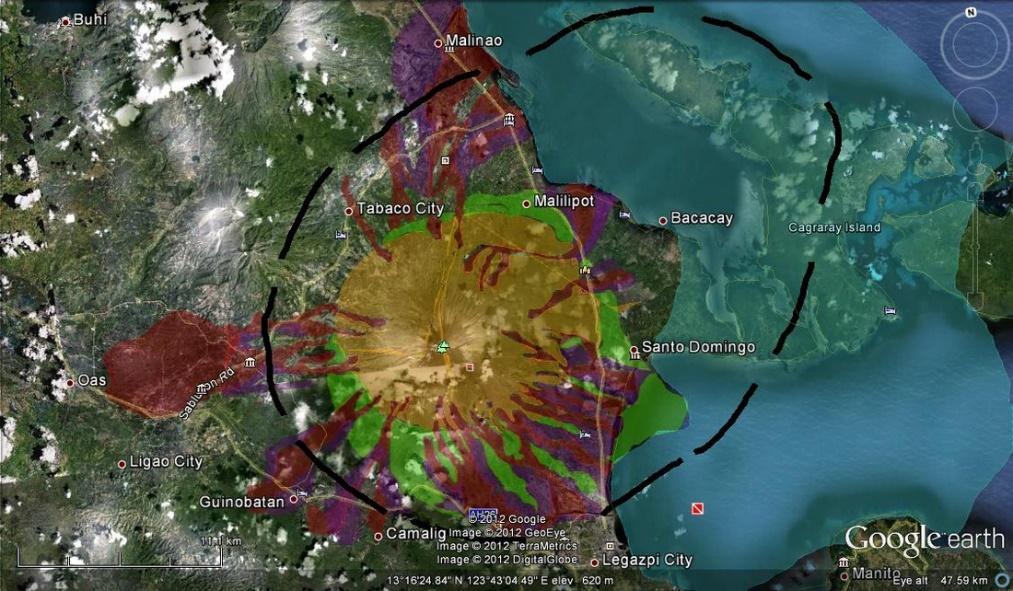
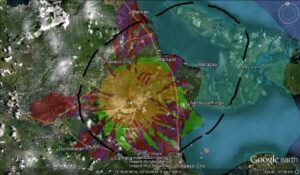
One of the key applications here is in the creation of ‘hazard maps’, which show the predicted range of damage from a potential hazard, such as landslides or lahars (mudflows). In the Philippines, a region prone to these, this has proved especially useful. Satellite data is also often used to calculate the chance of flooding, and can be used to provide flood vulnerability maps in at-risk areas.
Furthermore, satellites can contribute to the operation of early warning systems for disasters like hurricanes, floods, wildfires, and more. By continuously monitoring variables including weather patterns, sea surface temperatures and vegetation dryness, satellite data and analytics can help to provide critical forecasts and advance notice of imminent hazards.
For instance, authorities in California have utilized satellite data to prioritize prevention measures in preparation for the wildfire season. NASA’s Ecosystem Spaceborne Thermal Radiometer Experiment on Space Station (ECOSTRESS) provides high-resolution temperature profiles and information on plant stress, which can identify areas most at risk. This allows for preventive measures, such as controlled burns, and public awareness campaigns in vulnerable areas.
Disaster Event Phase
During the disaster event itself, satellite data enables real-time monitoring and assessment of dangers and damage.
Satellites are used to track the course of hurricanes, with increasingly sophisticated weather prediction algorithms helping to forecast their landfall as much as a week in advance. This can enable authorities to initiate evacuations, and position resources effectively, and thereby save countless lives. Multiple constellations tracked Hurricane Laura in 2020, with imagery used to support to support homeland security and emergency response. Satellites also played a crucial role in 2017 during Hurricane Harvey, when the National Oceanic and Atmospheric Administration (NOAA) used GOES-16 data to track the storm’s progression and intensity in real-time.
Some disasters, like earthquakes and volcanic eruptions, are much harder to predict with any accuracy, but rapid and effective response during the aftermath is essential to minimize loss of life and damage to property—especially in situations where follow-up events like aftershocks and landslides are likely. If authorities are able to accurately follow the progression of a crisis, they can provide targeted alerts to at-risk communities, guide immediate response efforts to increase rescue success and reduce risk to the rescue teams themselves.
This use case was on display fairly recently, when the European Space Agency’s (ESA) Copernicus Sentinel satellites were used to monitor the La Palma volcanic eruption of 2021, providing crucial real-time information about the flow of lava, the dispersion of ash, and topographical changes. This information enabled local authorities to direct evacuations and disaster response more efficiently, reducing risk to humans and property.
Satellites also support damage assessment efforts, both during and in the immediate aftermath of the disaster. They can assist in determining the location and scale of damage; a vital data tool for dispatching emergency response resources to where they’re most needed—especially where resources are limited.
In the aftermath of the devastating 2010 earthquake in Haiti, satellite imagery was used in damage assessment and recovery planning, with RapidEye satellite constellation, providing before and after images of affected areas, which were used to determine the extent of the devastation and prioritize relief efforts. In 2010 it took a week for RapidEye to provide the data. A decade later, when disaster struck again on August 14 2021, images of the affected areas were available the following day from Airbus’s Pléiades constellation with accuracy that enabled analysis down to the level of individual buildings—a striking demonstration of the rate at which the technology has improved.
Post-Disaster Phase
Finally, satellite data can prove a vital tool in damage assessment, recovery, and reconstruction, after the immediate event phase is over.
High-resolution imagery provides a comprehensive overview of the full extent and type of damage caused by the disaster, essential in facilitating efficient recovery efforts. Comparison of pre- and post-disaster satellite images is one of the most important tools in this process, as it allows authorities to prioritize areas for recovery and plan the reconstruction process, ensuring the new infrastructure is safer and more resilient.
One example of this relates to the devastating explosion which ripped through the port area of Beirut, Lebanon, in 2020. High-resolution satellite imagery from Pléiades captured 14 hours after the disaster as part of the European Emergency Response Coordination Centre Rapid Mapping service, played an immediate role in disaster response, and continues to play a part in reconstruction.
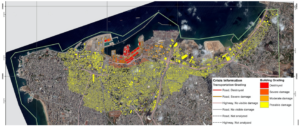
Source: Copernicus Emergency Management Service (CEMS)
Over the longer term, satellite data aids in monitoring the long-term impacts of disasters on landscapes, ecosystems, and human settlements, which can contribute to a sustainable recovery process as well as helping to ensure that communities are better armed against future crises.
Collaboration is Key
Many disasters occur in the developing world, where authorities have historically had limited access to satellites and satellite data. However, understanding the invaluable role of satellite data in disaster response, international space agencies such as NASA, the European Space Agency (ESA), and others, joined forces to establish the International Charter Space and Major Disasters. This charter fosters a unified system for the acquisition and application of space data during major crises, ensuring that mission critical information is readily available to all disaster response teams.
The Charter has proved to be a powerful tool on multiple occasions. In 2019, it swung into action to support relief efforts following the landfall of Cyclone Idai in Mozambique, with satellites used to map flood waters and authorities harnessing the information to help lead relief response. More recently, in the aftermath of the devastating Turkish earthquake in February 2023, the Charter helped to deliver more than 350 crisis images from 17 space agencies across the world. These were used to generate maps of the damage and the situation on the ground, enabling rescuers to estimate levels of risk as well as coordinate relief efforts in affected areas.
The charter has even been used for epidemiological purposes, helping to chart existing medical facilities and plan future ones following the Ebola outbreak of 2014! All these examples demonstrate the many ways in which local governments can benefit from utilizing satellite data to coordinate disaster response efforts more effectively.
The future: integrations of satellite data and other technology to improve relief efforts
Satellite data is emerging as a cornerstone of disaster management, improving our understanding of how, why, and where disasters occur, facilitating planning and preparation, helping to steer the emergency response, and aiding recovery and reconstruction. In times of disaster, immediate readability of satellite imagery is paramount, which is why constellations such as Pleiades Neo, which provide the highest resolution data, are of such significance when it comes to disaster response.
Of course, there are challenges to overcome. Satellite data itself is of little use unless it is analyzed and actioned by trained individuals following effective processes. Misinterpretation of the data could cause potentially catastrophic decisions to be made, while data overload could cause delay at a time when rapid response is crucial.
It’s also important to remember that satellite data on its own is not sufficient; its value is maximized when it’s integrated into a broader framework of geospatial and other data tools. For instance, where there is a need to assess a structure’s risk of collapse, or gain accurate information on people trapped beneath rubble, UAVs are often the best source of data.
Looking to the future, the evolution of machine learning and artificial intelligence promises to further amplify the potential of satellite imagery analysis. These technologies could accelerate response times and enhance the overall efficacy of relief efforts, leveraging the vast quantities of data with far greater efficiency than a human analyst.
The World Meteorological Organization (WMO) estimates that natural disasters have increased fivefold over the last 50 years, as a direct result of climate change. This is a trend that is only going to continue. However, as the satellite sector continues to innovate, and the global community increasingly recognises the significance of geospatial data in disaster response, the world is better prepared than ever to meet the challenge.
Did you like this article? Sign up to our newsletter!

#Environment


Next article


Who knew there were 215 geospatial companies in the world!
A 1 year update on activities.
Podcast stats
- 16 podcast episodes (1 was disallowed by the company – no harm done, it was the second with them), so 15 company interviews published.
- Viewership is… terrible, subs (most popular ep):
- Youtube: 52 (An Ordnance Survey of Artificial Intelligence)
- Substack: 46 (Mobeen Hanid)
- Spotify: 15 (Synmax)
- Apple podcasts: 12 (Umbra)
- Google podcasts: 0 (Bettermaps.ai)
- Amazon Music: 0 (no one listened to anything!)
Related is social media. I quit X because of Andrew Tait – perhaps a bit over the top but really it’s not a good look. I went across to Threads and am at nearly 30 followers. This is an order of magnitude less than what I accumulated on X. But hey. I should say I also secured a coveted Bluesky account, but that’s an even less active platform.
The Geospatial Index
- Number of companies: 215 (Watchlist)
- Sectors: 14
- Industries: 40
- Currencies: 20 (fewer than countries due to the Euro)
- Exchanges: 31
- Countries: 23 (looking through tax havens)
- Subindexes: 21
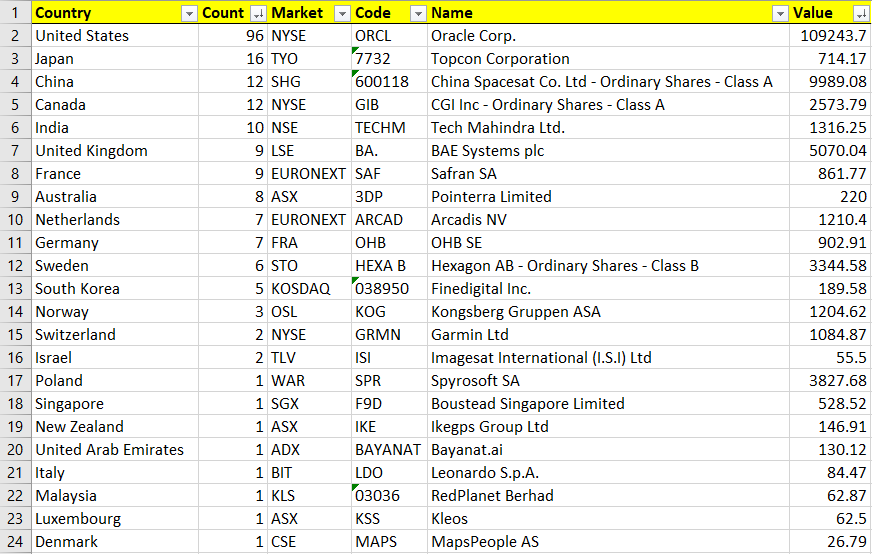
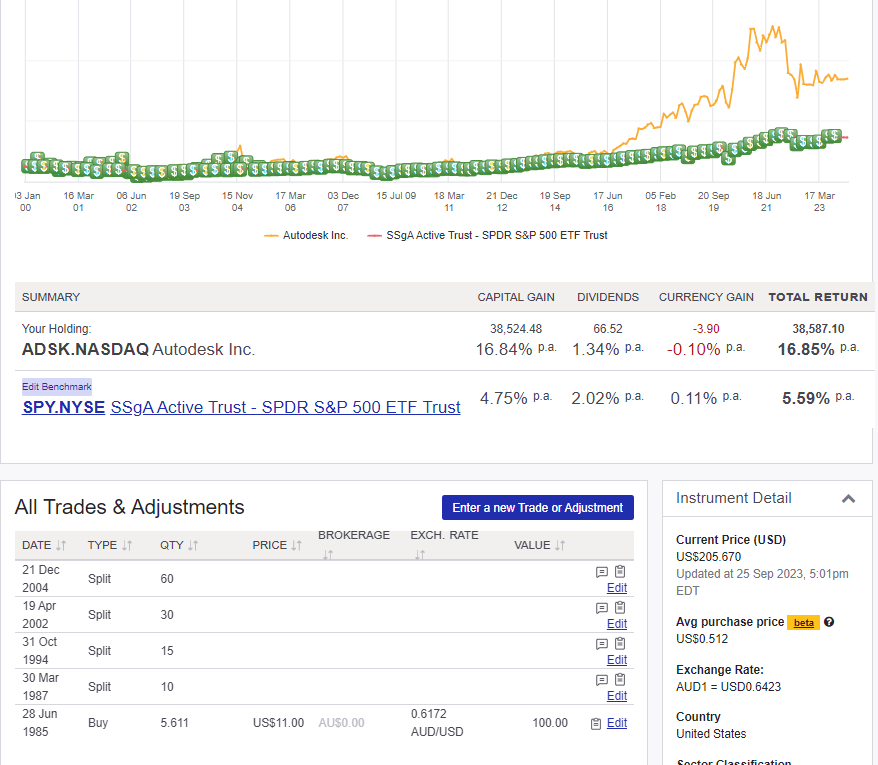
I’ve been playing with the reports from Sharesight and managed to massage the below table out of Excel. It shows the top five countries by count of geospatial (and related) public companies is the US, Japan, China, Canada then India. The table also contains the most successful geospatial investment from each company (market, stock code, name and value are listed). Value is how much an $AUD100 investment has grown since the company first entered the index. The upshot? Oracle. Listed in 1986, has been the most successful investment the geospatial industry has had to offer thus far.
This is because it has compounded at 21% annually since listing in 1986:

The IPO was outside of Sharesight price history so I obtained IPO price here, and stock split history here. Oracle spatial was first developed in release 4. This was released 2 years before IPO in 1984, so we have captured their entire advance.
Now, I hear some of you complaining that Oracle isn’t a REAL geospatial company. And you’re right! It happens to be the most badass spatial database out there, but I get that this is just a small part of their overall business. Really they’re about vast enterprise database systems for whole regional councils with millions of people, or global organisations employing hundreds of thousands.
So what else can we consider? Well, looking at the list China stands out with China Spacesat. This has grown at 20% since 1997. They are a REAL geospatial company as, amongst the satellites they fly, there are ones doing earth observation and positioning, navigation and timing (PNT). But you can see that this has ‘only’ accumulated just shy of 10k from its original $AUD100 investment. So you must be wondering, amongst all the companies, what is the REAL geospatial company that’s done the best?
Well, we’re back to the US again with Autodesk. From its original $AUD100 investment in 1985 it has compounded to $38,621… This is because, as stated in the episode, every engineering, construction and architecture firm has their software installed. In my view it is TERRIBLE, buggy, unstable, lumbering software that is confusing to use and encourages bad habits around drawings as opposed to generating genuine spatial data… but the truth is they have nailed the industry.
So, I think that’s a fair estimate of things really. America is the best economy with the brightest minds, it stands to reason the most successful geospatial companies come from there. But of course, that says nothing about the future. So it’s great to see China making its way into the mix and this index helps us begin to sift through the opportunities. I’m really excited!
Growth
So, looking at the performance of the index (active and sold positions) over the past decade it is presently at 15.68% over the 200+ companies. Importantly, the S&P 500 index (‘the market’) has basically kept up: 15.32%… So let’s be honest, it is not worth the effort. I could just buy the market, spend no time whatsoever and I’d make just as much money. But, there’s more.
Subindex growth
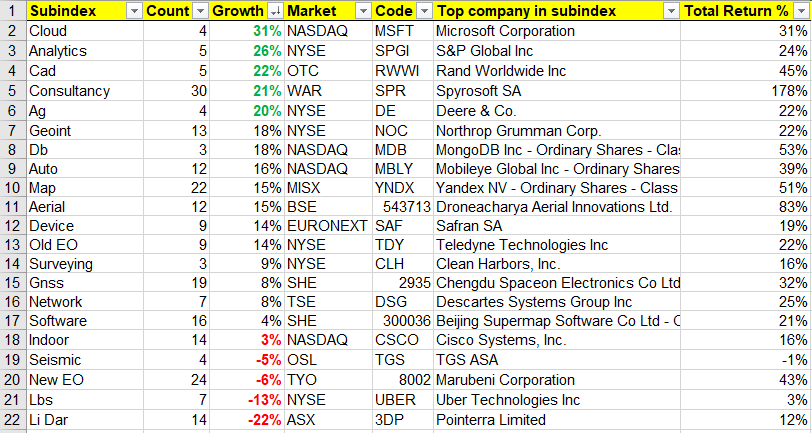
Once again, bear in mind that over the same period since 24 September 2013 the market has grown at 15.32%, invalidating the whole effort for the Geospatial Index. This illustrates the utility of the subindices – one can see which outperform the market! We have 5 that outperform the market by 5% – a HUGE margin!
Base Rates
We can go one step further – recall I mentioned survivorship bias above. I cannot trust the index I’ve assembled prior to 2013 or so. Well, let’s look at the past century of performance of the US market, 10.5%:

So, for the decade of this study, the market has performed at 50% above the historical rate (15 instead of 10%). One may suspect that the same effect applies to The Geospatial Index, so the long term expected growth is also 10%. Dividing the growth rate of the top 5 subindices by 1.5 to find what it might be in regular conditions:

These are still incredibly good growth rates. Yes, the sample sizes of the top 5 are small except for consultancies. If you set the threshold at 10 components per subindex, you’re looking at a top five of 10-14% annual growth in regular economic times.
Conclusion
It is now up 82%.
THE GEOSPATIAL INDEX
This channel, Threads account, newsletter, watchlist and podcast express the view that you are serious about geospatial if you take the view of an investor, venture capitalist or entrepreneur.
You are expected to do your own research. This is not a replacement for that. This is not investment advice. Consider it entertainment.
Bluesky: https://bsky.app/profile/geospatialindex.bsky.social
Threads: https://www.threads.net/@geospatialindex
Watchlist: https://www.tradingview.com/watchlists/123255821/
Meetup: https://www.meetup.com/london-mapup/
Newsletter: https://www.geospatial.money/
Podcast: https://open.spotify.com/show/5gpQUsaWxEBpYCnypEdHFC