
LiDAR technology, with its precision and versatility, has become a critical tool in environment monitoring, particularly for tracking and analyzing landslides. This technology offers a way to capture detailed three-dimensional data of the Earth’s surface, making it an invaluable asset in understanding and mitigating the risks associated with landslides.
How to acquire LiDAR datasets?
A rich in data resources for those looking to utilize LiDAR data is Open Topography, an open-source platform that hosts a wealth of datasets ready for download and processing. This platform exemplifies the growing trend towards accessible, high-quality environmental data, empowering researchers and professionals to conduct in-depth analyses with global reach.
Open Topography stands out not only as a repository for LiDAR datasets but also for its integrated tools that allow users to process and analyze LiDAR data directly on the platform. One of the most valuable features is the Differencing processing tool, enabling users to easily compare different LiDAR datasets over the same area. This functionality is particularly useful for monitoring changes in the landscape, such as erosion, vegetation growth, or, notably, landslide movements.
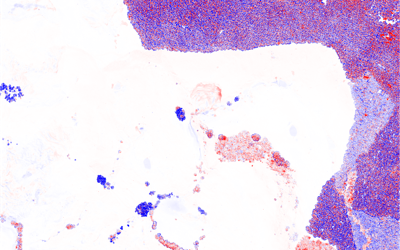
Results of Differencing Job in Open Topography service
Landslides in New Zeland
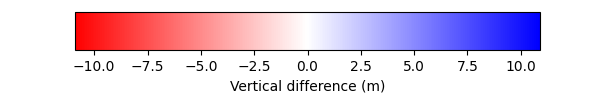
New Zealand, with its dynamic landscape, frequently experiences landslides that can cause significant disruption and damage to infrastructure, such as main roads. One notable instance occurred near the city of Gisborne, where a landslide had a profound impact on the local community and infrastructure. GNS Science, a geoscience research institution in New Zealand, offers a service through its database on landslides within the country. This database is an essential resource for understanding the frequency, distribution, and characteristics of landslides across New Zealand’s diverse landscapes. By providing detailed information on past and present landslide events.
Landslides Map. Source: GNS Science
Case-study: landslide monitoring in Gisborne
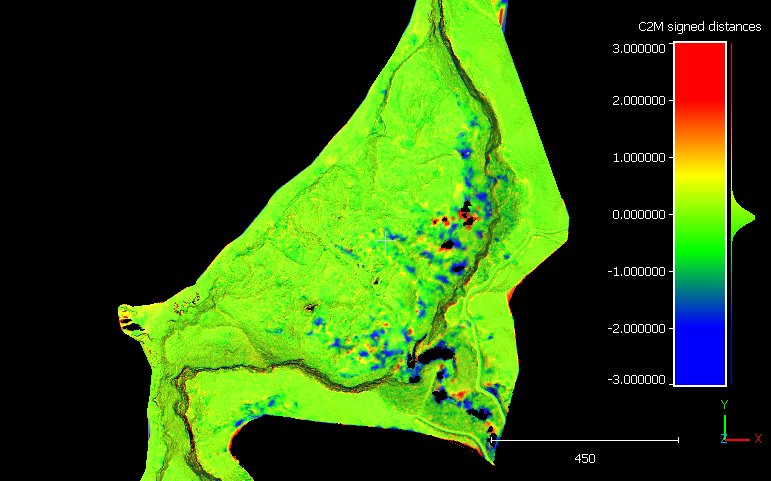
In this case study, LiDAR data’s classification feature proved invaluable, allowing for the separation of ground points and a detailed analysis of the terrain changes over time. To receive a visualization of significant changes on the slope there were applied two algorithms in Cloud Compare software. The first one was connected with calculating the distance between two pointclouds from two periods of time: 2019 and 2023. Second method was employing the M3C2 algorithm. Both methods were able to generate a map highlighting significant changes in the landscape, offering critical insights into landslide dynamics. What is important about the M3C2 algorithm is the fact that it’s possible to receive information about distance uncertainty. In Gisborne case study accuracy of the resulting ground movement was up to 40 cm.
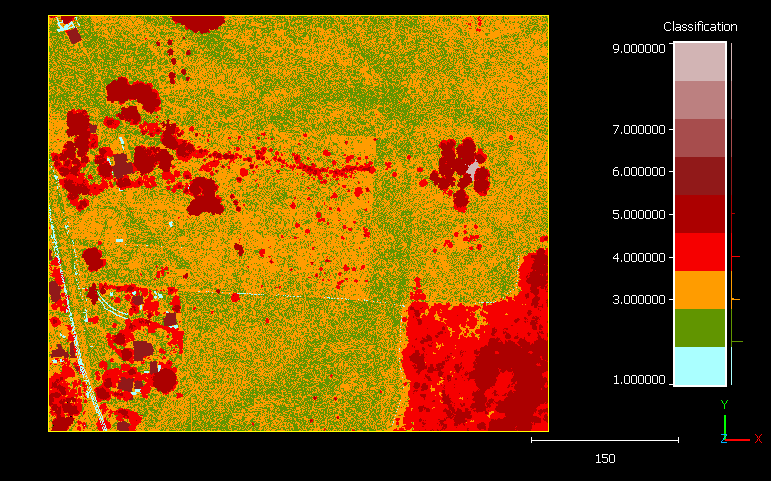
Case-study. Classification map
Case-study. Algorithms comparison
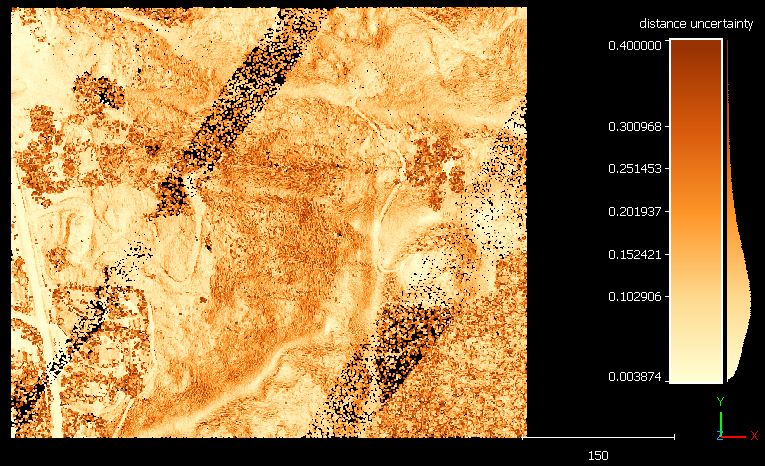
Case-study. Distance uncertainty
Landslide Monitoring on the West Coast of New Zealand: A Case Study at Te Toto Gorge
Another example of LiDAR’s application in cliffs monitoring is found in the Te Toto Gorge walking trail near Raglan, New Zealand. Here, LiDAR point clouds were converted into a mesh, and by computing mesh-to-mesh distances, it was possible to detect subtle shifts at the edges of cliffs. This approach provided a nuanced understanding of the cliff’s behavior in the period of time: 2015 and 2021. For instance, which edges are more unstable or where accumulation of rock layers takes place.
Case-study. Mesh to mesh distances – top view
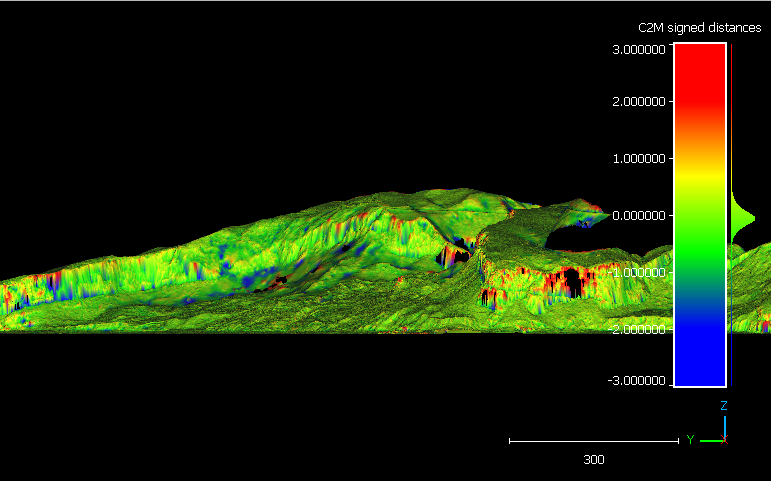
Case-study. Mesh to mesh distances – front view
In conclusion
The case studies from New Zealand underscore the profound impact of landslides on communities and the environment. They also highlight the effectiveness of LiDAR technology in monitoring these events. The ability to classify points and analyze changes between different datasets allows for a detailed understanding of landslide progression and potential risk areas.
Moreover, these examples emphasize the importance of cyclic measurements. Regular, systematic data collection is essential for maintaining up-to-date and accurate models of the Earth’s surface, enabling timely responses to landslide risks. As the accessibility of LiDAR data continues to improve, with resources like Open Topography, the potential for proactive environmental monitoring and disaster mitigation grows, offering hope for more resilient communities and landscapes.
Did you like the article? Read more and subscribe to our monthly newsletter!

#Environment

Next article
In recent days the news is full of information about disasters occuring on our globe. Scientists are wondering how to reduce the impact of such events, coming up with disaster management. However, to create a disaster plan some 3D data is required. Unfortunately, possible solutions for 3D reconstruction have their faults. The lidar method may be too expensive, whereas satellite optical data struggles with cloud cover issues. Satellite radar data instead may be a good alternative for other techniques, especially when it’s combined with AI tools. Thanks to this unique combination outstanding products can be designed, for example 3D City Maps.
Presenting SAR2Height
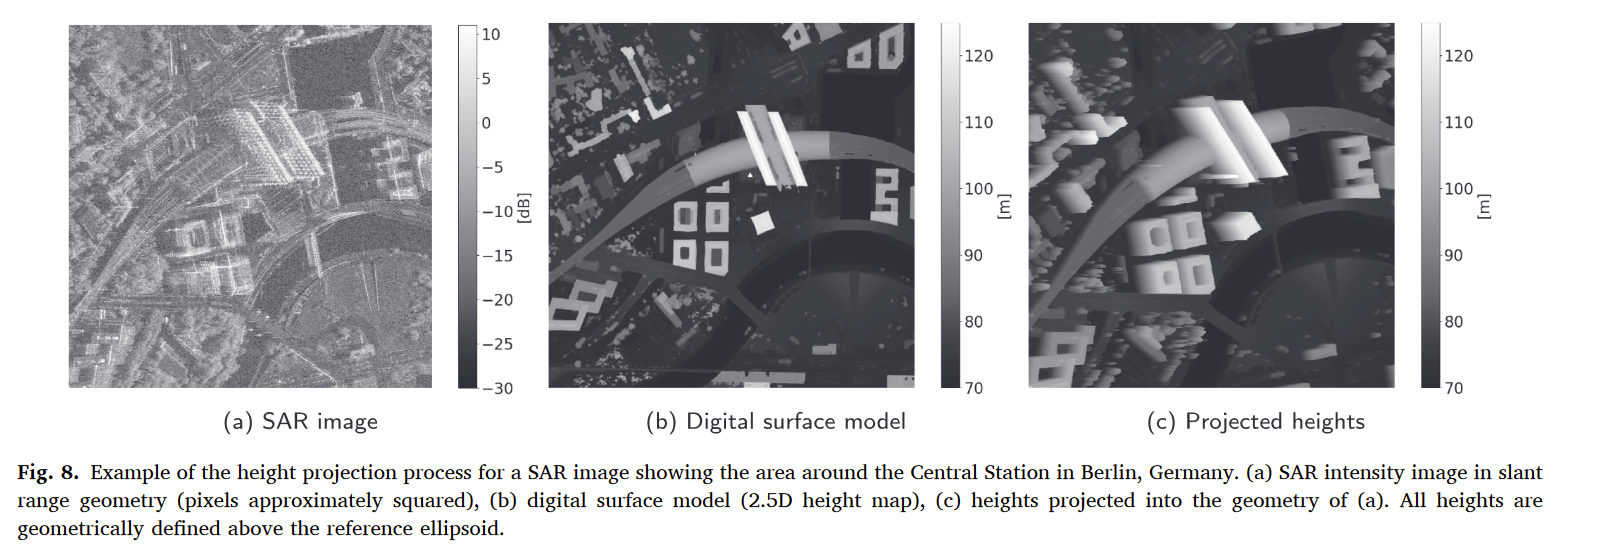
A true revolution was developed by Aerospace engineers at the University of the Bundeswehr Munich, combining radar data and AI. Professor Michael Schmitt and Michael Reclastarted acquired SAR images from German TerraSAR-X and high resolution height maps, based on airborne laser scanning, to carry out a training of deep neural network.
As Schmitt says: “The results were amazing. We trained our model purely on TerraSAR-X imagery, but out of the box it works quite well on imagery from other commercial satellites.” What about the accuracy? This model is able to predict the height component of the building with an accuracy of several meters.
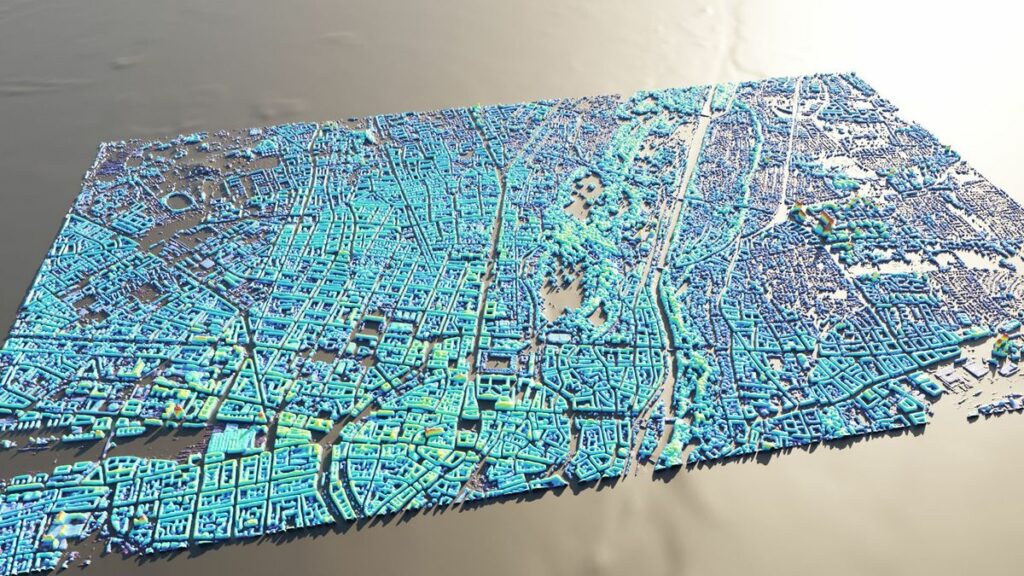
The image below shows a difference between the 2D radar image and 2.5D Digital Surface Model with 0.5m resolution. Combined together, they show a 3D visualization of the city, which looks truly impressive.
From radar image to 3D vizualization. Source: Research Gate
AI solution taming earthquakes
The SAR2Height model is hoped to be a tool for predicting building damages, particularly in case of an earthquake. The vivid example, how useful SAR2Height can be at the present time, is the recent earthquake at an extremely short distance from New York City on 5th of April 2024. It’s a matter of time before we probably see a 3D visualization of the NY’s earthquake aftermath.
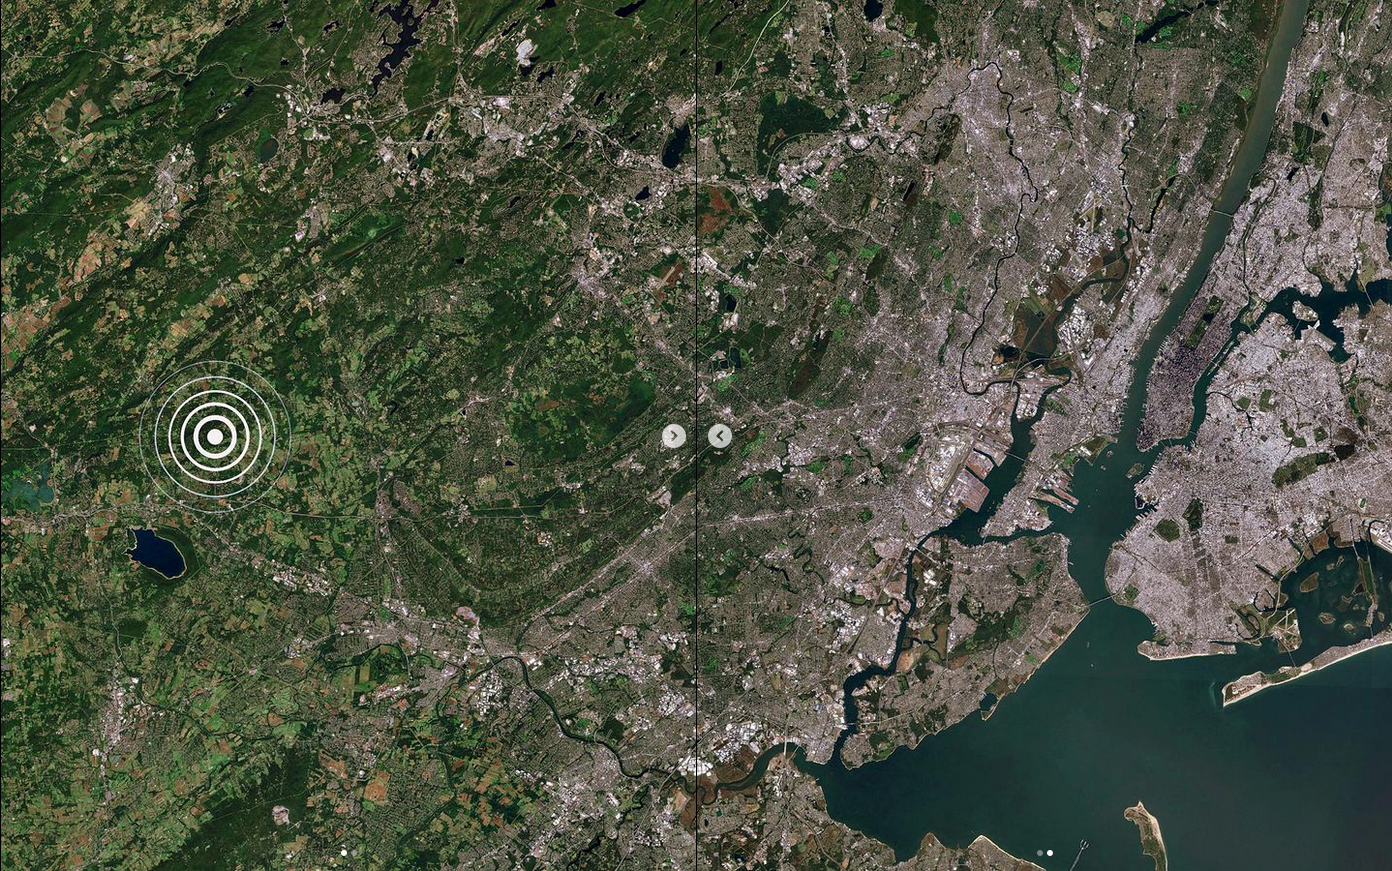
Earthquake near New York City, 05.04.2024. Source: Daily Overview
In a chase of perfection
This solution, however, is not without drawbacks. There are some issues like Radar Image Distortions. One of them is a radar layover. It’s a situation where a radar signal reaches high objects. Difference between return signals from the top point (B) and the bottom point (A) causes a deformation of the final result and 3D relations.
Radar layover. Source: Natural Resources Canada
Additionally, at the moment not every European or North American city possesses periodic lidar datasets needed for neural network training. It is often said that governments flying missions have too slow revisit cycles and it’s regrettable that projects like SAR2Height are not supported.
SAR2Height is constantly learning. As Mr. Schmitt highlights, his method is not as accurate as classical methods, but still, it’s better than nothing. Especially when it comes to developing an urgent plan for disaster response.
In conclusion, this research opens new possibilities for topographic reconstruction and enhances the potential for remote sensing applications that require rapid, weather-independent observations. The approach benefits established radar techniques by offering an understanding of terrain, which is valuable for SAR data tasks like phase unwrapping or cross-modal image registration.
Source: Research Gate