
One of the main applications of satellite imagery is land cover classification. Thanks to the high frequency of satellites passing over the earth’s surface, it’s possible to monitor land use in real time. What are land classification maps used for? Land classification maps are useful for a variety of purposes across different fields such as agriculture, urban planning, environmental management, and more. Land Cover Classification can be performed using optical and radar imagery. Both of these source datasets have their pros and cons. However, as resources become more available, comparisons between these two satellite products can be presented.
How does land classification work?
A land use class connected with satellite classification refers to a categorization of the Earth’s surface based on the types of human activities and natural features observed from satellite imagery. This classification system organizes land use into distinct categories, such as residential areas, agricultural land, forests, water bodies, and urban infrastructure, enabling the analysis of spatial patterns and changes over time using satellite data. Each land use class seen by a satellite has different characteristics. Specific features relevant to the type of land classification are selected based on the spectral properties of different land cover types. For example, vegetation can be distinguished from water bodies based on their different responses in the infrared part of the spectrum. This all means that the rebound intensity of a given object is important to determine land class. These parameters affect the values encoded in individual bands. For optical satellite imagery, sample bands are Red, Green, Blue, or Near Red. Considering radar satellite imagery there are bands connected with intensity value – the amount of energy that returns after reflection from the ground surface.
While processing satellite images we can use two methods to classify land use: supervised and unsupervised Classification. In supervised classification, users select training samples representing specific classes and guide the classification based on these samples. This technique requires labeled training data for each class and user intervention to define classes. It often results in higher accuracy but it can be time-consuming. Whereas unsupervised classification is an automatic tool that groups pixels based on spectral similarities without predefined training data to receive a specific amount of classes. The user only decides how many classes they receive in the final result. It uses clustering algorithms to identify classes without user input, making it more flexible and great for exploratory data analysis. It may have lower accuracy but it is effective for identifying unexpected patterns.
Both methods have their pros and cons. Supervised classification is more precise and there is some control over provided data, but the whole process may take a long time to obtain the best results. If you’re in a hurry, an automatic solution may be a better option.
CORINE Land Cover – CLC
The CORINE (Coordination of Information on the Environment) Land Cover project is an initiative by the European Environment Agency that provides detailed and consistent information on land cover across Europe.
The project classifies the European landscape into 44 different land cover classes such as agricultural areas, forests, wetlands, and urban regions, based on the analysis of satellite images. This classification aids in monitoring changes in land use over time, contributing to environmental policy, planning, and conservation efforts. It provides detailed information on land use patterns and changes over time, with data available for multiple reference years such as 1990, 2000, 2006, 2012, and 2018. The CLC database is a collaborative effort and is accessible to download for free – an excellent tool if you may need it!
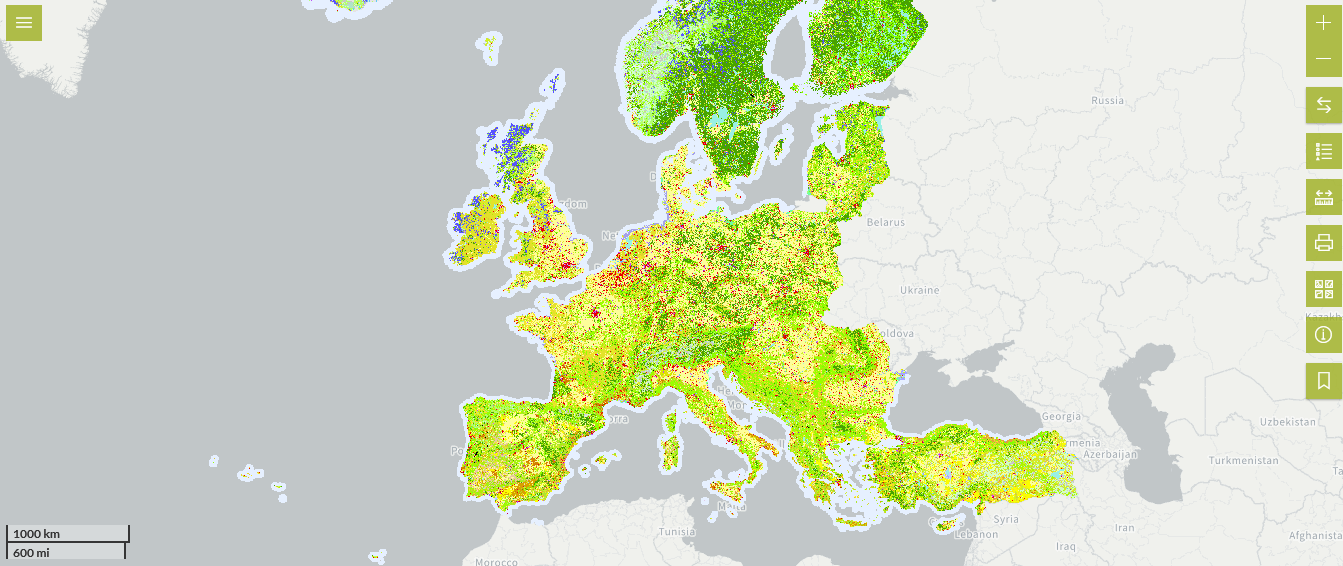
CORINE Land Cover – Looking at the EU
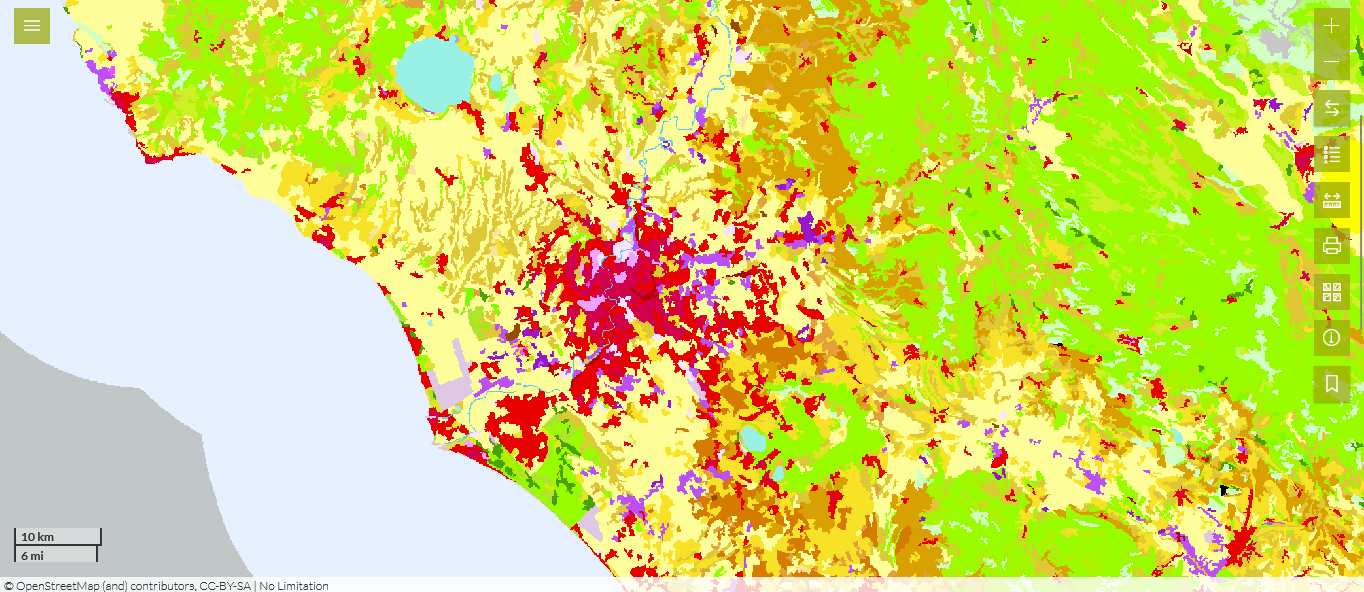
The City of Rome in the CORINE Land Cover browser
Optical data: Classification in QGIS – looking at Poland and Germany
QGIS open software is one of the most common tools to process raster or vector data. It’s also possible to install a variety of plugins, which may help implement complicated algorithms.
For land cover classification using Sentinel datasets, the best plugin is Semi-Automatic Classification Plugin (SCP). Once we gain Sentinel’s set of images, we can start processing. The person processing decides how many classes they want to obtain and then marks training fields – representations of a given class on the raster. Then they choose the algorithm i.e. Maximum Likelihood or Minimum Distance. The Maximum Likelihood Classification algorithm calculates the probability of each pixel belonging to different classes and assigns it to the class with the highest probability, hence maximizing the likelihood of the observed data given the class. Whereas the Minimum Distance algorithm computes the distance between the spectral values of each pixel and the mean spectral values of each class. The pixel is then assigned to the class with the shortest distance, hence the name “Minimum Distance.”
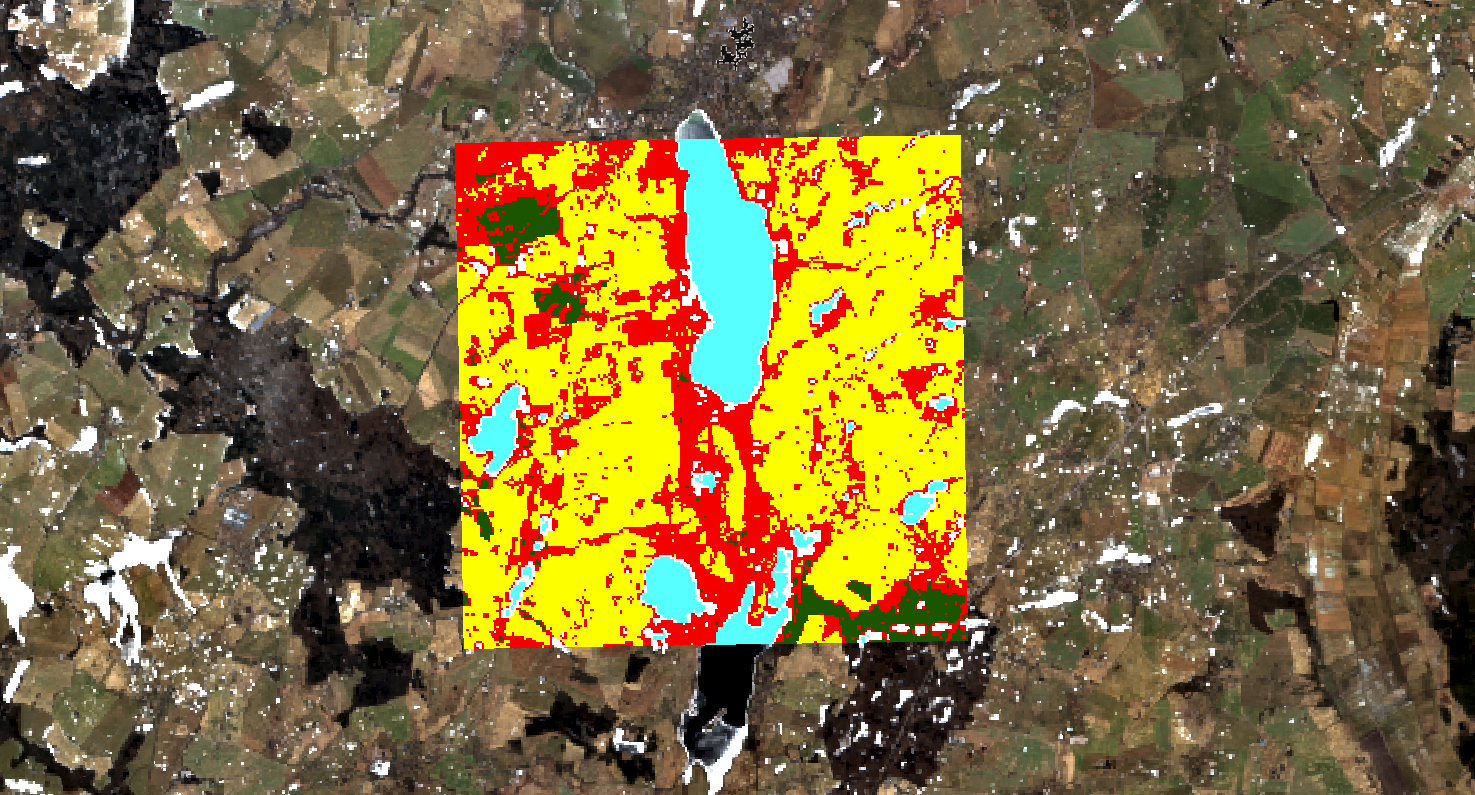
In this case study, let’s look at the historical region of Euroregion Pomerania. Divided between Poland and Germany, it has a rich history dating back thousands of years and it’s known for its diverse landscapes, including flat terrain, small rivers, and numerous lakes.
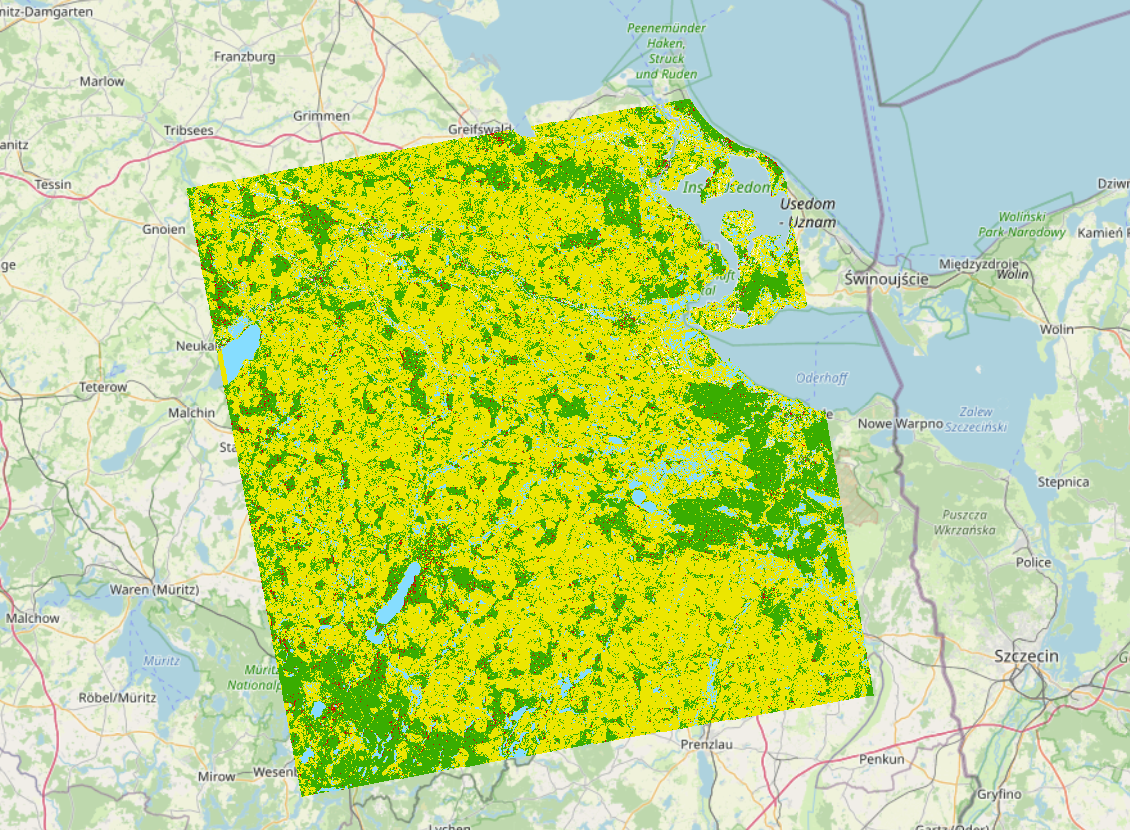
The main goal of studying this area through processing is to classify the land use with 5 macro-classes: Water, Forests, Fields, Build-up, and Snow. Due to the fact that the Sentinel image was created on 21 February 2018, there is some snow coverage across the fields. The main disadvantage of optical data, compared to radar data, is the fact that it can’t skip cloud coverage. That’s why, when looking for source images there must be a condition of maximum cloud coverage. In this case study, maximum cloud coverage was set to 30%.
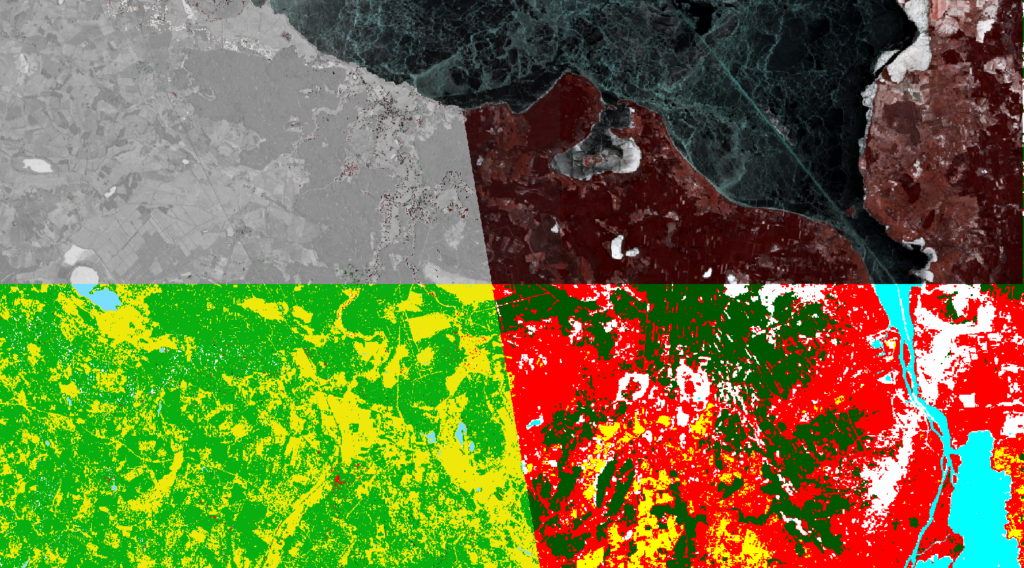
After marking a couple of training fields and assigning appropriate colors, we may check our results and optionally change our training input. Once the result preview is good enough, it’s time to classify the whole image. This plugin allows user to manipulate the data, changing some parameters, algorithms or visual effects. For instance it’s possible to select 3 different bands for band combinations. RGB – the most common form – consists of the Red, Green and Blue bands.
When looking at these bands separately, the images are in grayscale, but combining these three, results in the colourful image as our eyes can see. Very useful is the combination of the bands: Near-Infrared, Red, and Green. This allows the detection of vegetation, highlighting it in red.
Result preview
Sentinel-2A image. Before and after classification
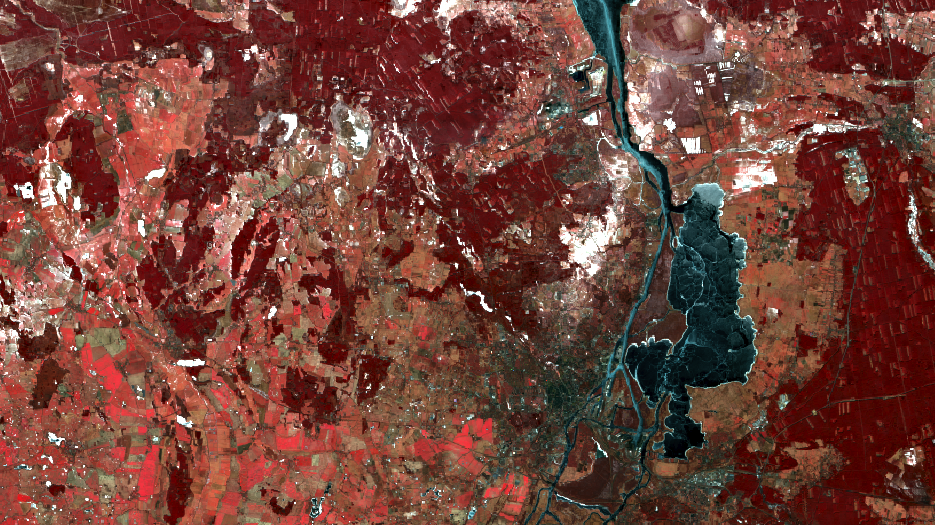
Band combination (NIR+Red+Green)
Radar data: Land Cover Classification in SNAP using SAR data
Let’s look at the historical region of Pomeria again, but this time by processing radar satellite images.
Software which can deal with the classification issue is Sentinel Application Programme (SNAP). This time, the processor has radar images at its disposal. These kinds of images differ significantly from optical images. Knowing the fact that the values of the intensity parameter depend on the terrain class, such a land use classification can be performed. The European Space Agency published a few insightful tutorials for those who are passionate about satellite technology.
Instead of colourful band combinations, when using radar, the source file is a grayscale map. But what does it represent? The value of intensity. This tells us how much of the origin signal power returns to the satellite aperture. Values close to zero mean that the earth’s surface absorbs the wave sent by the satellite, which usually happens with water zones.
SNAP allows the processing of satellite data using the unsupervised classification algorithm. The result may not be ideal, but still, after the process, the user can perform supervised classification and determine the classes by recalling the values of intensity in each class. In this case-study there are defined 4 classes: Water, Forest, Agriculture and Buildings. The final result is slightly better than the image from unsupervised classification.
Radar image. Before and after unsupervised classification
Radar image. After supervised classification
Summary
As satellite technology continuously improves, we can receive more and more data from space, with better quality, higher accuracy and many sampling periods.
This allows us to monitor the earth’s surface better than ever before. The application of satellite imagery may be useful in the forestry industry – detecting the rates of deforestation or urban planning – detecting expansion of cities. Is it possible to decide which data type gives better results – optical or radar? The answer may not be straightforward. The resolution of optical images is increased compared to radar images, which may result in more precise land use classification. However, the advantage of radar imagery is that it avoids the problem of cloud coverage and that measurements can be performed regardless of day or night. It may be a good idea to run both data sets in parallel and compare the final results.

#Satellites

Next article
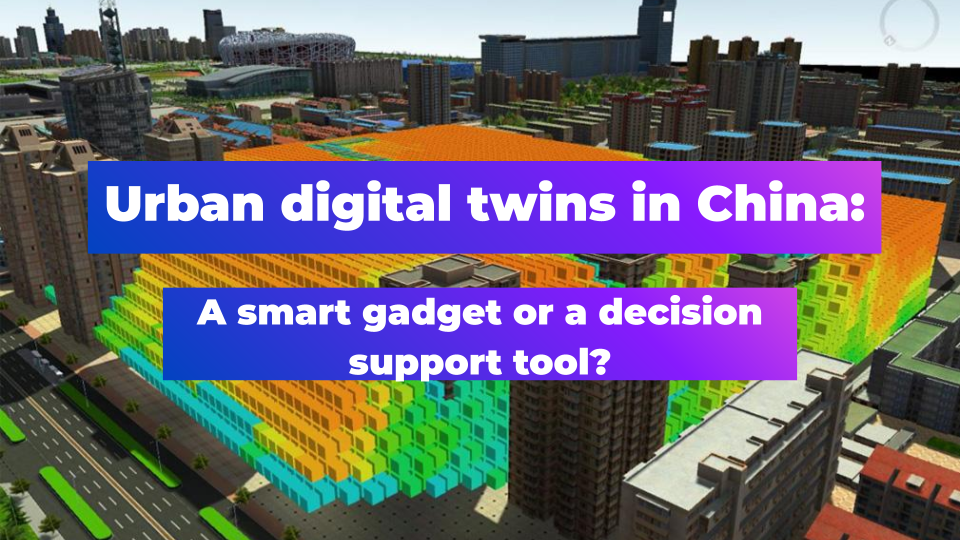

In recent years, digital twins cities have rapidly emerged in China. As a policy-driven market, the Chinese government has been promoting the Digital China strategy over the past few years. A significant portion of the budget has been allocated to realistic 3D urban scenes and smart city initiatives. This has helped the industry grow quickly.
Within the industry, various geospatial enterprises were the first group to enjoy the benefits. However, the largest share of the market didn’t go to the geospatial companies. Instead, it was the companies that originated from the gaming engine.
Rendering realities: The game engine transforming urban digital twins
A crucial point of difference among all players was their choice and customization of rendering engines. There are two main types of 3D rendering cores in China: client-side rendering based on the web-based approach and stream rendering with WebRTC based on the game engines.
GIS Engine: Precise but not smart enough
Initially, geospatial companies were the first to enter the smart city market. And most of them chose the web-based approach. The web-based approach allows digital twin applications to be accessed without additional desktop software. It facilitates cross-system and device compatibility, easier online collaboration, and data sharing. Cesium and Mapbox are notable examples of this approach.
Due to data policy reasons, Mapbox had to leave the Chinese market. Cesium has become the most used 3D GIS engine in China. Early players, like SuperMap and Smart Yunzhou, initially used the Cesium engine framework. SuperMap, one of the largest GIS companies in China, has its geospatial platform deeply integrated into many government application markets.

SuperMap iClient3D for Cesium, Source: SuperMap
With the rise of Cesium, WebGL-based development became an early favorite in China, and it is now gradually moving towards WebGPU. The advantage of the web-based approach is to support multiple users simultaneously.
However, the golden era for 3D GIS engines was short-lived. Compared to the fantastic 3D effect of game engines, the visual effect of 3D GIS engines failed to win the favor of decision-makers, mostly the leaders in government. As a result, many projects are seeking solutions based on game engine frameworks.
Game Engine: Customers like the impressive effects
Popular game engines include Unreal Engine (UE) and Unity. They are both equipped with powerful features like advanced rendering, physics engines, and animation systems. Game engines offer impressive visualization effects, such as natural weather conditions, providing an excellent visual experience for users.
To enhance customer experience, various engine providers have chosen to combine game engines with WebRTC streaming. This method delivers excellent rendering effects but can handle only a limited number of users simultaneously.
Moreover, integrating and supporting geographical data is a significant shortcoming of game engines. There are various types of data, such as vector, raster, BIM, and IoT data. How to import these different types of data into game engines and align them with each other is a challenge. Typically, this requires processing through one or more third-party software, exporting as model files, then importing into the engine and manually aligning geographical positions, a very cumbersome process.
UE5 is widely recognized as the leading commercial game engine in China, and it is known for its exceptional visual effects. It even integrates GIS capabilities through the Cesium for Unreal plugin. Unity is also widely used, second only to UE in the industry. It is more manageable for beginners, offers higher development efficiency, has a larger community, and more developers in China.
51 World is one of the first companies in China to use the UE game engine to provide digital twin city services. They have significantly benefited from the game engine, becoming the largest urban digital twin engine provider in China. Additionally, companies like Freedo and Digital Hail are also based on UE, with deep modifications.
Smart Cities Digital Solution, Source: 51World
Transformation: How to support management?
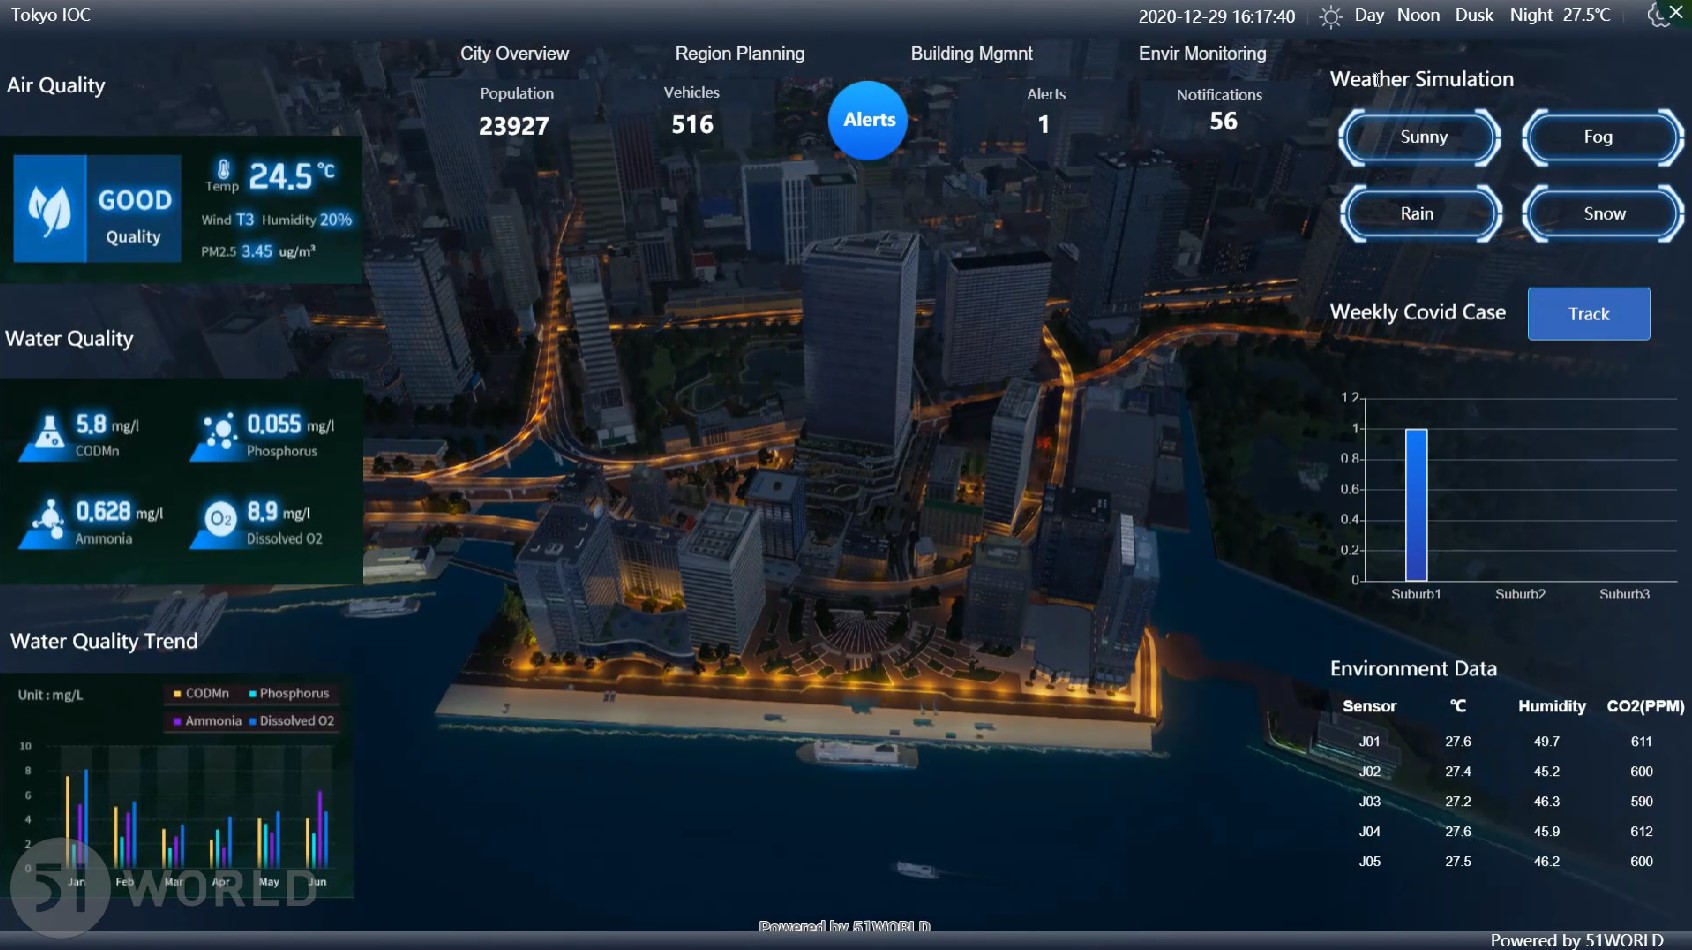
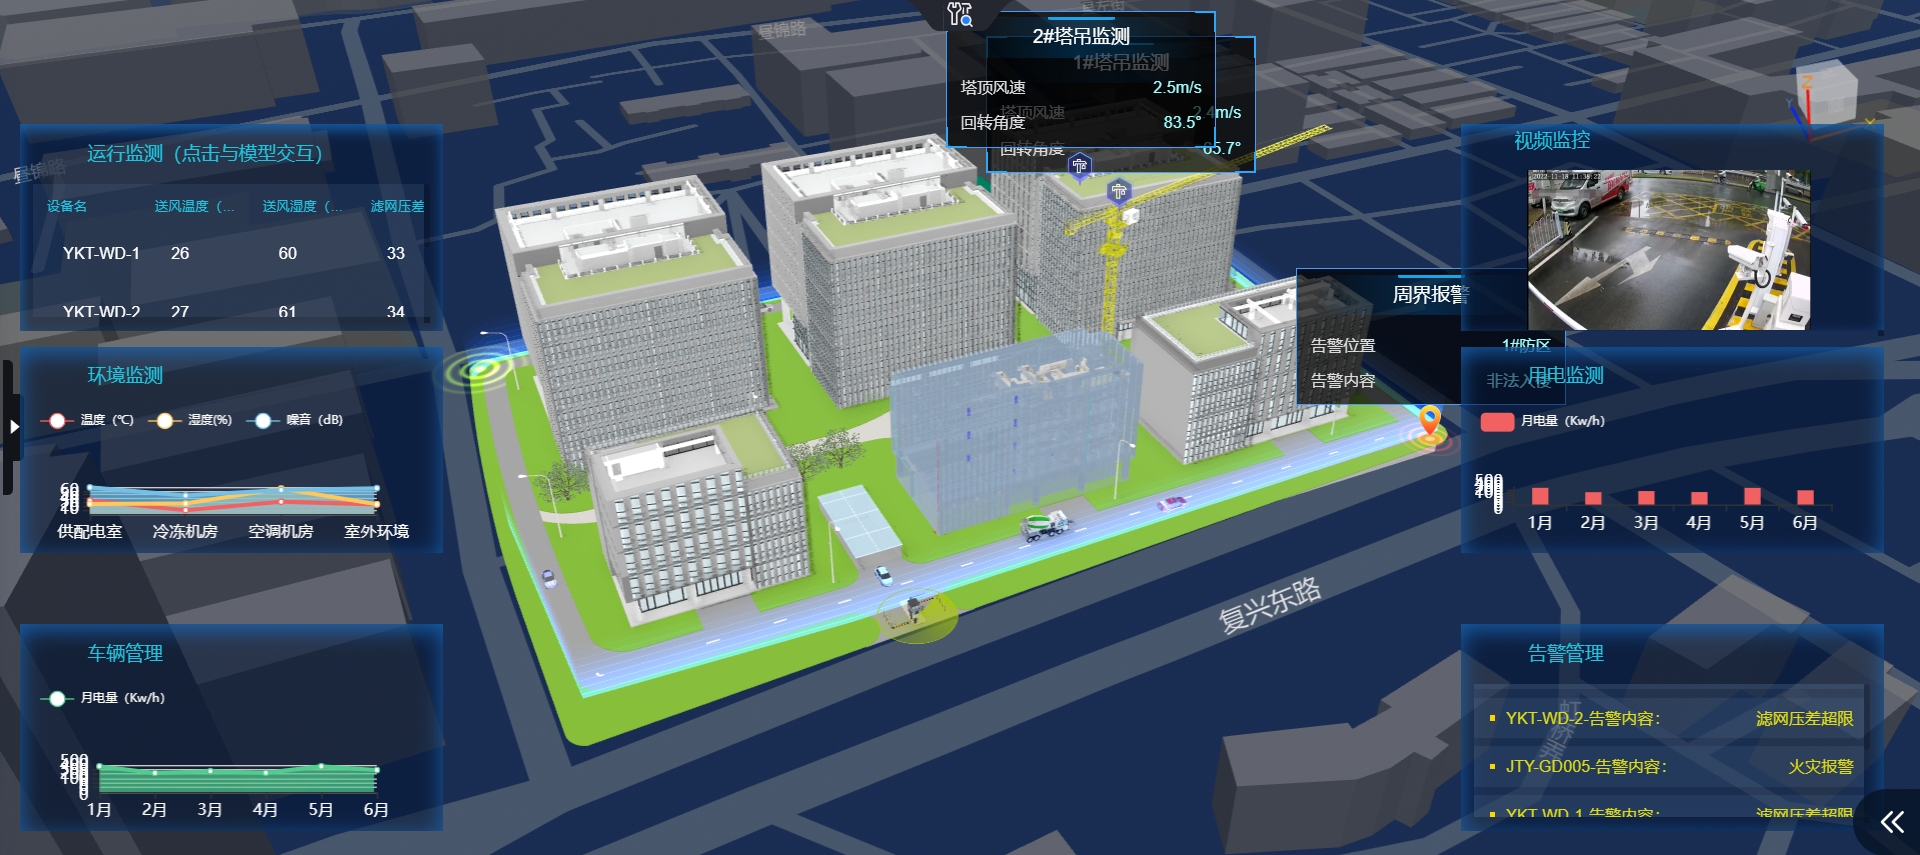
However, due to pressure in the economic situation, government budgets for smart city projects began to shrink in 2023. Especially after the initial boom in smart city projects, the only product is the large screen. This is a digital dashboard or command center display, as shown in the following photo. It operates by presenting urban data in a graphical format on large screens, enabling government agencies and leaders to understand the city’s operational status. The working principle of these large screens involves collecting data from various sources across the city, such as traffic cameras, environmental sensors, public service databases, and more.
Initially, the designer assumes that this aids in making informed decisions based on a better-visualized effect. Let’s imagine for instance that a crisis has happened: a mayor stands in front of the large screen and makes the emergency response decision remotely. We see this play out in movies and shows. But in reality, this isn’t the case, data cannot be collected, processed, and visualized on a large screen immediately. City managers will rarely make their decisions based on an outdated large screen.
Overreliance on these digital displays might also lead to neglect of on-the-ground realities and delays in critical decision-making if the system malfunctions. And currently, most of the large screens are only for demonstration purposes, not for operating and managing purposes. High installation and maintenance costs are also a barrier.
Decision-makers have realized that this doesn’t help. City models lacked meaningful descriptions and were not built with attributes, failing to align with the “digital twin” concept.

Large Screen: hundreds of graphs, charts, and maps on one screen
A period of transformation
As the gap between expectations and reality widened, governments’ enthusiasm for smart city projects has waned. This makes it harder for companies to win projects and increases the time it takes to get financial returns.
Many companies have entered a period of transformation. The question is, what’s next? Companies that have started the exploration phase include Gritworld, a graphics engine firm. They have shifted their focus to electric vehicles and XR devices, moving away from their previous focus on smart city stakeholders. PiCIMOS has expanded its offerings to include a new robotics simulation product line, diverging from its original city-centric business. Digitwin Technologies has transitioned from urban digital twins to concentrating on industrial digital twins. A self-rescue movement by smart city companies has begun.
During 2022-2023, the lockdown measures for the COVID-19 pandemic put significant financial pressure on local governments in China. Without having core values, governments didn’t want to plan their budget for smart cities. The industry began to think about how to better integrate with the decision support system in specific domains, such as infrastructure, emergency response, and hydrological management.
The first step was to integrate various types of data. Currently, the fusion of 3D data and semantic data is far from ideal. There is no standardization in how 3D spatial data is represented, leading to a fragmented approach by providers from different sectors such as GIS, BIM, video, and 3Dmax. While each approach has its advantages, the lack of a holistic perspective limits the overall development of applications.
Many BIM engine providers have more experience in merging diverse data types than GIS providers. Innovations like the Black Hole engine developed by Bingjiang Technology and the Multiverse developed by Vothing are examples. Enriching the attribute data of every building, every transport line, and every pipeline to involve the digital twin system in operations and maintenance management is a strong trend in the industry’s transformation.
Smart Building, Source: Vothing
The future: Localization, lightweight, and low-code
Looking to the future, there are several key trends in the digital twin cities industry that are particularly relevant for practitioners in China.
Undoubtedly, the primary one is localization. The main demand for digital twin cities in China currently comes from the government and state-owned enterprises, which are mandated to achieve localization of software by 2027. This has led to initiatives like Unity’s specialized Tuanjie Engine for the Chinese market. ‘Tuanjie (团结)’ is the Chinese word for Unity. Using the Chinese word instead of the English word as their brand, Unity tried to prove that their Chinese branch is independent from anywhere else. This kind of work shows their respect for the Chinese market as an international company, which is welcomed in China.
But it’s tricky to both keep or cut the connection. Taking Esri China as an example, it’s transformed into GeoScene (易智瑞) after localization. However, how much further can GeoScene develop the Esri product line in China, considering the R&D needs required? This is interesting to consider during discussions within the geospatial community.
Meanwhile, another major challenge is the lack of a clear certification standard for localization. For instance, it’s debatable whether highly modified products based on the UE engine, like those from 51 World or Freedo Technology, qualify as localized.
Currently, the issue is not just about restricting the use of certain projects; there might be further moves to ensure security by making data formats incompatible.
Moreover, the future also points towards the adoption of low-code and lightweight solutions. Low-code approaches promise to simplify the development process, making it more accessible to a broader range of professionals, such as the ThingJS developed by UINO.
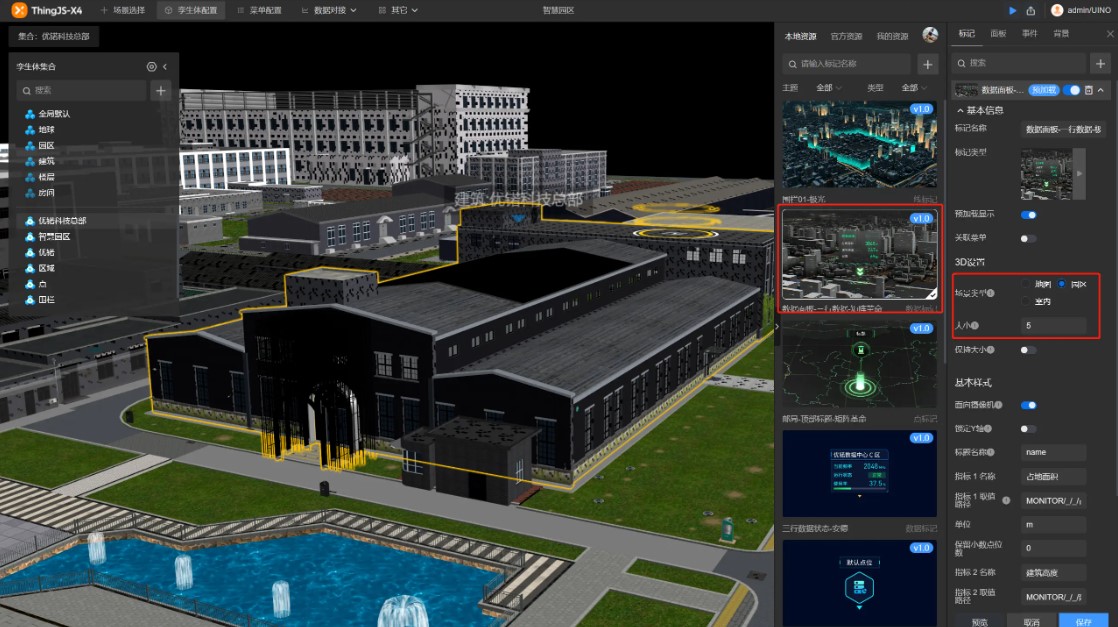
ThingJS-X, Source: UINO
Moving forward, embracing lightweight solutions is key for making digital twins technologies more user-friendly and widely accessible. These streamlined approaches are designed to minimize the need for top-tier hardware, like high-end graphics cards, making it easier and more cost-effective to implement digital twins. Glendale and QMAP are two great lightweight solutions providers in China.
Shaofei Zhao, CEO of Glendale, introduced that they used lots of lightweight technologies, such as instance technology, which stores identical model components only once to reduce data volume while maintaining scene integrity. Parametric technology describes common geometries with simple parameters, further reducing data size. These approaches enable even large 3D models, up to 1GB in size, to be processed into a lightweight format in under 10 minutes, improving model accessibility and interactivity. Mobile devices can be better supported by lightweight technologies. In the future, smart cities will not be limited to expensive hardware.
China’s urban digital twins market is unique and special because it’s strongly connected to the government. None of the international players can enter this market without local partners. Unity has made the first step, and more players will follow it. Although the market is growing slower now, it still keeps expanding with the backing of a robust government and the Digital China strategy.
Did you like the article about digital twins? Read more and subscribe to our monthly newsletter!