
In recent years, digital twins cities have rapidly emerged in China. As a policy-driven market, the Chinese government has been promoting the Digital China strategy over the past few years. A significant portion of the budget has been allocated to realistic 3D urban scenes and smart city initiatives. This has helped the industry grow quickly.
Within the industry, various geospatial enterprises were the first group to enjoy the benefits. However, the largest share of the market didn’t go to the geospatial companies. Instead, it was the companies that originated from the gaming engine.
Rendering realities: The game engine transforming urban digital twins
A crucial point of difference among all players was their choice and customization of rendering engines. There are two main types of 3D rendering cores in China: client-side rendering based on the web-based approach and stream rendering with WebRTC based on the game engines.
GIS Engine: Precise but not smart enough
Initially, geospatial companies were the first to enter the smart city market. And most of them chose the web-based approach. The web-based approach allows digital twin applications to be accessed without additional desktop software. It facilitates cross-system and device compatibility, easier online collaboration, and data sharing. Cesium and Mapbox are notable examples of this approach.
Due to data policy reasons, Mapbox had to leave the Chinese market. Cesium has become the most used 3D GIS engine in China. Early players, like SuperMap and Smart Yunzhou, initially used the Cesium engine framework. SuperMap, one of the largest GIS companies in China, has its geospatial platform deeply integrated into many government application markets.

SuperMap iClient3D for Cesium, Source: SuperMap
With the rise of Cesium, WebGL-based development became an early favorite in China, and it is now gradually moving towards WebGPU. The advantage of the web-based approach is to support multiple users simultaneously.
However, the golden era for 3D GIS engines was short-lived. Compared to the fantastic 3D effect of game engines, the visual effect of 3D GIS engines failed to win the favor of decision-makers, mostly the leaders in government. As a result, many projects are seeking solutions based on game engine frameworks.
Game Engine: Customers like the impressive effects
Popular game engines include Unreal Engine (UE) and Unity. They are both equipped with powerful features like advanced rendering, physics engines, and animation systems. Game engines offer impressive visualization effects, such as natural weather conditions, providing an excellent visual experience for users.
To enhance customer experience, various engine providers have chosen to combine game engines with WebRTC streaming. This method delivers excellent rendering effects but can handle only a limited number of users simultaneously.
Moreover, integrating and supporting geographical data is a significant shortcoming of game engines. There are various types of data, such as vector, raster, BIM, and IoT data. How to import these different types of data into game engines and align them with each other is a challenge. Typically, this requires processing through one or more third-party software, exporting as model files, then importing into the engine and manually aligning geographical positions, a very cumbersome process.
UE5 is widely recognized as the leading commercial game engine in China, and it is known for its exceptional visual effects. It even integrates GIS capabilities through the Cesium for Unreal plugin. Unity is also widely used, second only to UE in the industry. It is more manageable for beginners, offers higher development efficiency, has a larger community, and more developers in China.
51 World is one of the first companies in China to use the UE game engine to provide digital twin city services. They have significantly benefited from the game engine, becoming the largest urban digital twin engine provider in China. Additionally, companies like Freedo and Digital Hail are also based on UE, with deep modifications.

Smart Cities Digital Solution, Source: 51World
Transformation: How to support management?
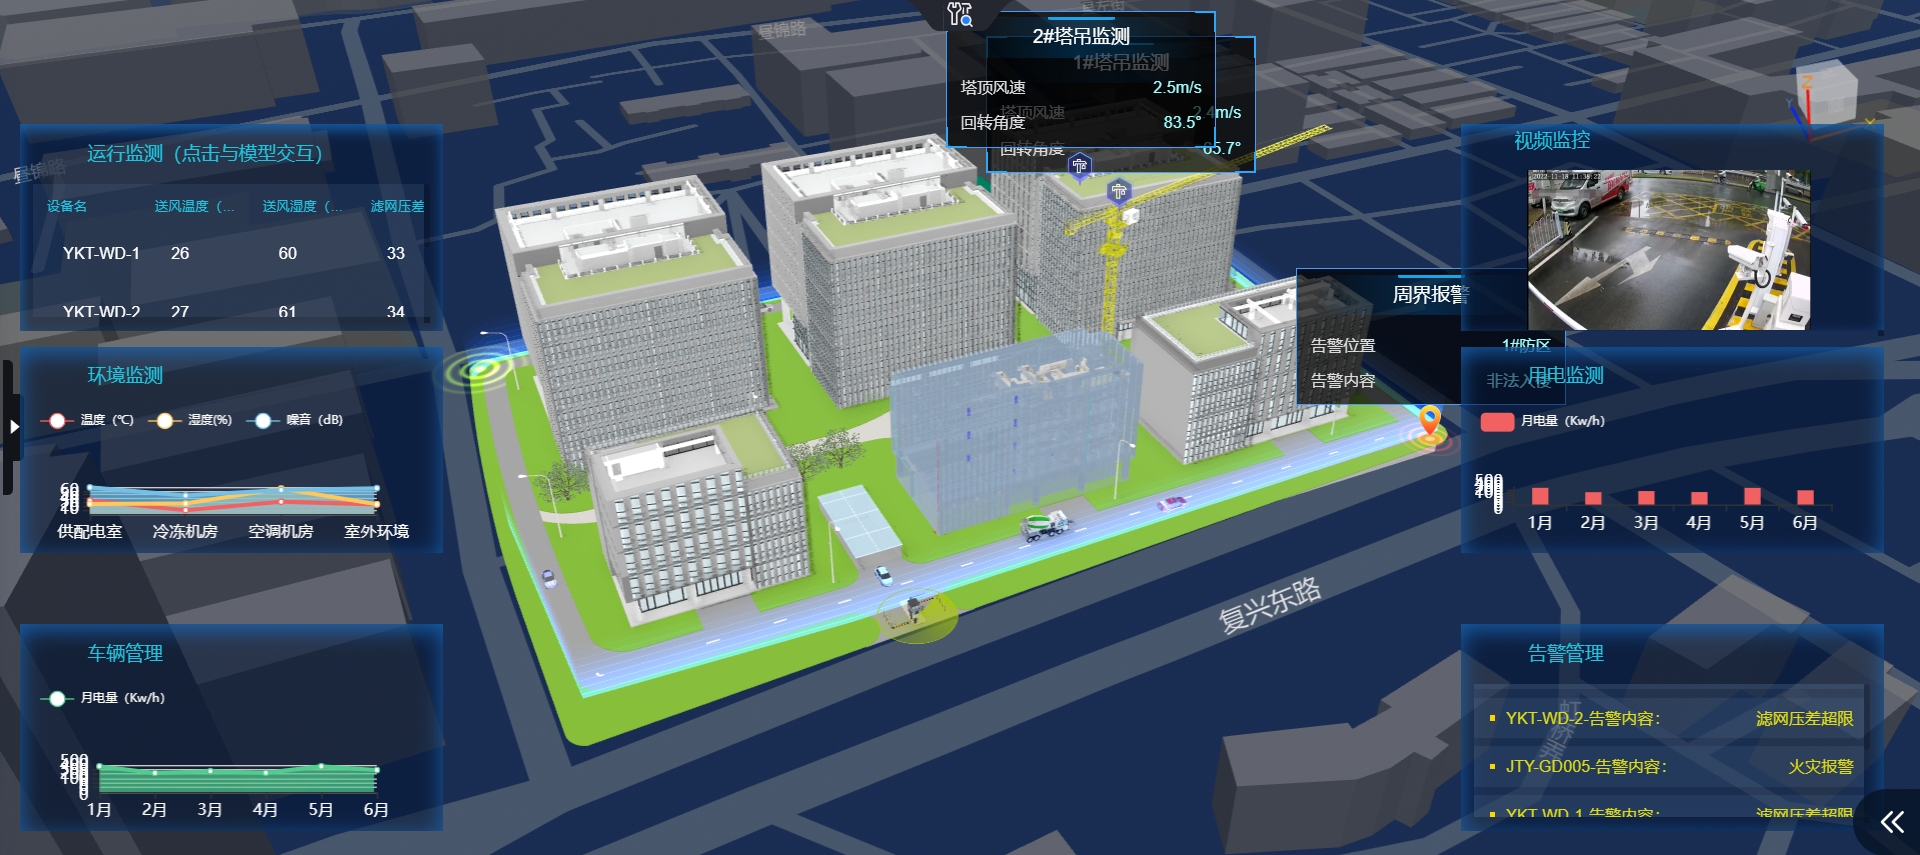
However, due to pressure in the economic situation, government budgets for smart city projects began to shrink in 2023. Especially after the initial boom in smart city projects, the only product is the large screen. This is a digital dashboard or command center display, as shown in the following photo. It operates by presenting urban data in a graphical format on large screens, enabling government agencies and leaders to understand the city’s operational status. The working principle of these large screens involves collecting data from various sources across the city, such as traffic cameras, environmental sensors, public service databases, and more.
Initially, the designer assumes that this aids in making informed decisions based on a better-visualized effect. Let’s imagine for instance that a crisis has happened: a mayor stands in front of the large screen and makes the emergency response decision remotely. We see this play out in movies and shows. But in reality, this isn’t the case, data cannot be collected, processed, and visualized on a large screen immediately. City managers will rarely make their decisions based on an outdated large screen.
Overreliance on these digital displays might also lead to neglect of on-the-ground realities and delays in critical decision-making if the system malfunctions. And currently, most of the large screens are only for demonstration purposes, not for operating and managing purposes. High installation and maintenance costs are also a barrier.
Decision-makers have realized that this doesn’t help. City models lacked meaningful descriptions and were not built with attributes, failing to align with the “digital twin” concept.

Large Screen: hundreds of graphs, charts, and maps on one screen
A period of transformation
As the gap between expectations and reality widened, governments’ enthusiasm for smart city projects has waned. This makes it harder for companies to win projects and increases the time it takes to get financial returns.
Many companies have entered a period of transformation. The question is, what’s next? Companies that have started the exploration phase include Gritworld, a graphics engine firm. They have shifted their focus to electric vehicles and XR devices, moving away from their previous focus on smart city stakeholders. PiCIMOS has expanded its offerings to include a new robotics simulation product line, diverging from its original city-centric business. Digitwin Technologies has transitioned from urban digital twins to concentrating on industrial digital twins. A self-rescue movement by smart city companies has begun.
During 2022-2023, the lockdown measures for the COVID-19 pandemic put significant financial pressure on local governments in China. Without having core values, governments didn’t want to plan their budget for smart cities. The industry began to think about how to better integrate with the decision support system in specific domains, such as infrastructure, emergency response, and hydrological management.
The first step was to integrate various types of data. Currently, the fusion of 3D data and semantic data is far from ideal. There is no standardization in how 3D spatial data is represented, leading to a fragmented approach by providers from different sectors such as GIS, BIM, video, and 3Dmax. While each approach has its advantages, the lack of a holistic perspective limits the overall development of applications.
Many BIM engine providers have more experience in merging diverse data types than GIS providers. Innovations like the Black Hole engine developed by Bingjiang Technology and the Multiverse developed by Vothing are examples. Enriching the attribute data of every building, every transport line, and every pipeline to involve the digital twin system in operations and maintenance management is a strong trend in the industry’s transformation.
Smart Building, Source: Vothing
The future: Localization, lightweight, and low-code
Looking to the future, there are several key trends in the digital twin cities industry that are particularly relevant for practitioners in China.
Undoubtedly, the primary one is localization. The main demand for digital twin cities in China currently comes from the government and state-owned enterprises, which are mandated to achieve localization of software by 2027. This has led to initiatives like Unity’s specialized Tuanjie Engine for the Chinese market. ‘Tuanjie (团结)’ is the Chinese word for Unity. Using the Chinese word instead of the English word as their brand, Unity tried to prove that their Chinese branch is independent from anywhere else. This kind of work shows their respect for the Chinese market as an international company, which is welcomed in China.
But it’s tricky to both keep or cut the connection. Taking Esri China as an example, it’s transformed into GeoScene (易智瑞) after localization. However, how much further can GeoScene develop the Esri product line in China, considering the R&D needs required? This is interesting to consider during discussions within the geospatial community.
Meanwhile, another major challenge is the lack of a clear certification standard for localization. For instance, it’s debatable whether highly modified products based on the UE engine, like those from 51 World or Freedo Technology, qualify as localized.
Currently, the issue is not just about restricting the use of certain projects; there might be further moves to ensure security by making data formats incompatible.
Moreover, the future also points towards the adoption of low-code and lightweight solutions. Low-code approaches promise to simplify the development process, making it more accessible to a broader range of professionals, such as the ThingJS developed by UINO.
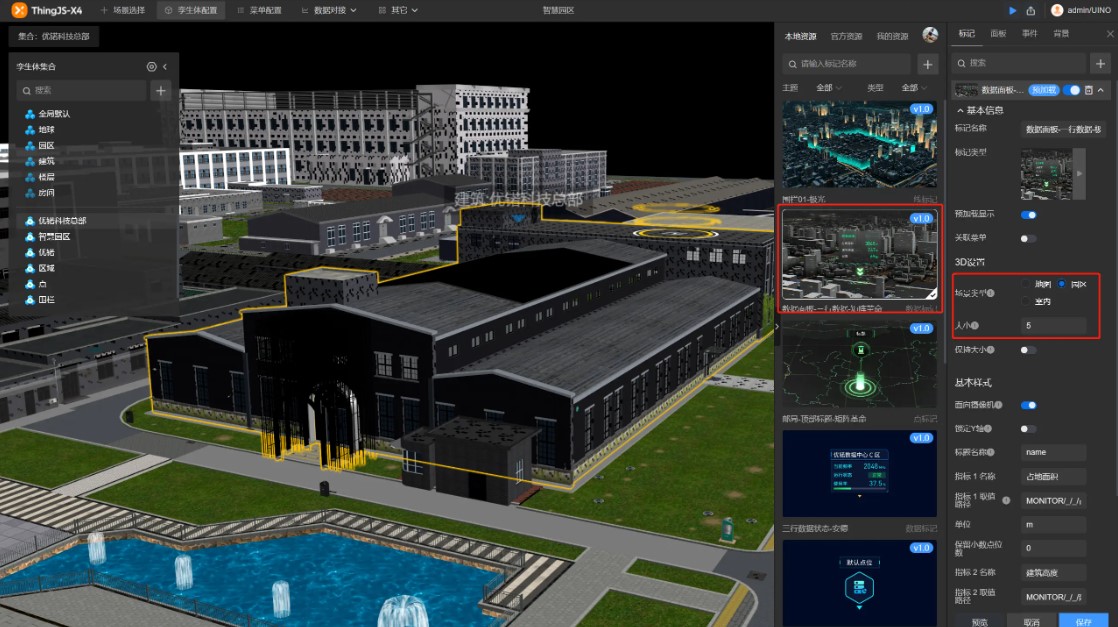
ThingJS-X, Source: UINO
Moving forward, embracing lightweight solutions is key for making digital twins technologies more user-friendly and widely accessible. These streamlined approaches are designed to minimize the need for top-tier hardware, like high-end graphics cards, making it easier and more cost-effective to implement digital twins. Glendale and QMAP are two great lightweight solutions providers in China.
Shaofei Zhao, CEO of Glendale, introduced that they used lots of lightweight technologies, such as instance technology, which stores identical model components only once to reduce data volume while maintaining scene integrity. Parametric technology describes common geometries with simple parameters, further reducing data size. These approaches enable even large 3D models, up to 1GB in size, to be processed into a lightweight format in under 10 minutes, improving model accessibility and interactivity. Mobile devices can be better supported by lightweight technologies. In the future, smart cities will not be limited to expensive hardware.
China’s urban digital twins market is unique and special because it’s strongly connected to the government. None of the international players can enter this market without local partners. Unity has made the first step, and more players will follow it. Although the market is growing slower now, it still keeps expanding with the backing of a robust government and the Digital China strategy.
Did you like the article about digital twins? Read more and subscribe to our monthly newsletter!

#Business


Next article

Our planet Earth is a continuously transforming landscape. From the constant shift of tectonic plates to the subtle movements of sediment, the surface beneath our feet is seldom still. These movements, triggered by a variety of factors such as earthquakes, volcanic eruptions, melting glaciers, and even human activities, shape the world’s surface. But how do we keep track of these changes, especially when they span vast areas? Satellite technology comes to the rescue, especially Interferometric Synthetic Aperture Radar (InSAR).
InSAR technology in a nutshell
At its core, InSAR is a high-tech method that utilizes satellites to monitor the Earth’s surface. Here’s how it works: a satellite emits signals towards the Earth. Then the signals bounce back and are captured by the satellite. The time it takes for these signals to return provides critical data. By making multiple passes over a region, engineers can detect even minor shifts in the terrain. This process yields what’s known as an interferogram, a visual representation full of colorful fringes, each signifying terrain movement. A notable example is from the aftermath of the 2016 Kumamoto earthquake in Japan, showcased through imagery from the Sentinel-1 satellite.
Interferograms are intriguing, displaying movements through a color scale linked to the phase shift of waves. Initially, these images are wrapped, limiting the clarity of the changes. Through a technique known as unwrapping, these interferograms are transformed, presenting the shifts in a more comprehensible metric form, thereby aiding in analysis and decision-making.
Interferogram and metric displacements – aftermath of the 2016 earthquake in Kumamoto, Kiusiu, Japan. Source: Alaska Satellite Facility
SAR processing – DIY methods
The emergence of SAR technology has significantly democratized access to Earth observation data, moving it from the exclusive realm of experts to the public domain. Initiatives like the Alaska Satellite Facility have opened the gates to a wealth of radar images, enabling anyone with internet access to explore the nuances of our planet’s surface.
Supporting this democratization, the European Space Agency’s Sentinel Application Platform (SNAP) plays a crucial role by transforming complex SAR data into user-friendly formats. SNAP, alongside its comprehensive guides, is designed for a broad user base, ensuring that individuals, regardless of their expertise level, can understand and utilize satellite data effectively.
This shift towards open access has multiple benefits. It promotes a well-informed public, enriches scientific research by incorporating diverse perspectives, and supports practical applications in emergency response, urban planning, and environmental management. Moreover, it serves an educational purpose, providing students and teachers with real-world data for learning and research.
European Ground Motion Service
An ambitious initiative in Earth observation is the European Ground Motion Service (EGMS), a part of the Copernicus project, often described as Europe’s eyes on our planet. EGMS isn’t just about monitoring; it’s about understanding and analyzing. It specializes in tracking ground movements. For instance, detecting significant uplifts of the Earth’s crust in Scandinavia, as a result of isostatic rebound. The isostatic rebound is the gradual rising of landmasses after the removal of a heavy load, such as melting glaciers, due to the Earth’s crust readjusting to the reduced weight. The velocity of uplifts can reach a value of 20 mm/year! What makes EGMS invaluable in this context is its precision – the service is capable of detecting displacements as small as one millimeter. This level of detail is critical, especially in earthquake-prone regions where even small shifts can have massive implications on infrastructure, water supply, and overall safety.
Isostatic rebound on the Scandinavian Peninsula. Source: EGMS
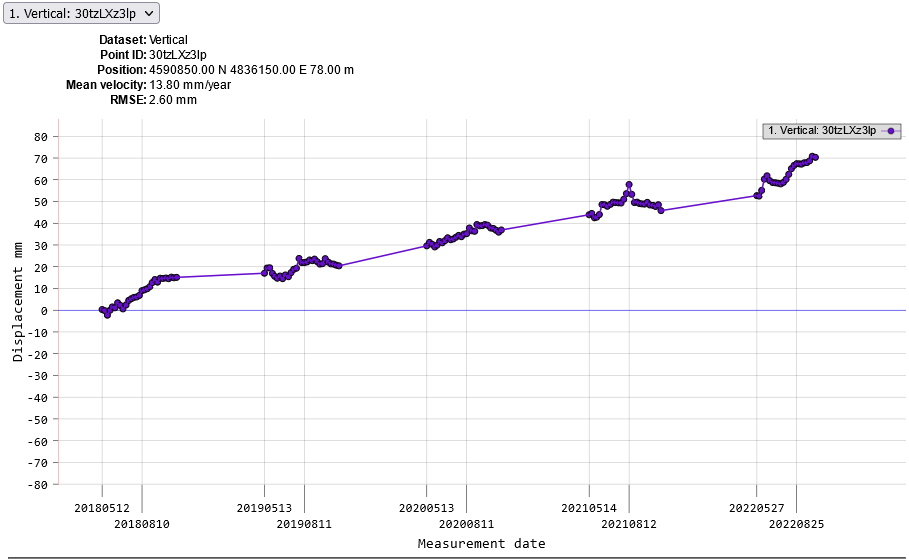
What sets EGMS apart is its user-centric features. The service doesn’t just provide raw data; it empowers users to delve deeper. One of the key functionalities is its ability to generate detailed charts for each measurement point. This feature allows for a granular analysis of ground movements over time, providing insights into patterns, trends, and anomalies that might go unnoticed in broader datasets.
Moreover, recognizing the diverse needs of its users, EGMS offers the capability to download datasets in .csv format. This accessibility ensures that researchers, planners, and the curious public can integrate this vital data into their own analyses, models, or reports, bridging the gap between raw data and actionable knowledge. With updates rolling out annually, EGMS stands as a dynamic, evolving tool designed to keep pace with the Earth’s rhythms and changes, ensuring that anyone interested can stay informed about the shifts and shakes of the surface of our planet.
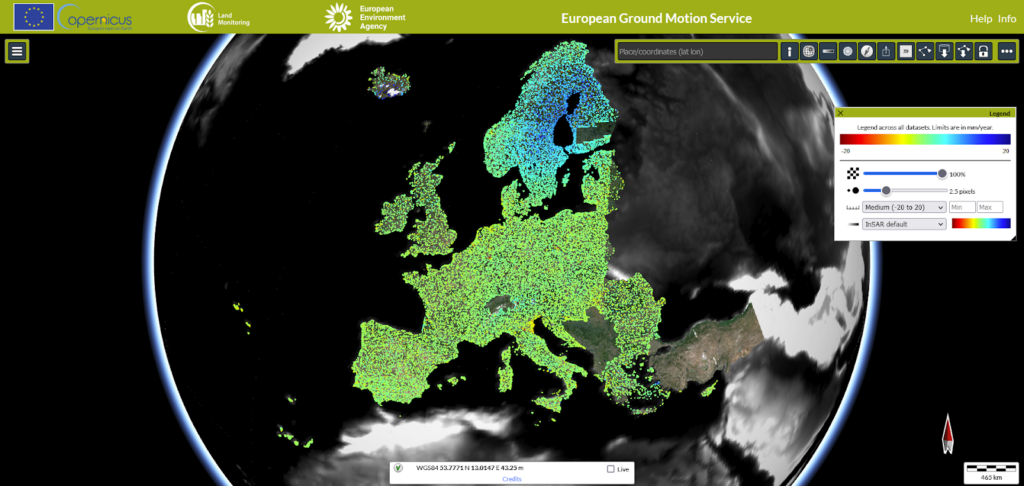
European Ground Motion Service – main page. Source: EGMS
Case study: How to assess the impact of the 2021 Arkalochori earthquake in Crete
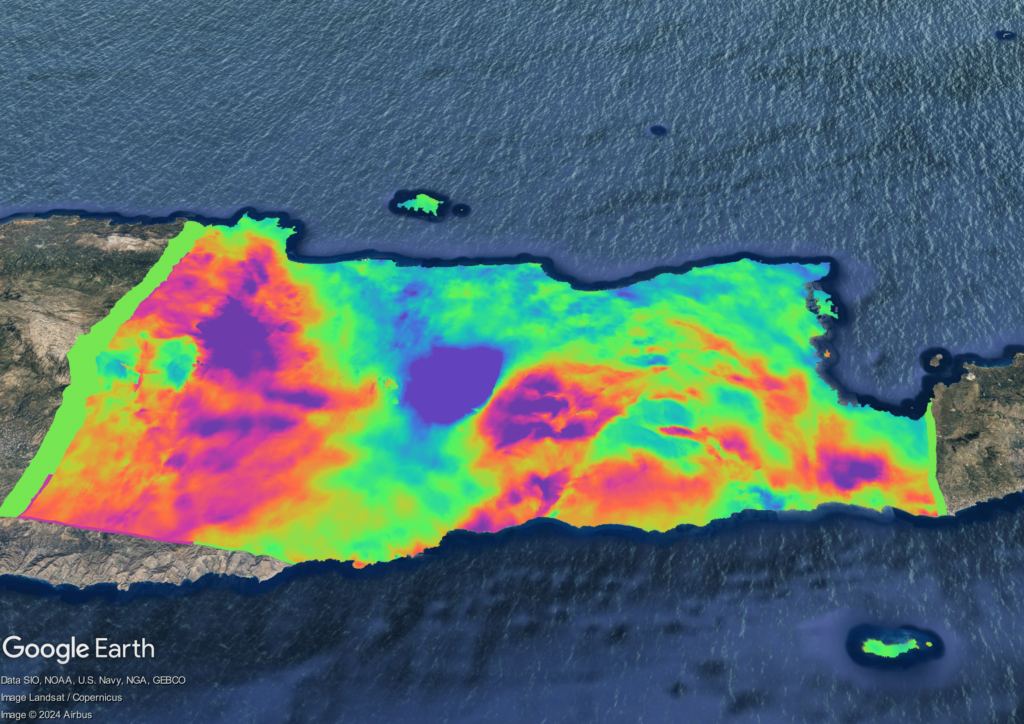
EGMS stands as a great source of data for those studying the dynamic nature of our planet, especially in areas vulnerable to seismic activities like Crete, Greece. This Mediterranean island, situated at the unstable intersection of the Eurasian and African tectonic plates, serves as a prime example of how the Earth’s forces shape our world. On 27th of September 2021, the earthquake struck the island of Crete, with the epicenter located southeast of Heraklion (35.3°N 25.3°E).
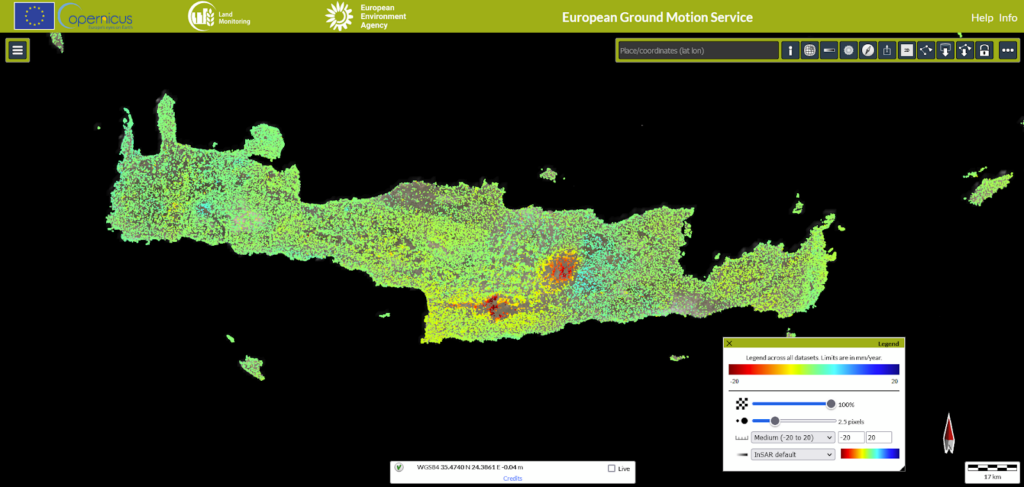
Ground displacement in Crete. Source: EGMS
Measuring 6.0 Mw with a maximum intensity of VIII (Severe) on the Modified Mercalli Intensity Scale, this earthquake showcases the EGMS’ capabilites. This event on 27.09.2021 was not just another statistic; it brought significant vertical shifts to the island’s landscape. The ground on Crete has decreased by almost 20 cm! The data provided by EGMS service can help in identifying areas exposed to hazards. Thanks to its features users may check a specific day where a large displacement of the terrain occurred. Moreover, data visualization allows for the analysis of displacement velocity.The case of Crete underscores the service’s role not just in crisis situations but also in long-term planning and preparedness.
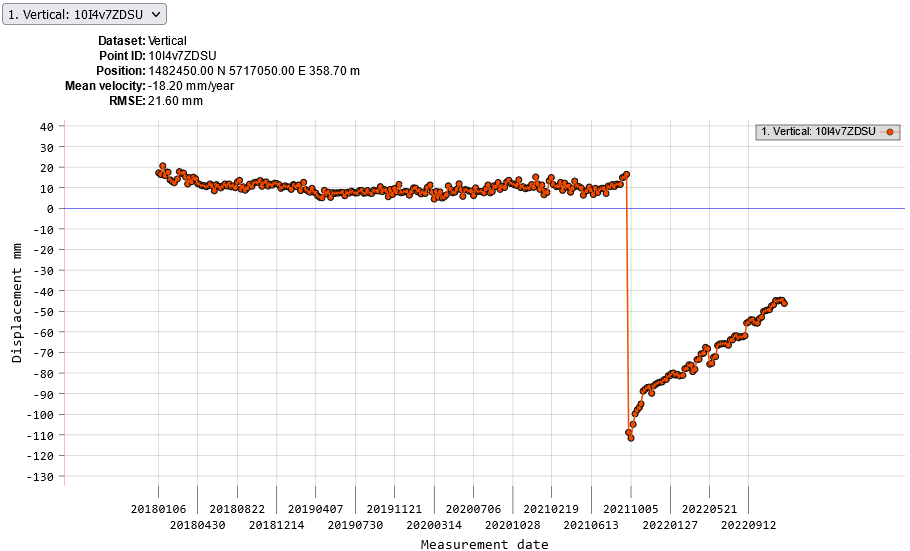
Vertical displacement after the earthquake. Source: EGMS
To validate measurements from EGMS, radar images can be processed in SNAP software. But how do we know which satellite dataset is appropriate for determining movements on the earth’s surface after incidents like earthquakes?
When choosing an appropriate pair of images to process InSAR data, a baseline chart may be helpful. The idea is simple: the satellite’s position from primary measurement should be almost identical to the satellite’s position from secondary measurement. The perpendicular distance between the positions of the two satellites ought to be close to zero. Naturally, the primary and secondary satellite flyby must occur appropriately before and after the incident. The chart below shows the configuration of satellites in the period of September to October 2021. The black dot refers to the position of satellite Sentinel-1 on 6 October 2021. The red dot refers to the position of the satellite on 24 September 2021. The perpendicular distance between these positions is about 2 meters. What was the most crucial was the fact that the two time series were right before and after the earthquake in Crete.
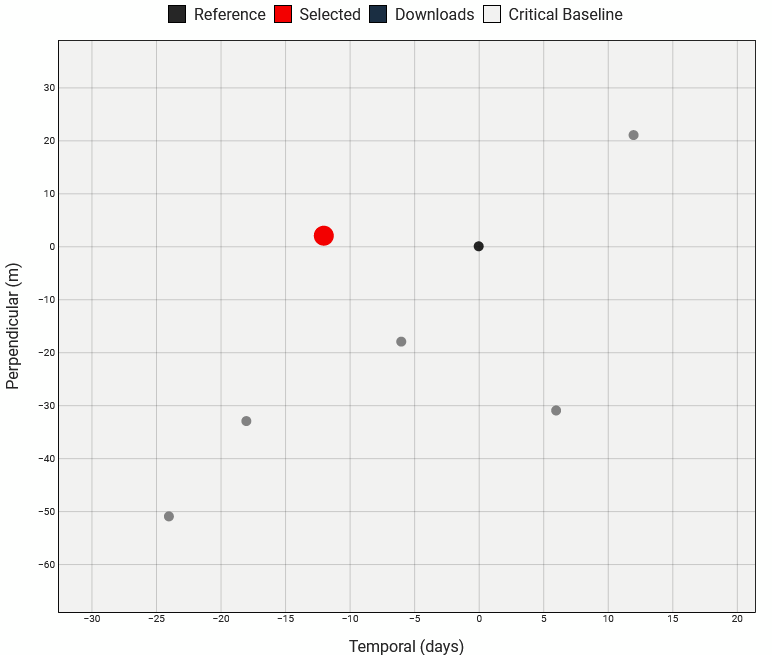
Baseline chart
Then the workflow can continue. Intermediate results, like wrapped and unwrapped interferograms, show that there were some displacements right after the earthquake. Unfortunately, the map legends are not reliable – values on the scale are connected with wave phase shift. For a wrapped interferogram, there is a noticeable range of 2π. Eventually, the clearest visualization is to represent displacements on a metric scale. Comparing EGMS products and SNAP processing the results are similar. There was a subsidence of up to 20 cm in the area of the earthquake epicenter. The below images show the difference between wrapped interferograms and metric displacement. It is worth paying attention to the values on the scale.
Crete case-study. Interferogram and metric displacements
The importance of InSAR data
The aforementioned examples underscore the indispensable nature of InSAR data in modern Earth observation. In an era where environmental and geological changes are more dynamic than ever, InSAR provides a dependable tool for monitoring and responding to our planet’s shifts. Whether for scientific research, disaster response, or environmental monitoring, the capabilities of satellite interferometry are transforming our understanding of the Earth’s surface.
Through the EGMS, researchers and decision-makers can access before-and-after comparisons of InSAR data, providing clear evidence of ground movements. This is not just about identifying areas of displacement; it’s about understanding the scale and direction of these shifts. Such detailed information is crucial for emergency response, urban planning, and rebuilding efforts post-disaster.
In conclusion, as we continue to witness the Earth’s ever-changing landscape, technologies like InSAR are essential in keeping us informed and prepared. By mastering the power of spaceborne radar, we can better understand our planet’s dynamics, ultimately leading to more informed decisions and resilient societies.