
Our planet Earth is a continuously transforming landscape. From the constant shift of tectonic plates to the subtle movements of sediment, the surface beneath our feet is seldom still. These movements, triggered by a variety of factors such as earthquakes, volcanic eruptions, melting glaciers, and even human activities, shape the world’s surface. But how do we keep track of these changes, especially when they span vast areas? Satellite technology comes to the rescue, especially Interferometric Synthetic Aperture Radar (InSAR).
InSAR technology in a nutshell
At its core, InSAR is a high-tech method that utilizes satellites to monitor the Earth’s surface. Here’s how it works: a satellite emits signals towards the Earth. Then the signals bounce back and are captured by the satellite. The time it takes for these signals to return provides critical data. By making multiple passes over a region, engineers can detect even minor shifts in the terrain. This process yields what’s known as an interferogram, a visual representation full of colorful fringes, each signifying terrain movement. A notable example is from the aftermath of the 2016 Kumamoto earthquake in Japan, showcased through imagery from the Sentinel-1 satellite.
Interferograms are intriguing, displaying movements through a color scale linked to the phase shift of waves. Initially, these images are wrapped, limiting the clarity of the changes. Through a technique known as unwrapping, these interferograms are transformed, presenting the shifts in a more comprehensible metric form, thereby aiding in analysis and decision-making.
Interferogram and metric displacements – aftermath of the 2016 earthquake in Kumamoto, Kiusiu, Japan. Source: Alaska Satellite Facility
SAR processing – DIY methods
The emergence of SAR technology has significantly democratized access to Earth observation data, moving it from the exclusive realm of experts to the public domain. Initiatives like the Alaska Satellite Facility have opened the gates to a wealth of radar images, enabling anyone with internet access to explore the nuances of our planet’s surface.
Supporting this democratization, the European Space Agency’s Sentinel Application Platform (SNAP) plays a crucial role by transforming complex SAR data into user-friendly formats. SNAP, alongside its comprehensive guides, is designed for a broad user base, ensuring that individuals, regardless of their expertise level, can understand and utilize satellite data effectively.
This shift towards open access has multiple benefits. It promotes a well-informed public, enriches scientific research by incorporating diverse perspectives, and supports practical applications in emergency response, urban planning, and environmental management. Moreover, it serves an educational purpose, providing students and teachers with real-world data for learning and research.
European Ground Motion Service
An ambitious initiative in Earth observation is the European Ground Motion Service (EGMS), a part of the Copernicus project, often described as Europe’s eyes on our planet. EGMS isn’t just about monitoring; it’s about understanding and analyzing. It specializes in tracking ground movements. For instance, detecting significant uplifts of the Earth’s crust in Scandinavia, as a result of isostatic rebound. The isostatic rebound is the gradual rising of landmasses after the removal of a heavy load, such as melting glaciers, due to the Earth’s crust readjusting to the reduced weight. The velocity of uplifts can reach a value of 20 mm/year! What makes EGMS invaluable in this context is its precision – the service is capable of detecting displacements as small as one millimeter. This level of detail is critical, especially in earthquake-prone regions where even small shifts can have massive implications on infrastructure, water supply, and overall safety.
Isostatic rebound on the Scandinavian Peninsula. Source: EGMS
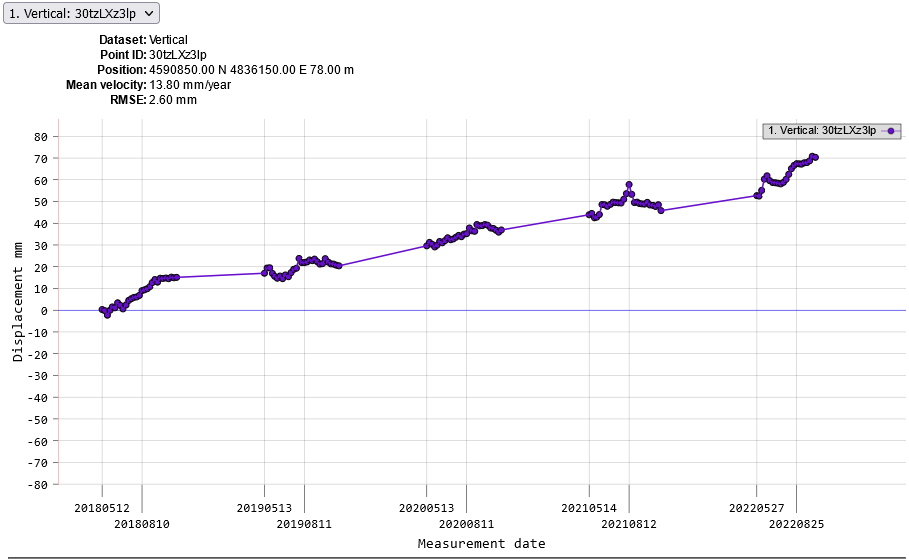
What sets EGMS apart is its user-centric features. The service doesn’t just provide raw data; it empowers users to delve deeper. One of the key functionalities is its ability to generate detailed charts for each measurement point. This feature allows for a granular analysis of ground movements over time, providing insights into patterns, trends, and anomalies that might go unnoticed in broader datasets.
Moreover, recognizing the diverse needs of its users, EGMS offers the capability to download datasets in .csv format. This accessibility ensures that researchers, planners, and the curious public can integrate this vital data into their own analyses, models, or reports, bridging the gap between raw data and actionable knowledge. With updates rolling out annually, EGMS stands as a dynamic, evolving tool designed to keep pace with the Earth’s rhythms and changes, ensuring that anyone interested can stay informed about the shifts and shakes of the surface of our planet.
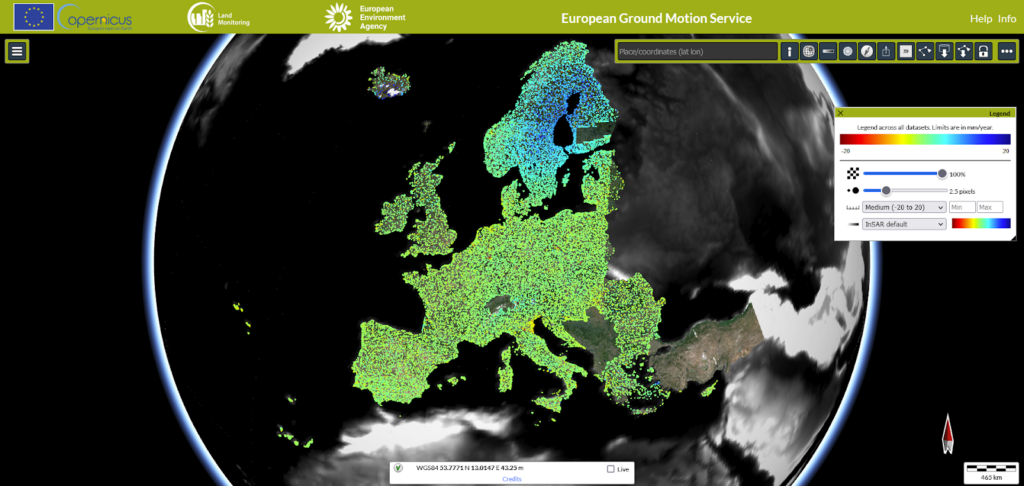
European Ground Motion Service – main page. Source: EGMS
Case study: How to assess the impact of the 2021 Arkalochori earthquake in Crete
EGMS stands as a great source of data for those studying the dynamic nature of our planet, especially in areas vulnerable to seismic activities like Crete, Greece. This Mediterranean island, situated at the unstable intersection of the Eurasian and African tectonic plates, serves as a prime example of how the Earth’s forces shape our world. On 27th of September 2021, the earthquake struck the island of Crete, with the epicenter located southeast of Heraklion (35.3°N 25.3°E).
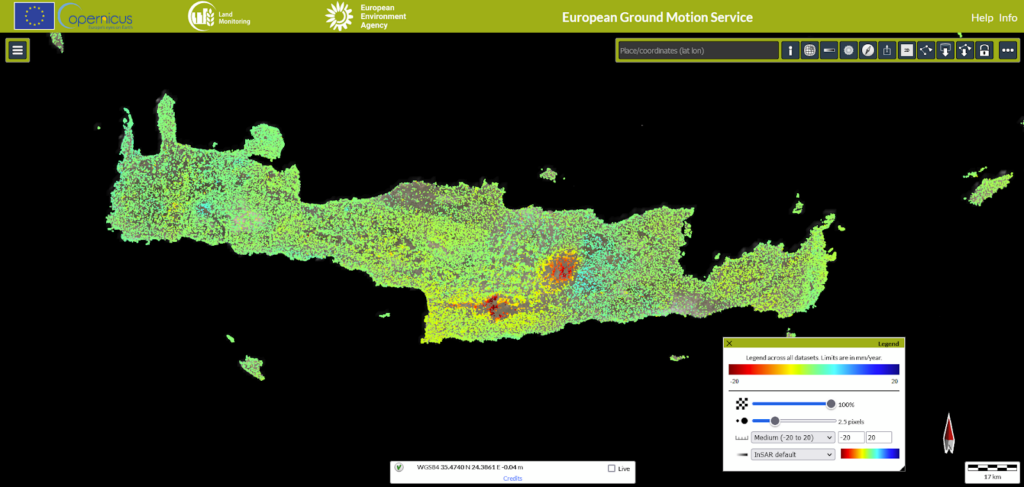
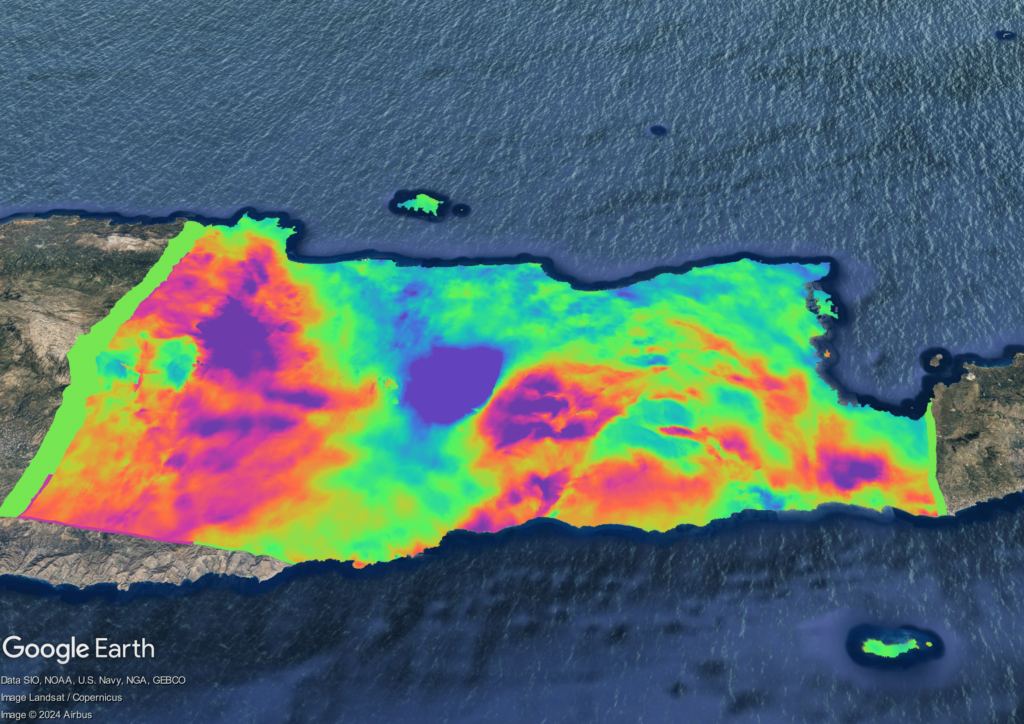
Ground displacement in Crete. Source: EGMS
Measuring 6.0 Mw with a maximum intensity of VIII (Severe) on the Modified Mercalli Intensity Scale, this earthquake showcases the EGMS’ capabilites. This event on 27.09.2021 was not just another statistic; it brought significant vertical shifts to the island’s landscape. The ground on Crete has decreased by almost 20 cm! The data provided by EGMS service can help in identifying areas exposed to hazards. Thanks to its features users may check a specific day where a large displacement of the terrain occurred. Moreover, data visualization allows for the analysis of displacement velocity.The case of Crete underscores the service’s role not just in crisis situations but also in long-term planning and preparedness.
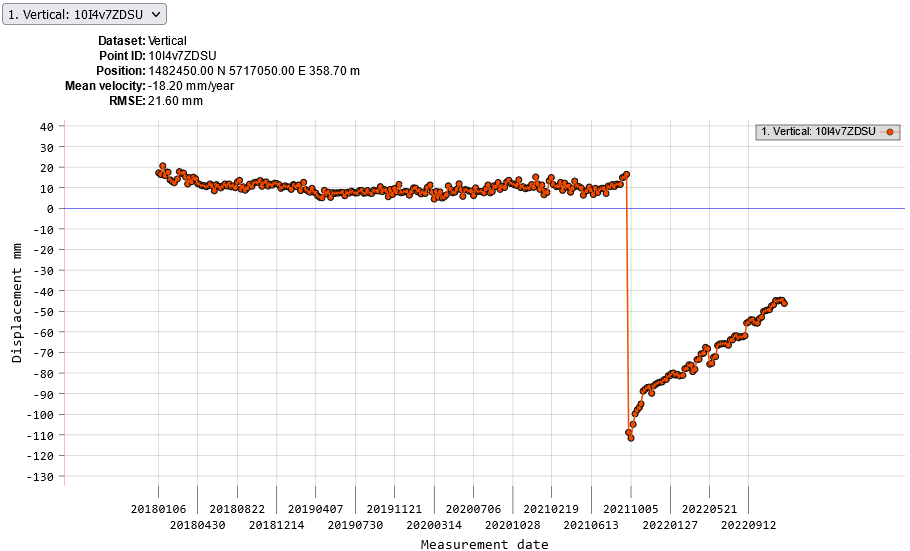
Vertical displacement after the earthquake. Source: EGMS
To validate measurements from EGMS, radar images can be processed in SNAP software. But how do we know which satellite dataset is appropriate for determining movements on the earth’s surface after incidents like earthquakes?
When choosing an appropriate pair of images to process InSAR data, a baseline chart may be helpful. The idea is simple: the satellite’s position from primary measurement should be almost identical to the satellite’s position from secondary measurement. The perpendicular distance between the positions of the two satellites ought to be close to zero. Naturally, the primary and secondary satellite flyby must occur appropriately before and after the incident. The chart below shows the configuration of satellites in the period of September to October 2021. The black dot refers to the position of satellite Sentinel-1 on 6 October 2021. The red dot refers to the position of the satellite on 24 September 2021. The perpendicular distance between these positions is about 2 meters. What was the most crucial was the fact that the two time series were right before and after the earthquake in Crete.
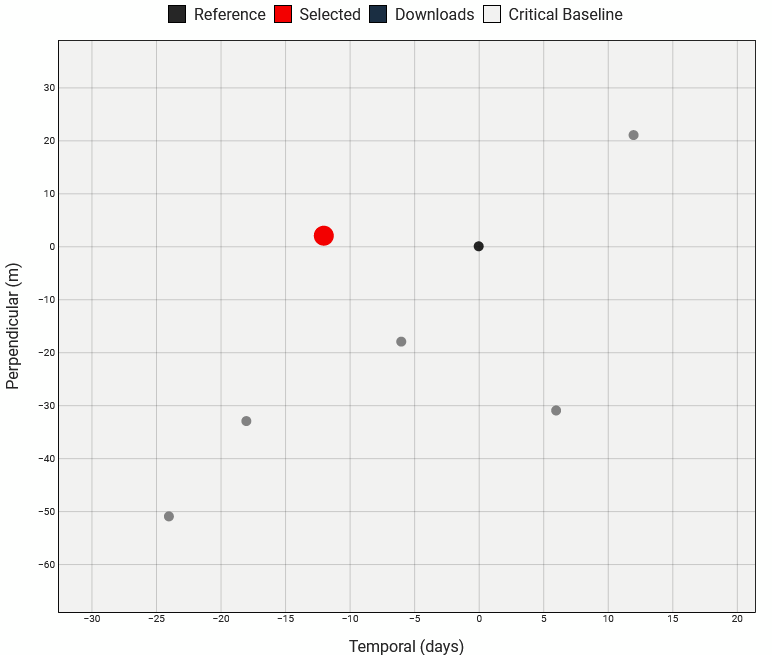
Baseline chart
Then the workflow can continue. Intermediate results, like wrapped and unwrapped interferograms, show that there were some displacements right after the earthquake. Unfortunately, the map legends are not reliable – values on the scale are connected with wave phase shift. For a wrapped interferogram, there is a noticeable range of 2π. Eventually, the clearest visualization is to represent displacements on a metric scale. Comparing EGMS products and SNAP processing the results are similar. There was a subsidence of up to 20 cm in the area of the earthquake epicenter. The below images show the difference between wrapped interferograms and metric displacement. It is worth paying attention to the values on the scale.
Crete case-study. Interferogram and metric displacements
The importance of InSAR data
The aforementioned examples underscore the indispensable nature of InSAR data in modern Earth observation. In an era where environmental and geological changes are more dynamic than ever, InSAR provides a dependable tool for monitoring and responding to our planet’s shifts. Whether for scientific research, disaster response, or environmental monitoring, the capabilities of satellite interferometry are transforming our understanding of the Earth’s surface.
Through the EGMS, researchers and decision-makers can access before-and-after comparisons of InSAR data, providing clear evidence of ground movements. This is not just about identifying areas of displacement; it’s about understanding the scale and direction of these shifts. Such detailed information is crucial for emergency response, urban planning, and rebuilding efforts post-disaster.
In conclusion, as we continue to witness the Earth’s ever-changing landscape, technologies like InSAR are essential in keeping us informed and prepared. By mastering the power of spaceborne radar, we can better understand our planet’s dynamics, ultimately leading to more informed decisions and resilient societies.

#Satellites

Next article
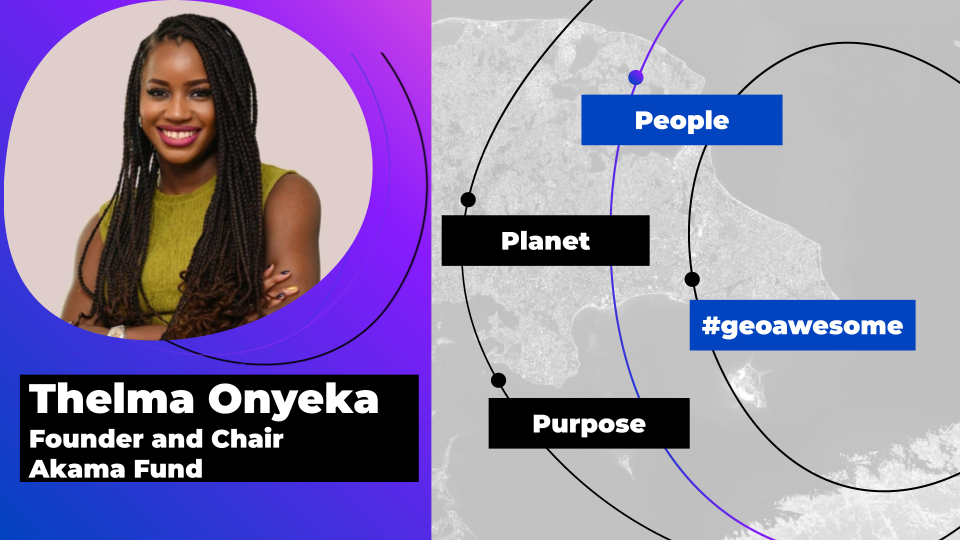
Create a More Inclusive and Diverse Geospatial Community with Akama Fund and Esri’s Geospatial Student Accelerator Scheme

Meet Thelma Onyeka, simplifying providing financial support to students.
On 4 March Esri UK announced it has partnered with Akama Fund, a charity dedicated to supporting students and facilitating accessible scholarships, to create a new scholarship programme for Black and mixed Black heritage students. Designed to support 60 higher education students, in disciplines related to the geospatial industry, the Geospatial Student Accelerator scheme will make awards totaling £30,000 in the first year.
Micro-scholarships aim to help a larger number of Black and mixed Black heritage students. Geoawesomeness’ Nikita Marwaha Kraetzig spoke with Thelma Onyeka, Founder and Chair of Akama Fund, to find out more about empowering the next generation of changemakers:
Thanks for joining us, Thelma! We know that Akama Fund is personal to you, could you share more about why that is and what Akama Fund means to you?
Thanks so much for having me! You may be wondering where the name Akama comes from. It has a deep meaning for me. It’s named after my father who was orphaned as a child and raised by a tiny village in Nigeria. Thanks to the support of this village, he was able to attain a Commonwealth scholarship and higher education in the UK and succeed, changing his life and my own. His name means ‘the village is behind you’. So, if the problem statement is that it takes a village, we are building a village of millions of students like my father around the world.
Akama Fund is a network of philanthropists who believe that when you invest in a student, you’re investing in our collective future. Could you share some examples of the youth education and financial inclusion impacts your team has made?
One of the most significant strides we’ve made with the Akama Fund is our commitment to listening to the voices of hundreds of students, conducting primary research to understand their unique challenges. Our platform is built upon this foundation of empathy, addressing the specific needs of our beneficiaries. Shockingly, 40% of these students reported struggling to locate funding opportunities, and even those who do often face daunting and discouraging application processes. Many perceive scholarships as inaccessible, reserved for the elite, leading to feelings of unworthiness and marginalization.
Our proudest achievement lies in our proactive approach to tackling these obstacles head-on. Through rigorous testing of user experience, we’ve identified and implemented solutions to streamline the application process and dispel misconceptions about scholarship accessibility. Furthermore, the overwhelming support we’ve received from both companies and individuals underscores the widespread recognition of the systemic challenges within scholarship systems. We will give away 10s of 1000s of funding this year through this system.
Additionally, we’re immensely fortunate to collaborate with a dedicated team of Computer Science students from the University of Illinois Urbana as part of the Hack4Impact program. Their firsthand experience with these challenges ensures that our platform’s next iteration will be even more effective in addressing the needs of our beneficiaries.

Congratulations on the newly launched Geospatial Student Accelerator Scheme! What are you hoping to achieve through the scholarship and how can it support students in achieving their dreams in the geospatial industry?
Thank you! Esri UK’s goal for this scheme resonates deeply with our mission: they care about the journey of each student, envisioning a future where students they support through it go on to lead and innovate in the geospatial sector.
Through this partnership, we have been able to expand our impact exponentially, moving beyond initial funding limitations to establish micro-scholarships that address the holistic needs of students.
Our program offers structured mentorship, funding for essential field equipment, and access to geospatial influencers who share their insights and experiences. Through these initiatives, Akama aims to redefine scholarship support for the next generation of geospatial professionals, empowering students to navigate and shape their careers with confidence and resilience in an industry that they see is investing in them.
To create the scholarship, Akama Fund has partnered with Esri UK, a global leader in geographic information system (GIS) software. Why is this partnership so significant?
The partnership between Akama Fund and Esri UK holds significant importance for several reasons. Firstly, Esri UK’s market leader status not only lends credibility to our scholarship program but also underscores their commitment to diversifying the geospatial industry.
From the outset, Esri UK has shown genuine enthusiasm and dedication towards our shared goal of empowering students in the geospatial field. Their receptiveness to our student insights and willingness to adapt have been instrumental in shaping the program’s evolution from more traditional funding model to something that is better fit for today’s student population.
Esri UK’s support sends a powerful message to our beneficiaries – that their experiences and success matter, and that the industry is invested in their growth and development.
The geospatial industry has a long way to go, as well as many others, to be a more inclusive place where students from all backgrounds can reach their full potential and access the right opportunities. What impact does simplifying access to scholarships have on both industries themselves and the world in a broader sense?
The challenge for so many students who don’t have financial backing, is finding the time to get support.
Students from underrepresented backgrounds face compounding challenges. Beyond the overarching burden of the cost-of-living crisis (as of 2023, 41% of students have contemplated leaving because of financial concerns in the UK), they grapple with uncertainty about their career prospects. The daunting question of ‘Will this lead to a job?’ looms large, compounded by the difficulty in accessing additional funding without any social connections within the industry.
And that’s just part of the dilemma that Akama Fund is here to fix. For companies. How do I get the right talent with the right skills I need to address very complex and challenging business problems? Have we got enough people skilled in this sector and in this country to drive our ambition?
Akama Fund is really addressing this in a win-win way. Students see our platform as accessible, so more are willing to engage. They can quickly see where they are valued earlier on and get to know industries and companies who care. What we are saying is go where you are valued, so that companies know if they aren’t making it easier for the student, they will go elsewhere.
We believe that we’re redefining this dynamic between students and industry.
I’m a big believer that representation matters and ‘you can’t be what you can’t see’. With that in mind, what are the ripple effects of helping students pursue a fulfilling career and helping generations after them achieve the same?
Absolutely, the lack of representation exacerbates students’ sense of isolation, particularly for those from poorer backgrounds. Access to relevant work experiences and industry-aligned education is crucial for their professional development, yet these opportunities often remain elusive amidst constraints to work in a job that helps them make ends meet.
To answer your question: Representation matters for who students see as the givers and how they perceive that relationship dynamic. I believe companies are giving forward not back. These are their future innovators and customers.
Our philanthropists and micro-philanthropists come from everywhere. We are democratizing endowments so that anyone with funds can easily start a scholarship, diversifying what is portrayed as being generous. This is incredibly important. The platform is a cross-generation network of students and philanthropists, transforming the scholarship process by empowering students and supporters to connect, collaborate and invest in education.
Lastly, how can students interested in careers in the geospatial industry apply to the Geospatial Student Accelerator?
Amazing question! They can apply for the Geospatial Student Accelerator here: https://akamafund.org/esriukaccelerator/. We have of course made the application very straightforward to complete! It takes 2 minutes!!