
In recent days the news is full of information about disasters occuring on our globe. Scientists are wondering how to reduce the impact of such events, coming up with disaster management. However, to create a disaster plan some 3D data is required. Unfortunately, possible solutions for 3D reconstruction have their faults. The lidar method may be too expensive, whereas satellite optical data struggles with cloud cover issues. Satellite radar data instead may be a good alternative for other techniques, especially when it’s combined with AI tools. Thanks to this unique combination outstanding products can be designed, for example 3D City Maps.
Presenting SAR2Height
A true revolution was developed by Aerospace engineers at the University of the Bundeswehr Munich, combining radar data and AI. Professor Michael Schmitt and Michael Reclastarted acquired SAR images from German TerraSAR-X and high resolution height maps, based on airborne laser scanning, to carry out a training of deep neural network.
As Schmitt says: “The results were amazing. We trained our model purely on TerraSAR-X imagery, but out of the box it works quite well on imagery from other commercial satellites.” What about the accuracy? This model is able to predict the height component of the building with an accuracy of several meters.
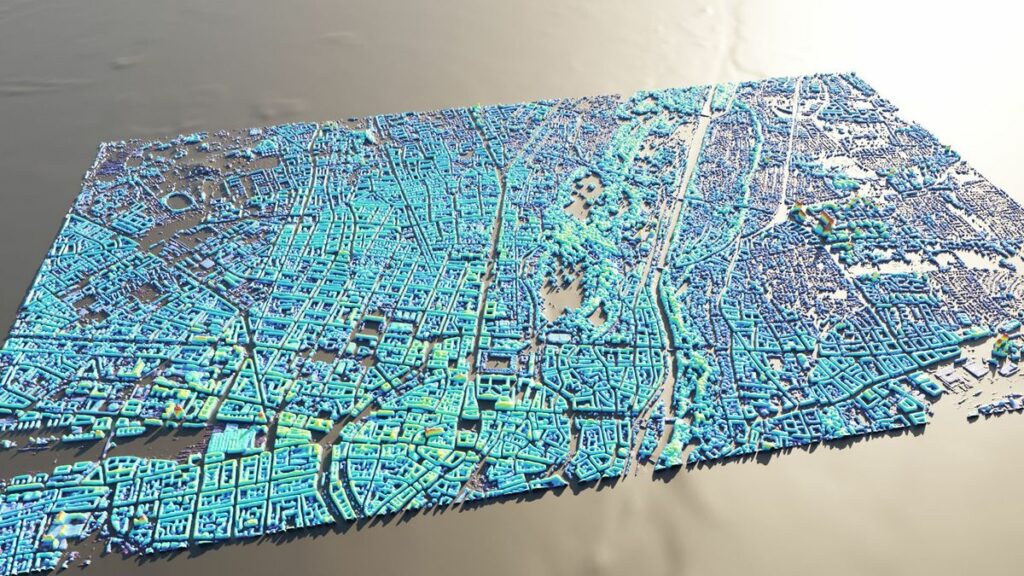
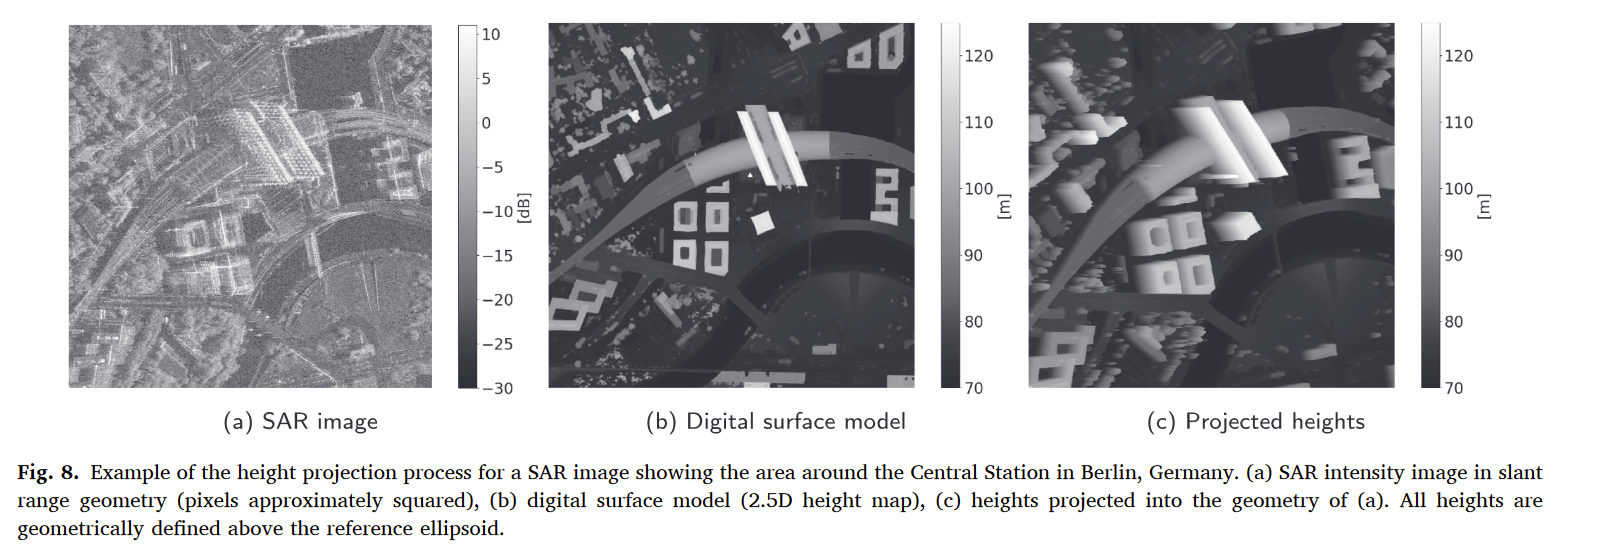
The image below shows a difference between the 2D radar image and 2.5D Digital Surface Model with 0.5m resolution. Combined together, they show a 3D visualization of the city, which looks truly impressive.
From radar image to 3D vizualization. Source: Research Gate
AI solution taming earthquakes
The SAR2Height model is hoped to be a tool for predicting building damages, particularly in case of an earthquake. The vivid example, how useful SAR2Height can be at the present time, is the recent earthquake at an extremely short distance from New York City on 5th of April 2024. It’s a matter of time before we probably see a 3D visualization of the NY’s earthquake aftermath.
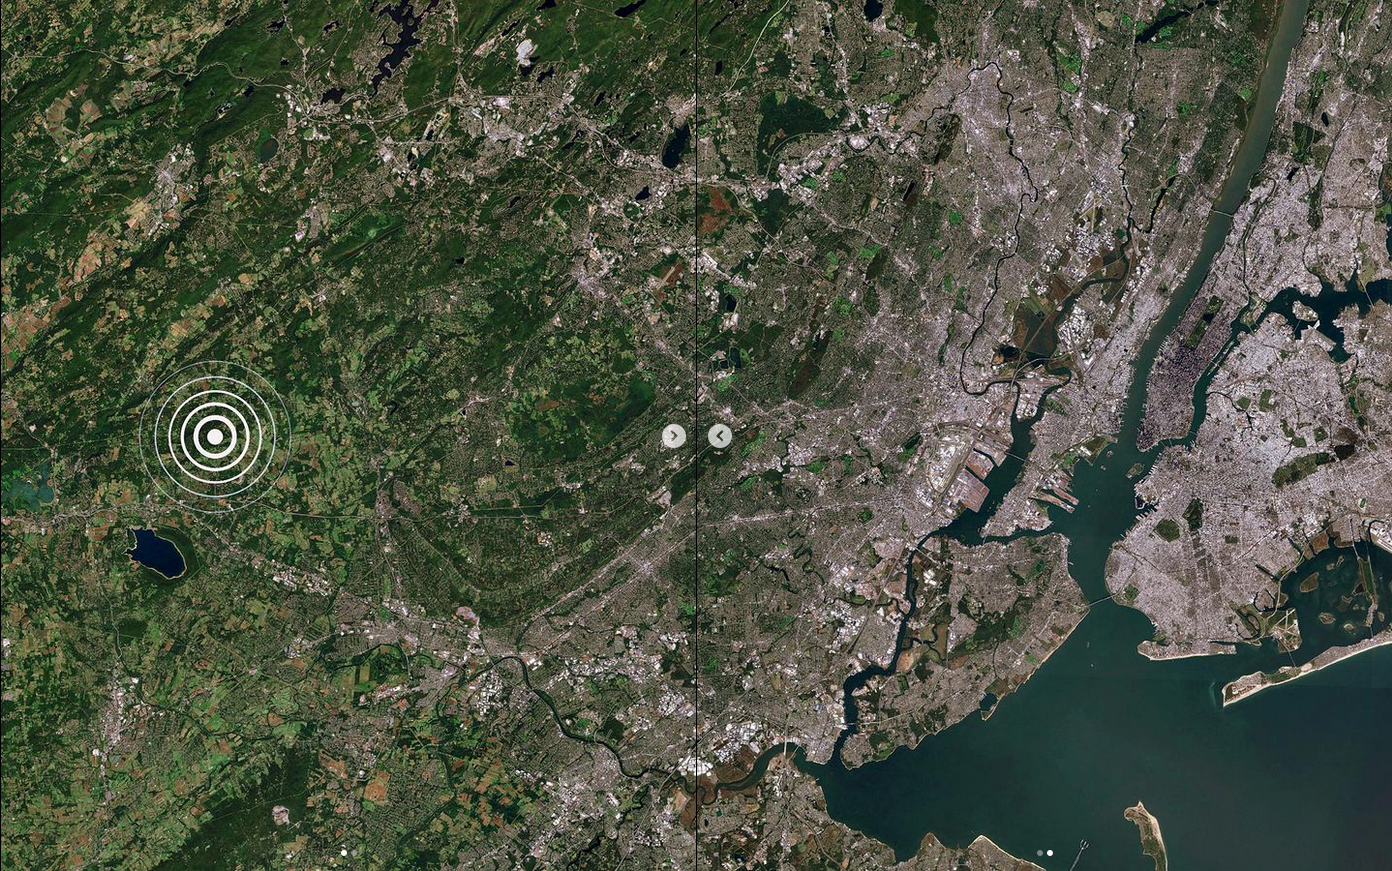
Earthquake near New York City, 05.04.2024. Source: Daily Overview
In a chase of perfection
This solution, however, is not without drawbacks. There are some issues like Radar Image Distortions. One of them is a radar layover. It’s a situation where a radar signal reaches high objects. Difference between return signals from the top point (B) and the bottom point (A) causes a deformation of the final result and 3D relations.
Radar layover. Source: Natural Resources Canada
Additionally, at the moment not every European or North American city possesses periodic lidar datasets needed for neural network training. It is often said that governments flying missions have too slow revisit cycles and it’s regrettable that projects like SAR2Height are not supported.
SAR2Height is constantly learning. As Mr. Schmitt highlights, his method is not as accurate as classical methods, but still, it’s better than nothing. Especially when it comes to developing an urgent plan for disaster response.
In conclusion, this research opens new possibilities for topographic reconstruction and enhances the potential for remote sensing applications that require rapid, weather-independent observations. The approach benefits established radar techniques by offering an understanding of terrain, which is valuable for SAR data tasks like phase unwrapping or cross-modal image registration.
Source: Research Gate

#Ideas

Next article
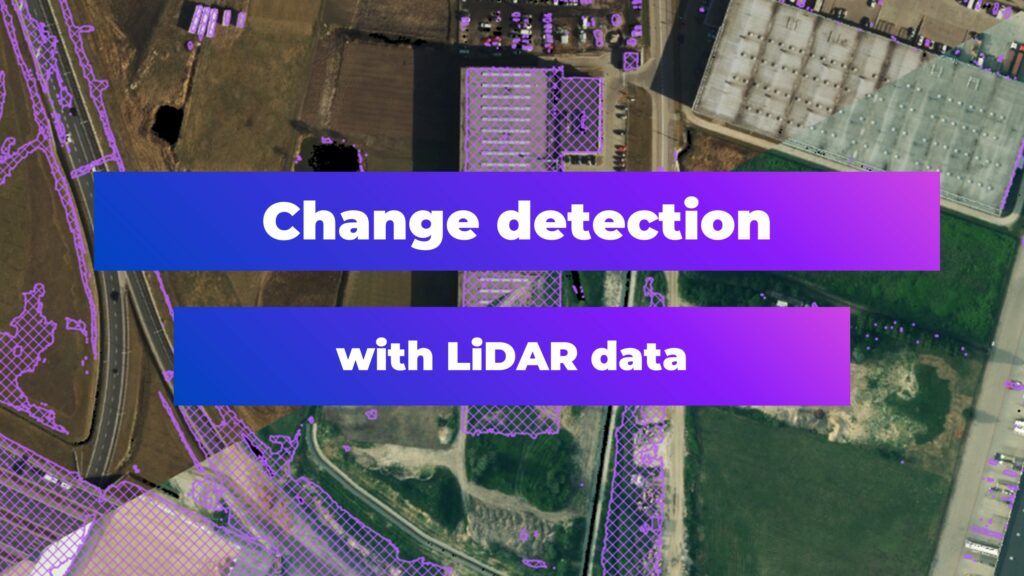
LiDAR, short for Light Detection and Ranging, has revolutionized the way we capture and interpret the physical world around us. This Earth observation technology uses light in the form of a pulsed laser to measure distances to the Earth, creating precise three-dimensional information about the shape and surface characteristics of the terrain. Among its various applications, LiDAR is particularly proficient at change detection in landscapes over time, offering insights with remarkable detail.
Focusing on the specific application of change detection, LiDAR technology stands out for its ability to generate RGB visualizations with resolutions as fine as 0.1 meters. Using UAV-based pointclouds this resolution may reach even 1 centimeter. By comparing these high-resolution maps over different periods, it is possible to visually recognize alterations in the landscape.
LiDAR technology: pros and cons
Despite the capabilities of LiDAR technology in detecting landscape changes with high precision, it’s important to acknowledge certain disadvantages. LiDAR data collection can be significantly more expensive than other methods due to the equipment and processing power required. The technology also faces limitations: weather conditions or dense vegetation coverage, which can obstruct the laser pulses and lead to gaps in data or reduced accuracy.
Additionally, another noteworthy limitation of LiDAR technology is the non-cyclic nature of its measurements. Unlike some other remote sensing technologies that can capture data at regular intervals (e.g. satellite imagery taken at predetermined times), LiDAR data collection typically occurs as discrete projects or surveys. This means that the intervals between data collection efforts can vary widely and are often dictated by specific project needs, budget constraints, or accessibility to the area of interest. This sporadic approach can make it challenging to monitor changes consistently over time, particularly for applications that require regular updates to track dynamic environmental or urban developments.
Despite these challenges, the advantages of LiDAR technology are profound and wide-ranging, particularly in its application to change detection and landscape analysis. One of the key strengths of LiDAR is its classification capabilities, which allow for the separation between various types of objects and features on the Earth’s surface, such as buildings, vegetation, and water bodies. Moreover, LiDAR is appreciated for its relatively high accuracy, often reaching within a few centimeters. Another significant advantage is LiDAR’s ability to produce 3D visualizations of the Earth’s surface. The depth of detail and perspective gained through 3D visualization aids in a more comprehensive understanding of spatial relationships and changes.
Change Detection in practice
When leveraging LiDAR technology for change detection or landscape analysis, accessing quality data is crucial. Fortunately, a growing number of data sources, like USGS 3D Elevation Program (3DEP), are available on the internet, offering LiDAR datasets for various locations worldwide. However, the key to successful analysis lies in finding two datasets that cover the same area of interest but from different time periods.
A case study from Warsaw, Poland, highlights the power of LiDAR in documenting urban transformation between 2012 and 2018. The technology effectively identified the emergence of new buildings and embankments, showcasing the city’s dynamic growth. A fascinating aspect of LiDAR’s capability is its precision in detecting even cars in parking spots, illustrating the technology’s sensitivity to detail.
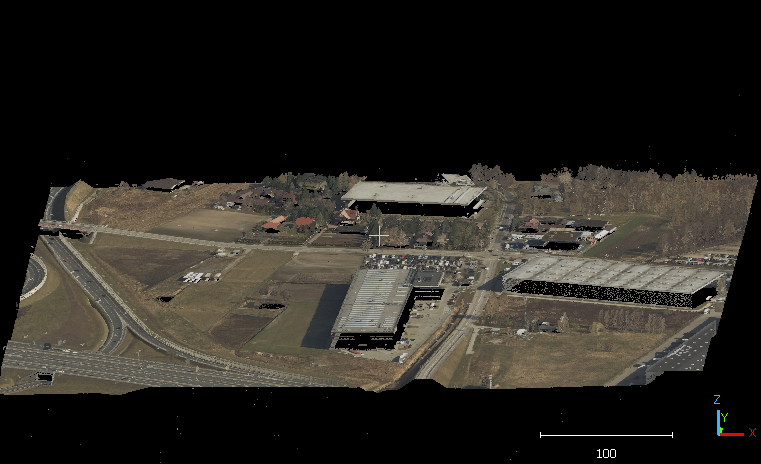
Case-study. RGB map visualization. Change detection in Warsaw, 2012-2018
Case-study. RGB map visualization. Change detection in Warsaw, 2012-2018
The sample method for detecting landscape changes with LiDAR can involve several steps:
- Creating height maps
Height maps serve as a foundational layer representing the terrain’s elevation. They are called Digitial Surface Models (DSMs).
- Raster differencing methods
These are employed to identify changes between different time periods. It’s worth noting that the choice of software and algorithms can lead to slightly varied results, underscoring the importance of selecting the appropriate tools for analysis.
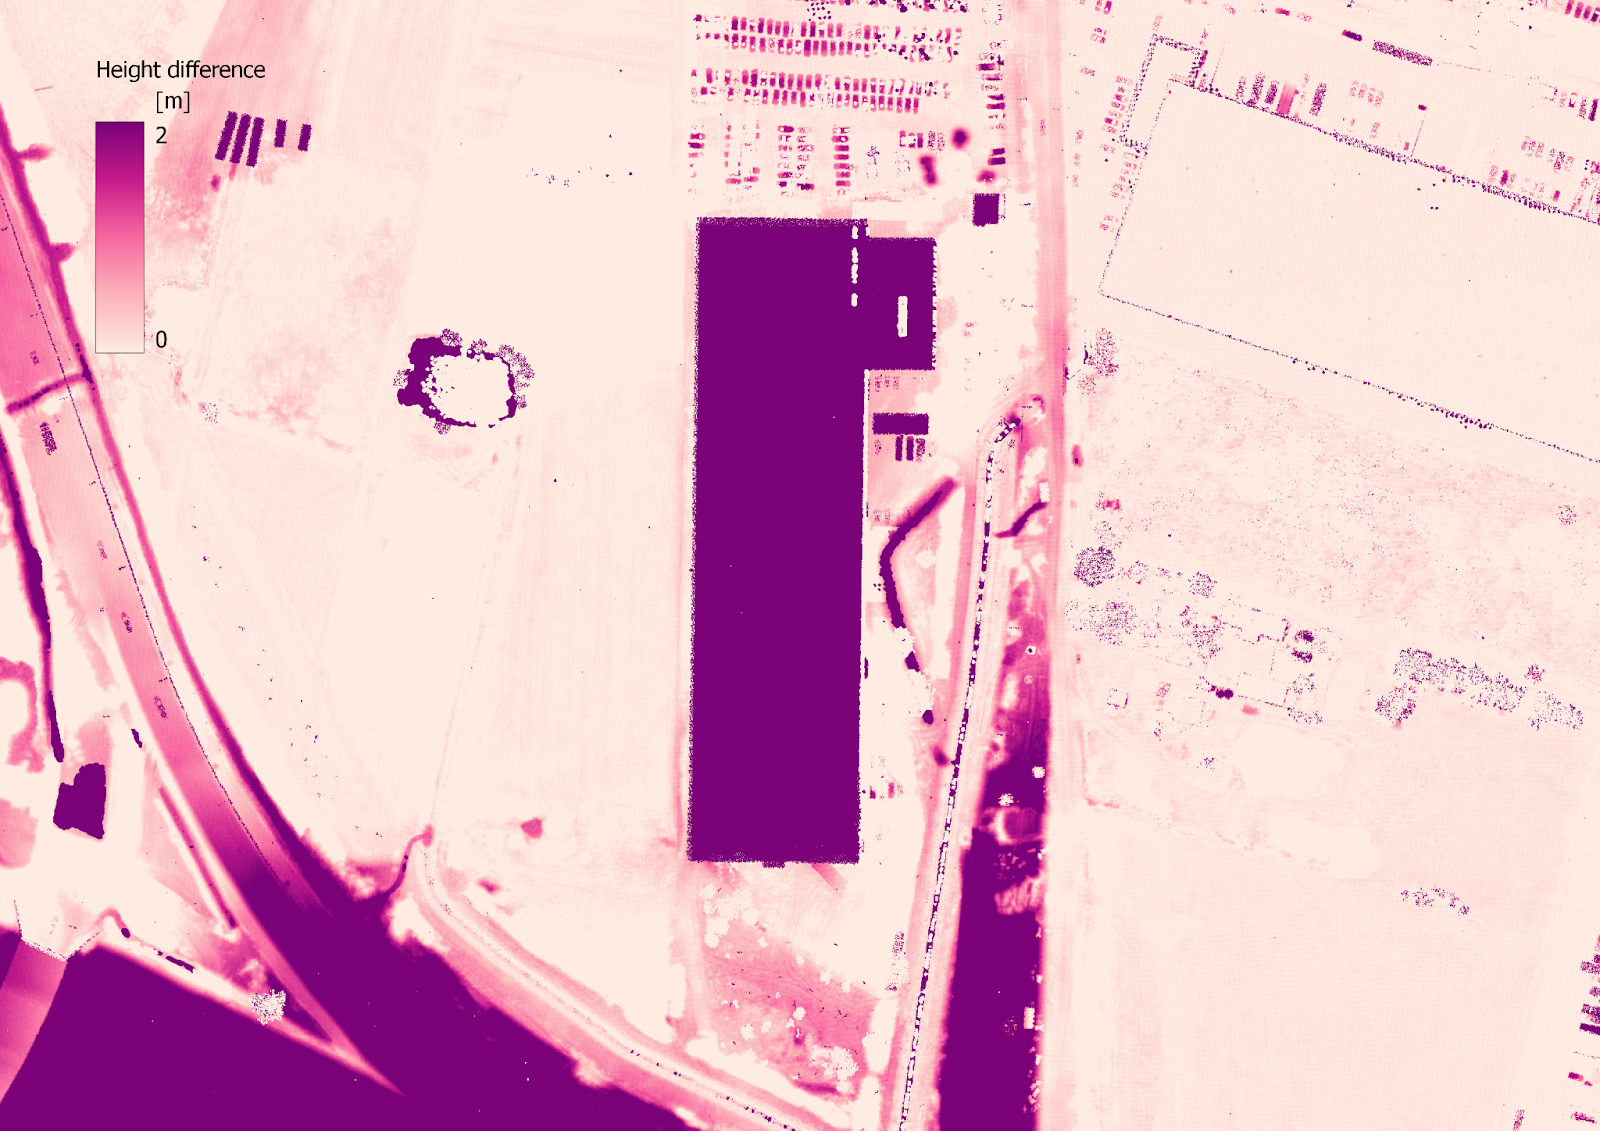
Case-study. Output of raster differencing
- Using queries to define changes
Queries help in filtering and pinpointing specific alterations within the landscape.
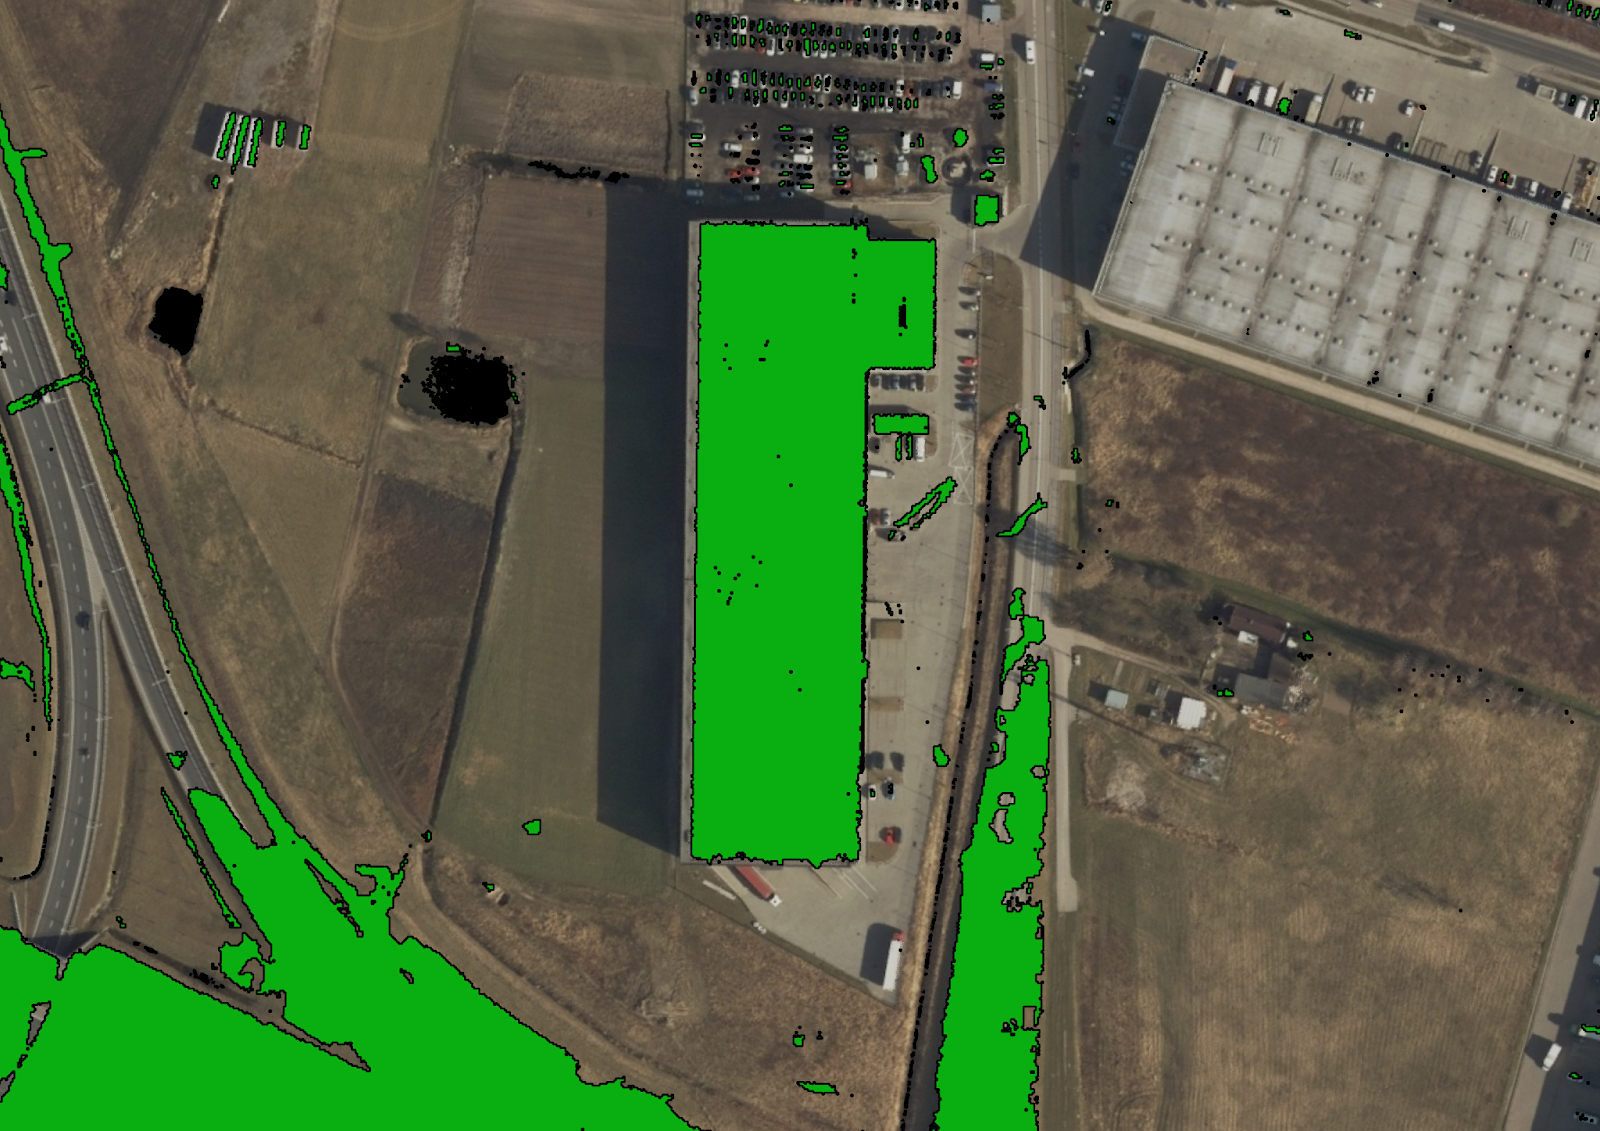
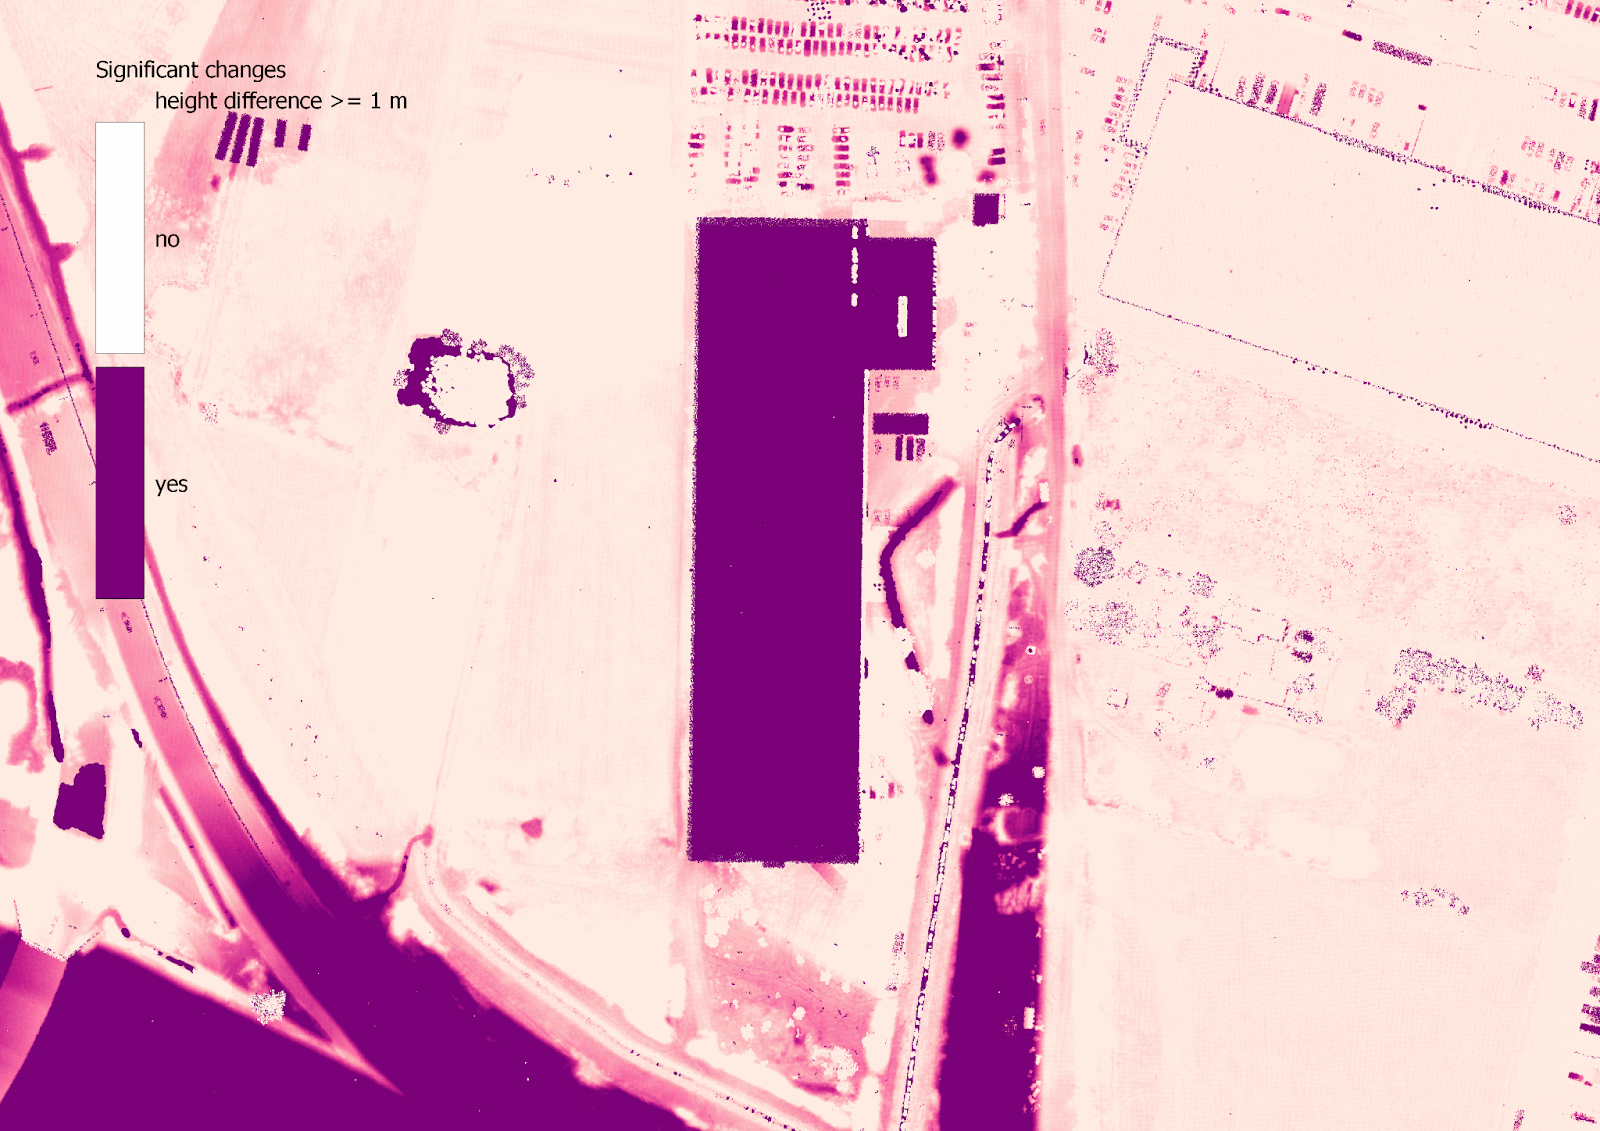 Case-study. Example of raster query: height difference >= 1 m
- Creating vector maps from raster
It involves converting the rasterized changes into vectorized forms for easier interpretation and analysis.
Case-study. Final result – vector map
Conclusions
The conclusions drawn from utilizing LiDAR for change detection in landscapes like Warsaw reveal the technology’s high accuracy, often to several centimeters. This precision facilitates not only the mapping of large-scale urban developments but also the identification of smaller, detailed changes that might go unnoticed by other means. LiDAR’s contribution to understanding and documenting environmental and urban shifts is invaluable, offering a lens through which we can observe the dynamics of our changing world.
Did you like the article? Read more and subscribe to our monthly newsletter!