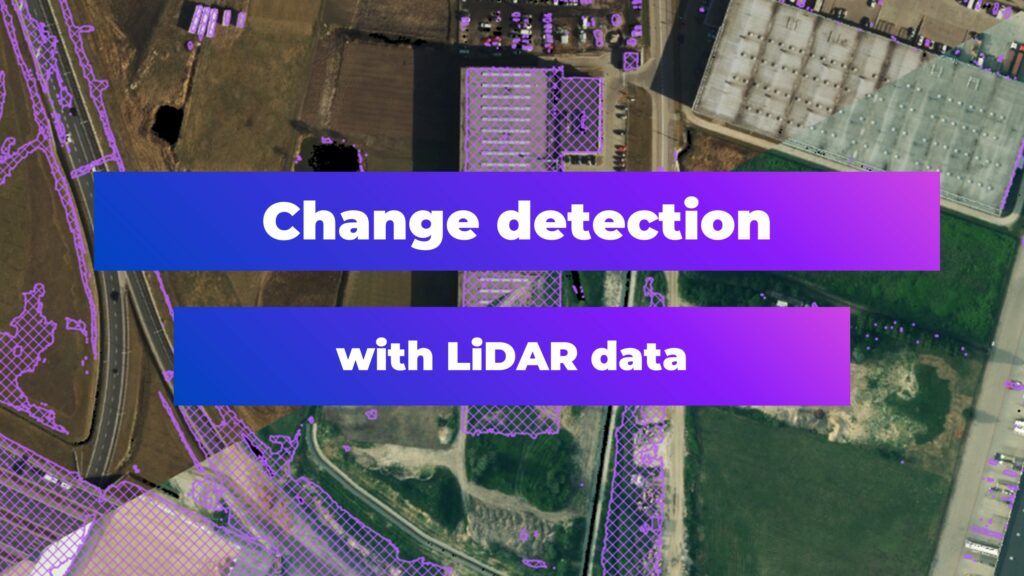

LiDAR, short for Light Detection and Ranging, has revolutionized the way we capture and interpret the physical world around us. This Earth observation technology uses light in the form of a pulsed laser to measure distances to the Earth, creating precise three-dimensional information about the shape and surface characteristics of the terrain. Among its various applications, LiDAR is particularly proficient at change detection in landscapes over time, offering insights with remarkable detail.
Focusing on the specific application of change detection, LiDAR technology stands out for its ability to generate RGB visualizations with resolutions as fine as 0.1 meters. Using UAV-based pointclouds this resolution may reach even 1 centimeter. By comparing these high-resolution maps over different periods, it is possible to visually recognize alterations in the landscape.
LiDAR technology: pros and cons
Despite the capabilities of LiDAR technology in detecting landscape changes with high precision, it’s important to acknowledge certain disadvantages. LiDAR data collection can be significantly more expensive than other methods due to the equipment and processing power required. The technology also faces limitations: weather conditions or dense vegetation coverage, which can obstruct the laser pulses and lead to gaps in data or reduced accuracy.
Additionally, another noteworthy limitation of LiDAR technology is the non-cyclic nature of its measurements. Unlike some other remote sensing technologies that can capture data at regular intervals (e.g. satellite imagery taken at predetermined times), LiDAR data collection typically occurs as discrete projects or surveys. This means that the intervals between data collection efforts can vary widely and are often dictated by specific project needs, budget constraints, or accessibility to the area of interest. This sporadic approach can make it challenging to monitor changes consistently over time, particularly for applications that require regular updates to track dynamic environmental or urban developments.
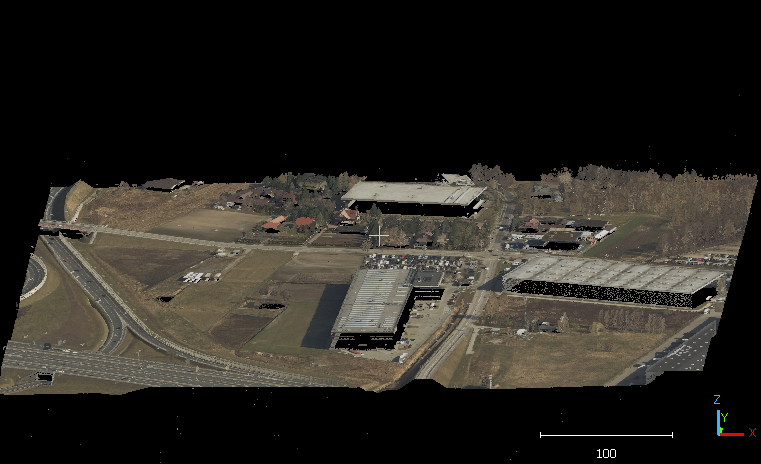
Despite these challenges, the advantages of LiDAR technology are profound and wide-ranging, particularly in its application to change detection and landscape analysis. One of the key strengths of LiDAR is its classification capabilities, which allow for the separation between various types of objects and features on the Earth’s surface, such as buildings, vegetation, and water bodies. Moreover, LiDAR is appreciated for its relatively high accuracy, often reaching within a few centimeters. Another significant advantage is LiDAR’s ability to produce 3D visualizations of the Earth’s surface. The depth of detail and perspective gained through 3D visualization aids in a more comprehensive understanding of spatial relationships and changes.
Change Detection in practice
When leveraging LiDAR technology for change detection or landscape analysis, accessing quality data is crucial. Fortunately, a growing number of data sources, like USGS 3D Elevation Program (3DEP), are available on the internet, offering LiDAR datasets for various locations worldwide. However, the key to successful analysis lies in finding two datasets that cover the same area of interest but from different time periods.
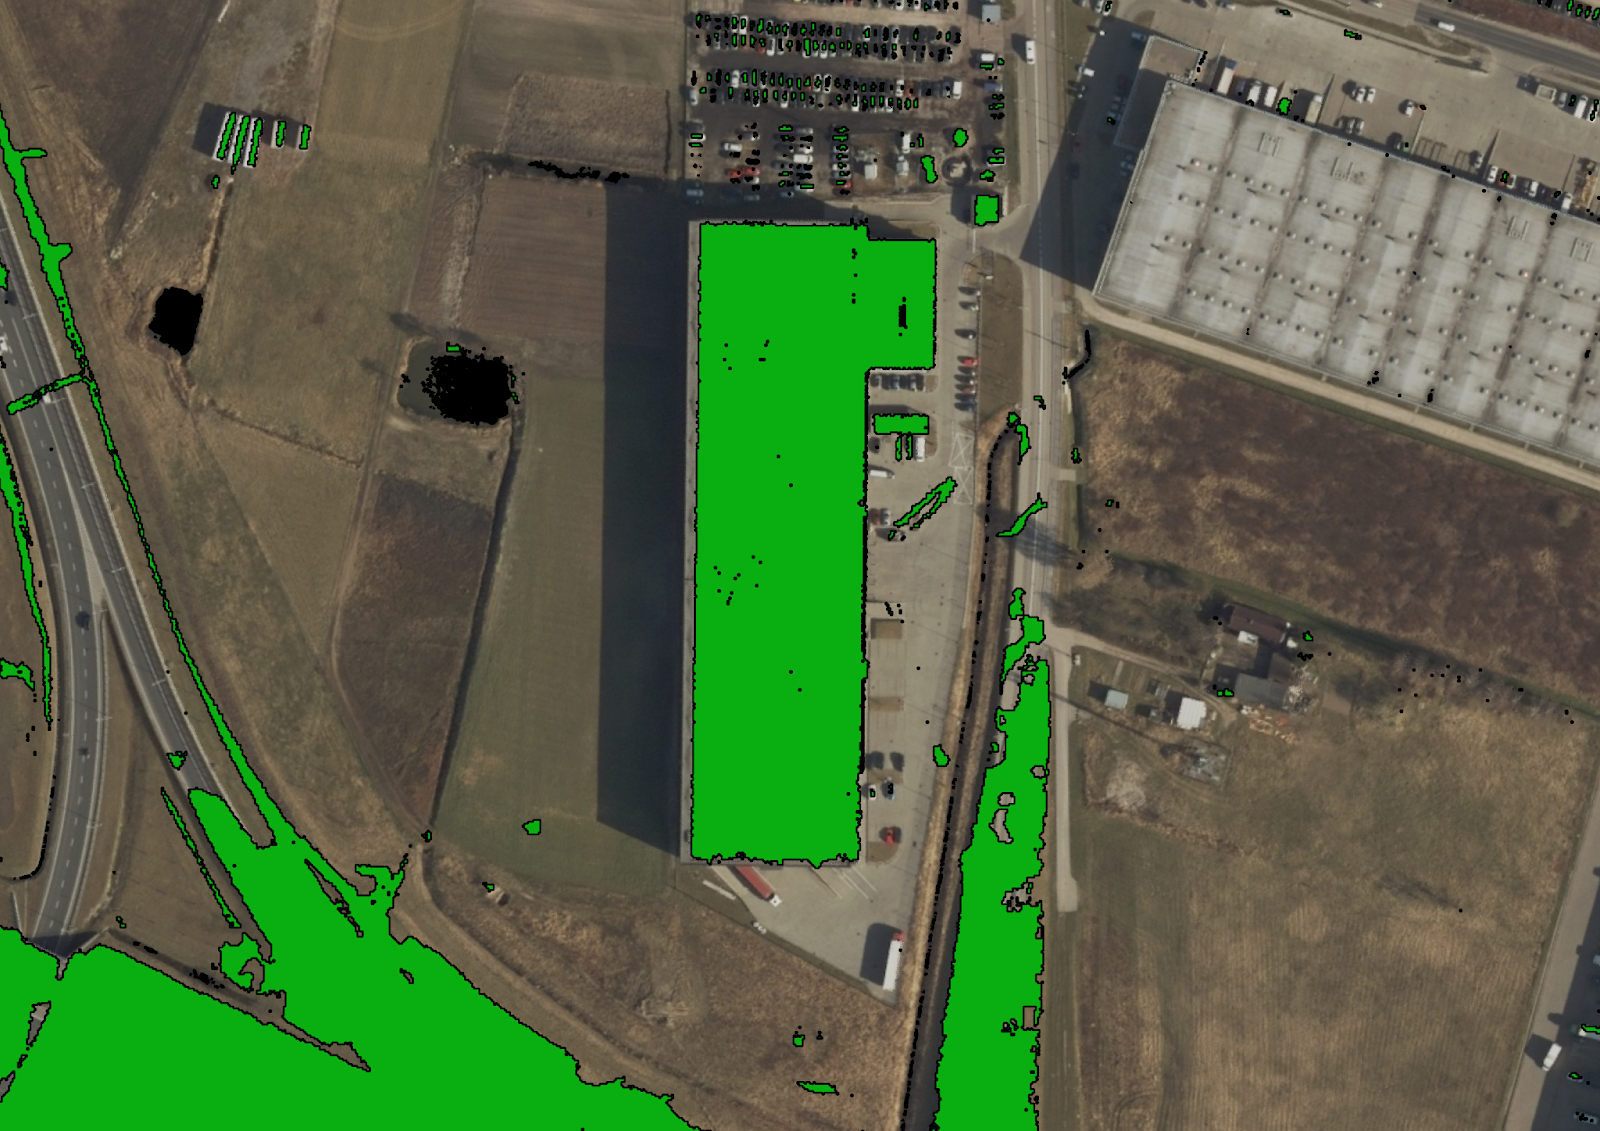
A case study from Warsaw, Poland, highlights the power of LiDAR in documenting urban transformation between 2012 and 2018. The technology effectively identified the emergence of new buildings and embankments, showcasing the city’s dynamic growth. A fascinating aspect of LiDAR’s capability is its precision in detecting even cars in parking spots, illustrating the technology’s sensitivity to detail.
Case-study. RGB map visualization. Change detection in Warsaw, 2012-2018
Case-study. RGB map visualization. Change detection in Warsaw, 2012-2018
The sample method for detecting landscape changes with LiDAR can involve several steps:
- Creating height maps
Height maps serve as a foundational layer representing the terrain’s elevation. They are called Digitial Surface Models (DSMs).
- Raster differencing methods
These are employed to identify changes between different time periods. It’s worth noting that the choice of software and algorithms can lead to slightly varied results, underscoring the importance of selecting the appropriate tools for analysis.
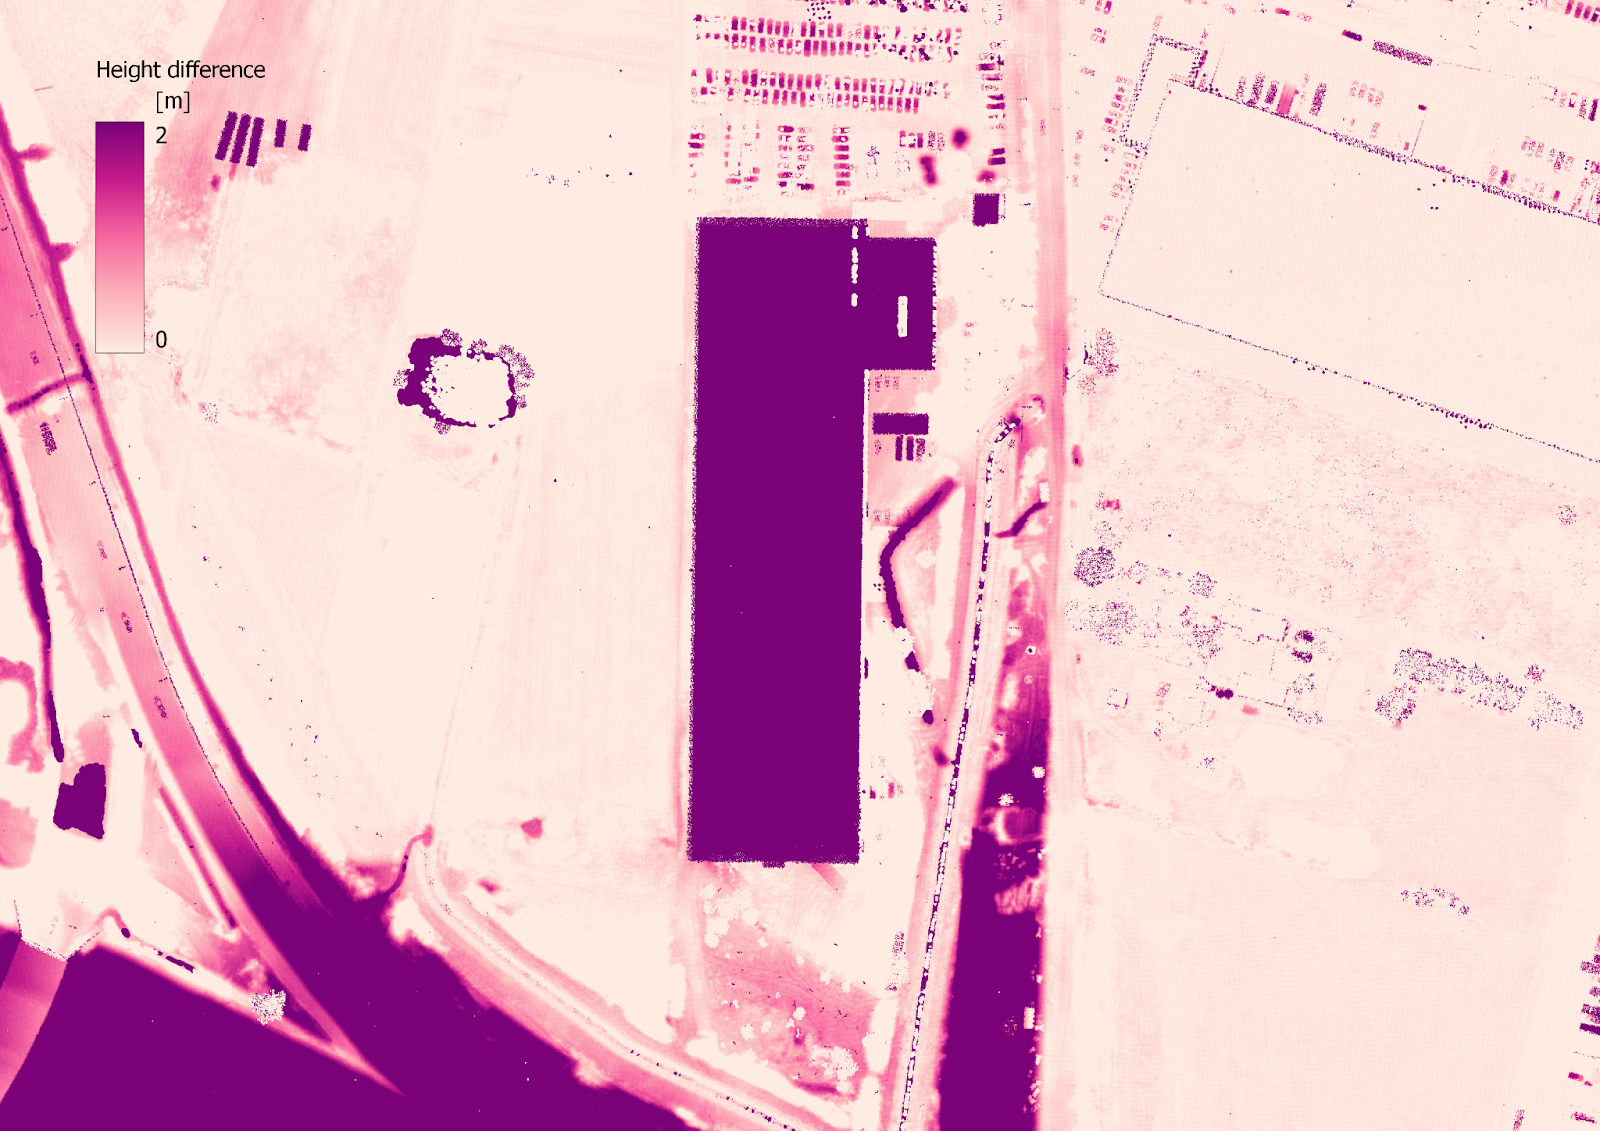
Case-study. Output of raster differencing
- Using queries to define changes
Queries help in filtering and pinpointing specific alterations within the landscape.
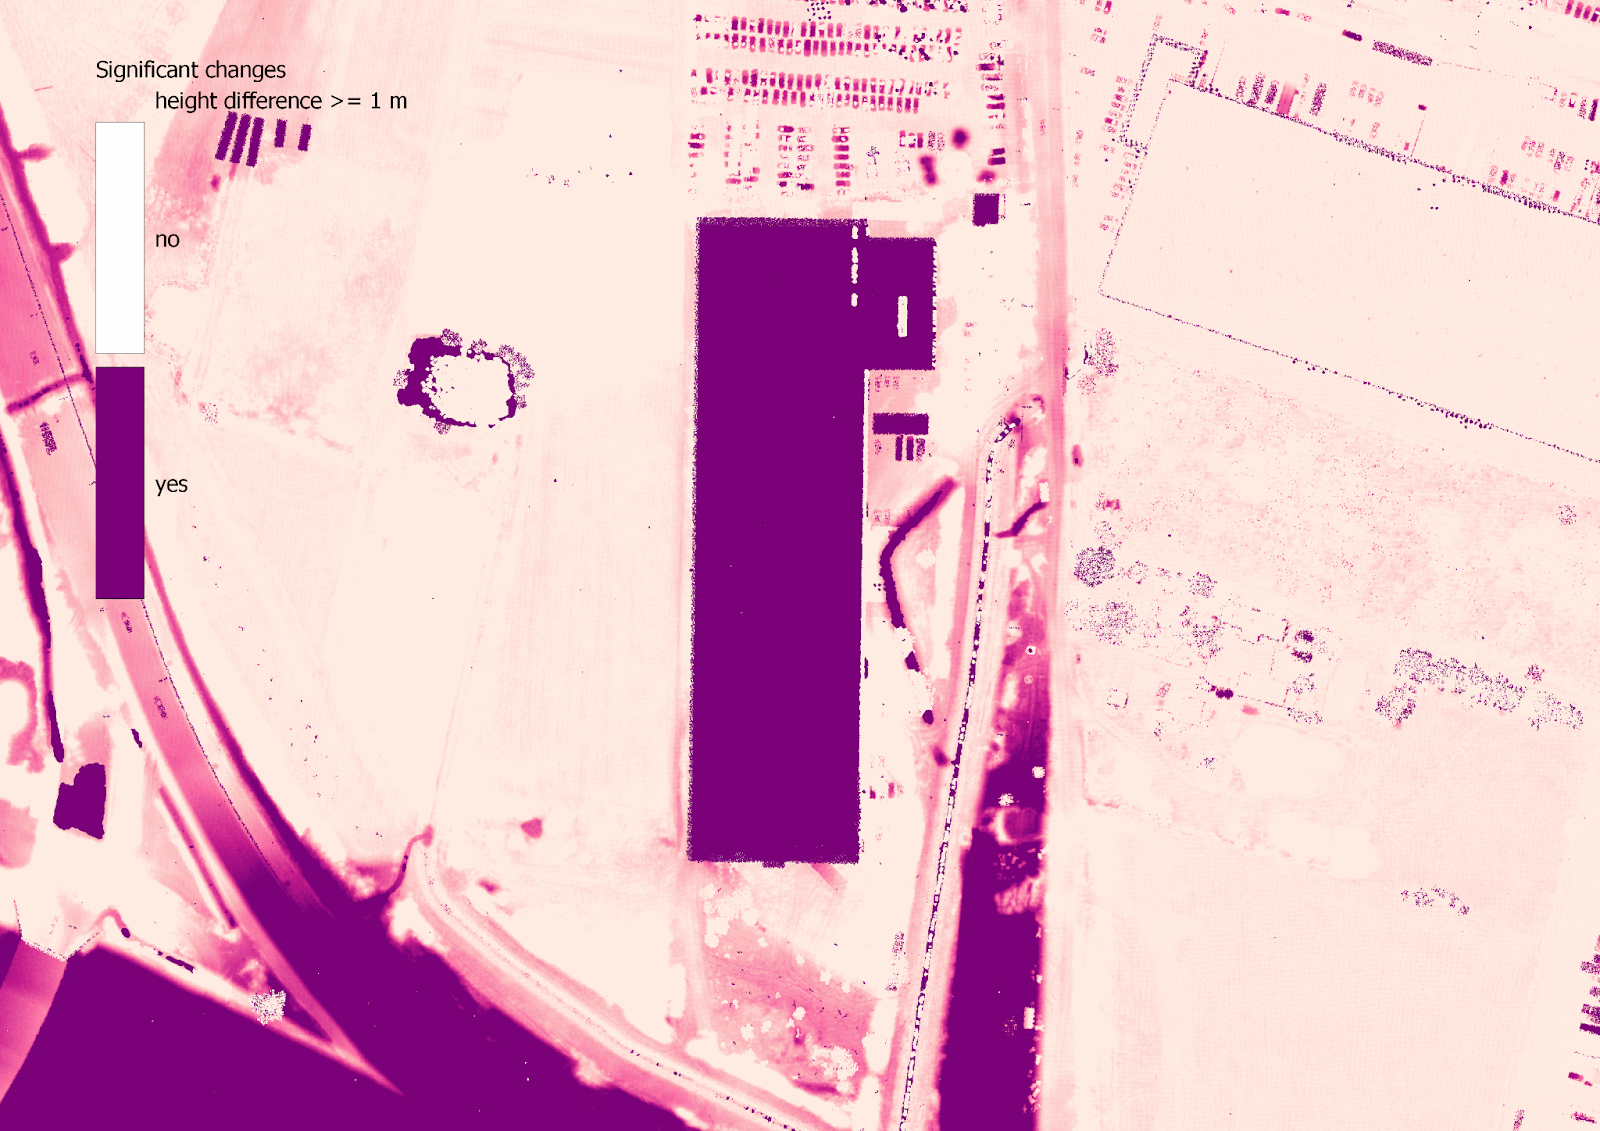 Case-study. Example of raster query: height difference >= 1 m
- Creating vector maps from raster
It involves converting the rasterized changes into vectorized forms for easier interpretation and analysis.
Case-study. Final result – vector map
Conclusions
The conclusions drawn from utilizing LiDAR for change detection in landscapes like Warsaw reveal the technology’s high accuracy, often to several centimeters. This precision facilitates not only the mapping of large-scale urban developments but also the identification of smaller, detailed changes that might go unnoticed by other means. LiDAR’s contribution to understanding and documenting environmental and urban shifts is invaluable, offering a lens through which we can observe the dynamics of our changing world.
Did you like the article? Read more and subscribe to our monthly newsletter!

#Fun

Next article
One of the main applications of satellite imagery is land cover classification. Thanks to the high frequency of satellites passing over the earth’s surface, it’s possible to monitor land use in real time. What are land classification maps used for? Land classification maps are useful for a variety of purposes across different fields such as agriculture, urban planning, environmental management, and more. Land Cover Classification can be performed using optical and radar imagery. Both of these source datasets have their pros and cons. However, as resources become more available, comparisons between these two satellite products can be presented.
How does land classification work?
A land use class connected with satellite classification refers to a categorization of the Earth’s surface based on the types of human activities and natural features observed from satellite imagery. This classification system organizes land use into distinct categories, such as residential areas, agricultural land, forests, water bodies, and urban infrastructure, enabling the analysis of spatial patterns and changes over time using satellite data. Each land use class seen by a satellite has different characteristics. Specific features relevant to the type of land classification are selected based on the spectral properties of different land cover types. For example, vegetation can be distinguished from water bodies based on their different responses in the infrared part of the spectrum. This all means that the rebound intensity of a given object is important to determine land class. These parameters affect the values encoded in individual bands. For optical satellite imagery, sample bands are Red, Green, Blue, or Near Red. Considering radar satellite imagery there are bands connected with intensity value – the amount of energy that returns after reflection from the ground surface.
While processing satellite images we can use two methods to classify land use: supervised and unsupervised Classification. In supervised classification, users select training samples representing specific classes and guide the classification based on these samples. This technique requires labeled training data for each class and user intervention to define classes. It often results in higher accuracy but it can be time-consuming. Whereas unsupervised classification is an automatic tool that groups pixels based on spectral similarities without predefined training data to receive a specific amount of classes. The user only decides how many classes they receive in the final result. It uses clustering algorithms to identify classes without user input, making it more flexible and great for exploratory data analysis. It may have lower accuracy but it is effective for identifying unexpected patterns.
Both methods have their pros and cons. Supervised classification is more precise and there is some control over provided data, but the whole process may take a long time to obtain the best results. If you’re in a hurry, an automatic solution may be a better option.
CORINE Land Cover – CLC
The CORINE (Coordination of Information on the Environment) Land Cover project is an initiative by the European Environment Agency that provides detailed and consistent information on land cover across Europe.
The project classifies the European landscape into 44 different land cover classes such as agricultural areas, forests, wetlands, and urban regions, based on the analysis of satellite images. This classification aids in monitoring changes in land use over time, contributing to environmental policy, planning, and conservation efforts. It provides detailed information on land use patterns and changes over time, with data available for multiple reference years such as 1990, 2000, 2006, 2012, and 2018. The CLC database is a collaborative effort and is accessible to download for free – an excellent tool if you may need it!
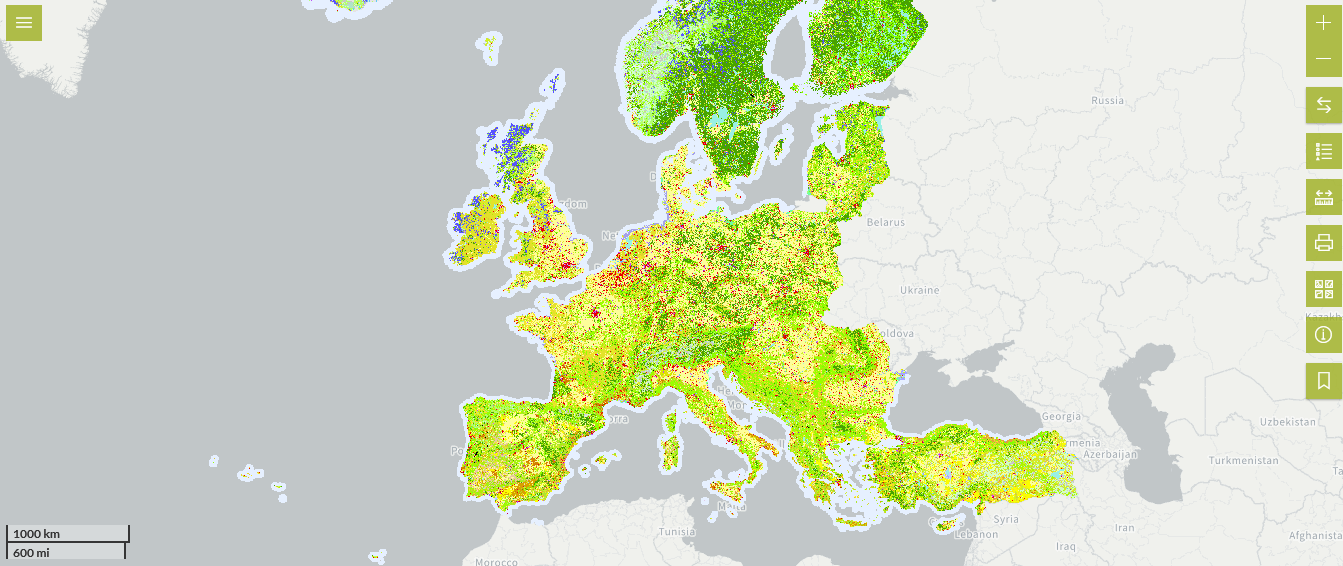
CORINE Land Cover – Looking at the EU
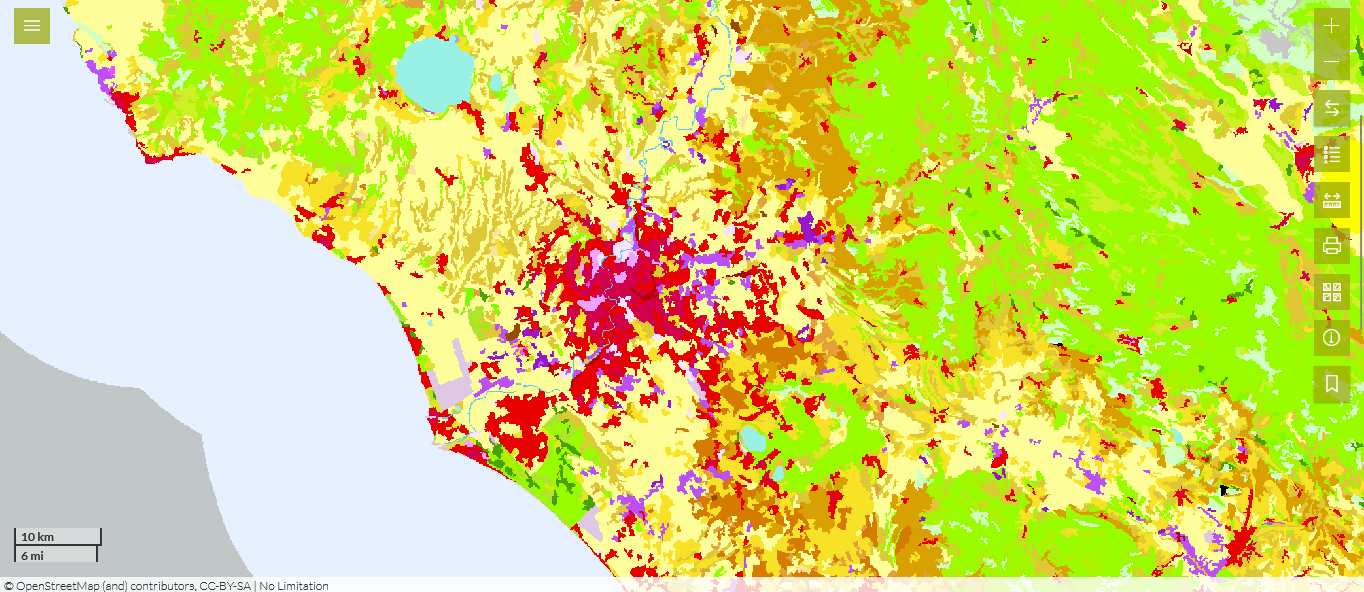
The City of Rome in the CORINE Land Cover browser
Optical data: Classification in QGIS – looking at Poland and Germany
QGIS open software is one of the most common tools to process raster or vector data. It’s also possible to install a variety of plugins, which may help implement complicated algorithms.
For land cover classification using Sentinel datasets, the best plugin is Semi-Automatic Classification Plugin (SCP). Once we gain Sentinel’s set of images, we can start processing. The person processing decides how many classes they want to obtain and then marks training fields – representations of a given class on the raster. Then they choose the algorithm i.e. Maximum Likelihood or Minimum Distance. The Maximum Likelihood Classification algorithm calculates the probability of each pixel belonging to different classes and assigns it to the class with the highest probability, hence maximizing the likelihood of the observed data given the class. Whereas the Minimum Distance algorithm computes the distance between the spectral values of each pixel and the mean spectral values of each class. The pixel is then assigned to the class with the shortest distance, hence the name “Minimum Distance.”
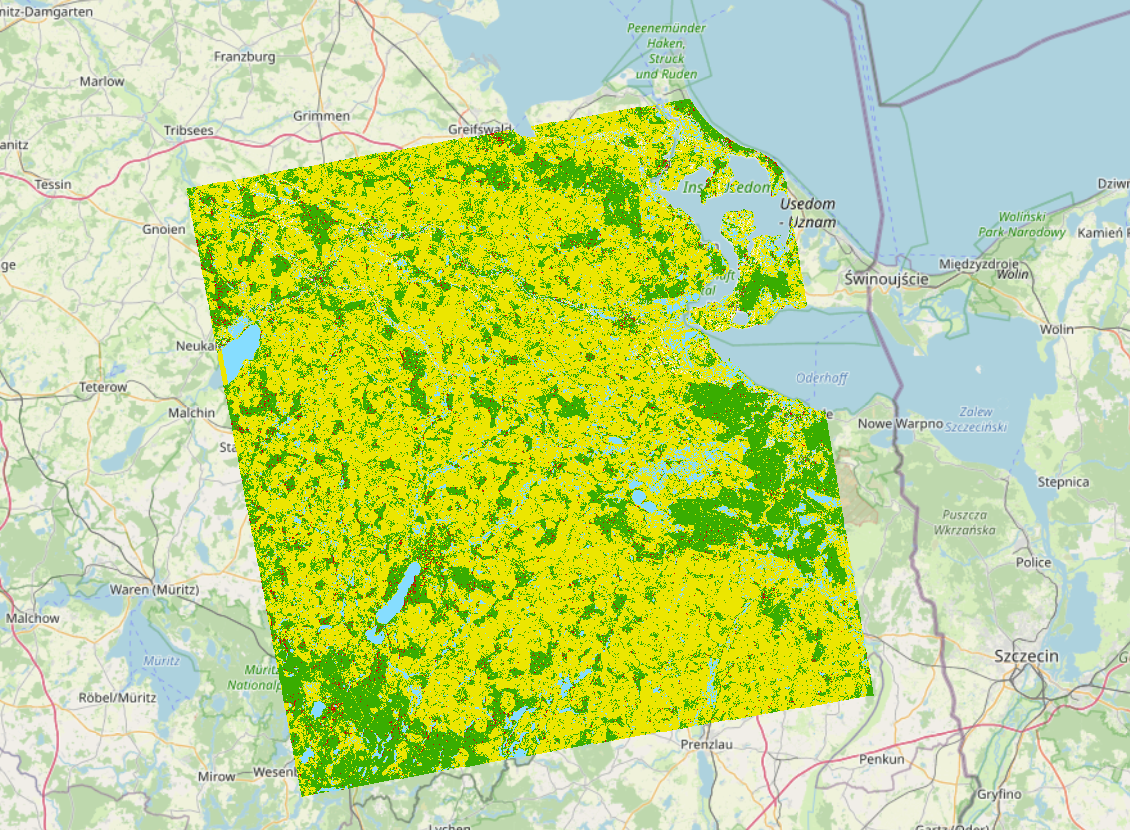
In this case study, let’s look at the historical region of Euroregion Pomerania. Divided between Poland and Germany, it has a rich history dating back thousands of years and it’s known for its diverse landscapes, including flat terrain, small rivers, and numerous lakes.
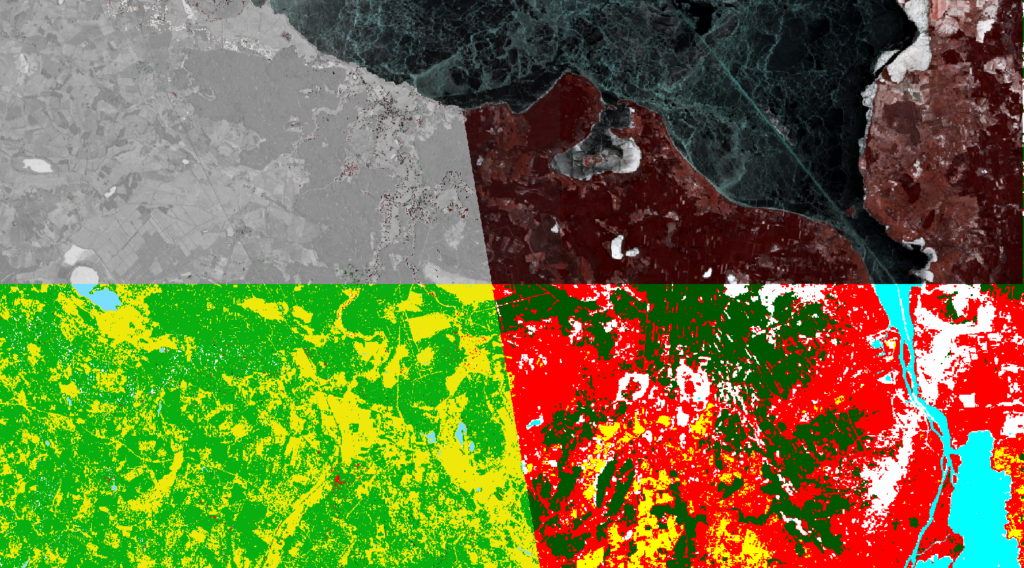
The main goal of studying this area through processing is to classify the land use with 5 macro-classes: Water, Forests, Fields, Build-up, and Snow. Due to the fact that the Sentinel image was created on 21 February 2018, there is some snow coverage across the fields. The main disadvantage of optical data, compared to radar data, is the fact that it can’t skip cloud coverage. That’s why, when looking for source images there must be a condition of maximum cloud coverage. In this case study, maximum cloud coverage was set to 30%.
After marking a couple of training fields and assigning appropriate colors, we may check our results and optionally change our training input. Once the result preview is good enough, it’s time to classify the whole image. This plugin allows user to manipulate the data, changing some parameters, algorithms or visual effects. For instance it’s possible to select 3 different bands for band combinations. RGB – the most common form – consists of the Red, Green and Blue bands.
When looking at these bands separately, the images are in grayscale, but combining these three, results in the colourful image as our eyes can see. Very useful is the combination of the bands: Near-Infrared, Red, and Green. This allows the detection of vegetation, highlighting it in red.
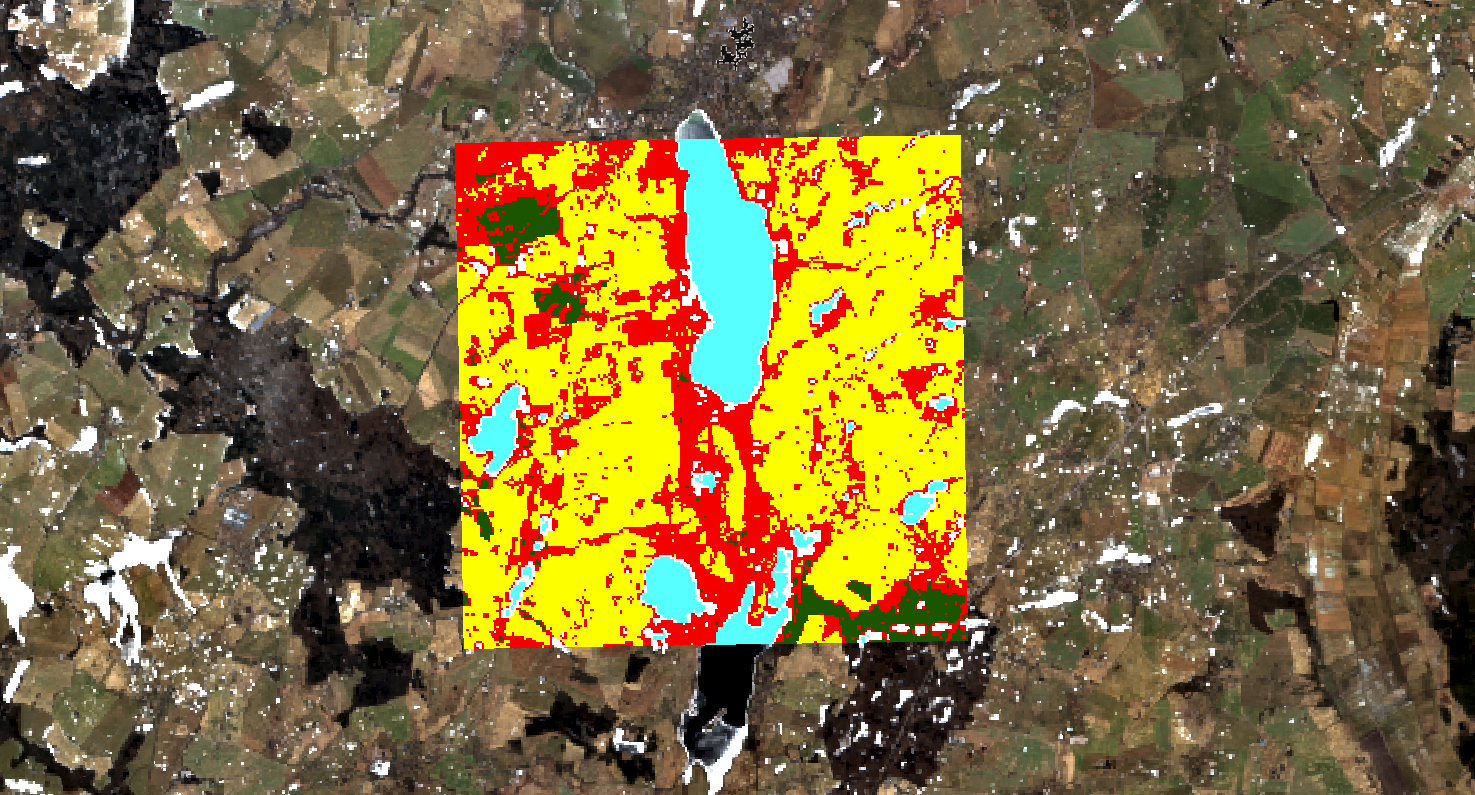
Result preview
Sentinel-2A image. Before and after classification
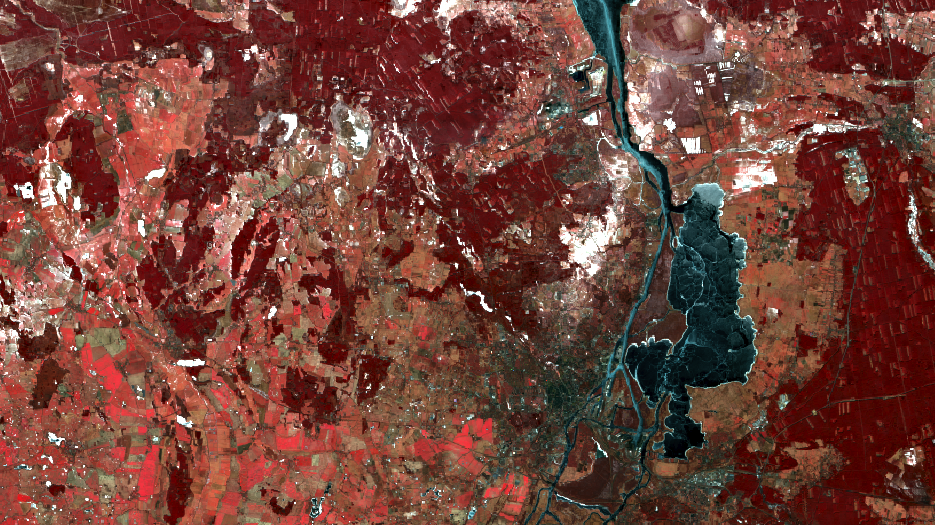
Band combination (NIR+Red+Green)
Radar data: Land Cover Classification in SNAP using SAR data
Let’s look at the historical region of Pomeria again, but this time by processing radar satellite images.
Software which can deal with the classification issue is Sentinel Application Programme (SNAP). This time, the processor has radar images at its disposal. These kinds of images differ significantly from optical images. Knowing the fact that the values of the intensity parameter depend on the terrain class, such a land use classification can be performed. The European Space Agency published a few insightful tutorials for those who are passionate about satellite technology.
Instead of colourful band combinations, when using radar, the source file is a grayscale map. But what does it represent? The value of intensity. This tells us how much of the origin signal power returns to the satellite aperture. Values close to zero mean that the earth’s surface absorbs the wave sent by the satellite, which usually happens with water zones.
SNAP allows the processing of satellite data using the unsupervised classification algorithm. The result may not be ideal, but still, after the process, the user can perform supervised classification and determine the classes by recalling the values of intensity in each class. In this case-study there are defined 4 classes: Water, Forest, Agriculture and Buildings. The final result is slightly better than the image from unsupervised classification.
Radar image. Before and after unsupervised classification
Radar image. After supervised classification
Summary
As satellite technology continuously improves, we can receive more and more data from space, with better quality, higher accuracy and many sampling periods.
This allows us to monitor the earth’s surface better than ever before. The application of satellite imagery may be useful in the forestry industry – detecting the rates of deforestation or urban planning – detecting expansion of cities. Is it possible to decide which data type gives better results – optical or radar? The answer may not be straightforward. The resolution of optical images is increased compared to radar images, which may result in more precise land use classification. However, the advantage of radar imagery is that it avoids the problem of cloud coverage and that measurements can be performed regardless of day or night. It may be a good idea to run both data sets in parallel and compare the final results.