

Who knew there were 215 geospatial companies in the world!
A 1 year update on activities.
Podcast stats
- 16 podcast episodes (1 was disallowed by the company – no harm done, it was the second with them), so 15 company interviews published.
- Viewership is… terrible, subs (most popular ep):
- Youtube: 52 (An Ordnance Survey of Artificial Intelligence)
- Substack: 46 (Mobeen Hanid)
- Spotify: 15 (Synmax)
- Apple podcasts: 12 (Umbra)
- Google podcasts: 0 (Bettermaps.ai)
- Amazon Music: 0 (no one listened to anything!)
Related is social media. I quit X because of Andrew Tait – perhaps a bit over the top but really it’s not a good look. I went across to Threads and am at nearly 30 followers. This is an order of magnitude less than what I accumulated on X. But hey. I should say I also secured a coveted Bluesky account, but that’s an even less active platform.
The Geospatial Index
- Number of companies: 215 (Watchlist)
- Sectors: 14
- Industries: 40
- Currencies: 20 (fewer than countries due to the Euro)
- Exchanges: 31
- Countries: 23 (looking through tax havens)
- Subindexes: 21
I’ve been playing with the reports from Sharesight and managed to massage the below table out of Excel. It shows the top five countries by count of geospatial (and related) public companies is the US, Japan, China, Canada then India. The table also contains the most successful geospatial investment from each company (market, stock code, name and value are listed). Value is how much an $AUD100 investment has grown since the company first entered the index. The upshot? Oracle. Listed in 1986, has been the most successful investment the geospatial industry has had to offer thus far.
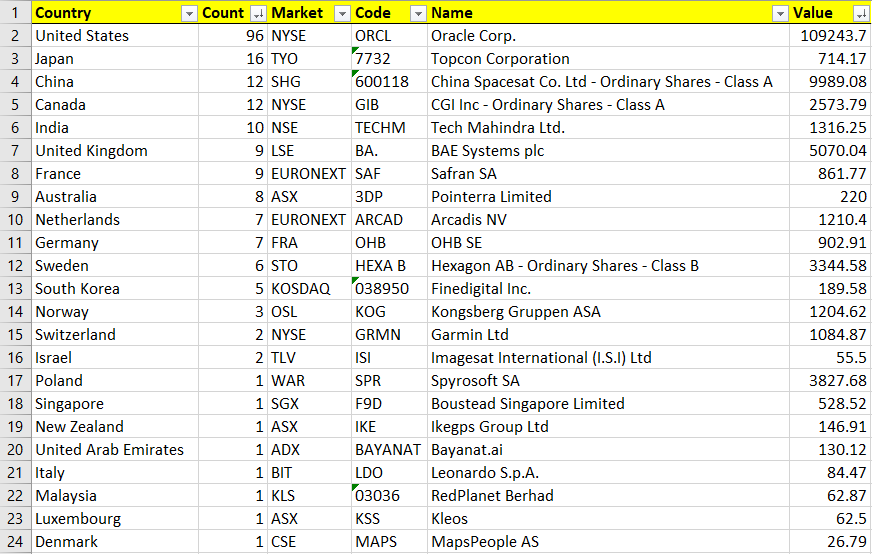
This is because it has compounded at 21% annually since listing in 1986:

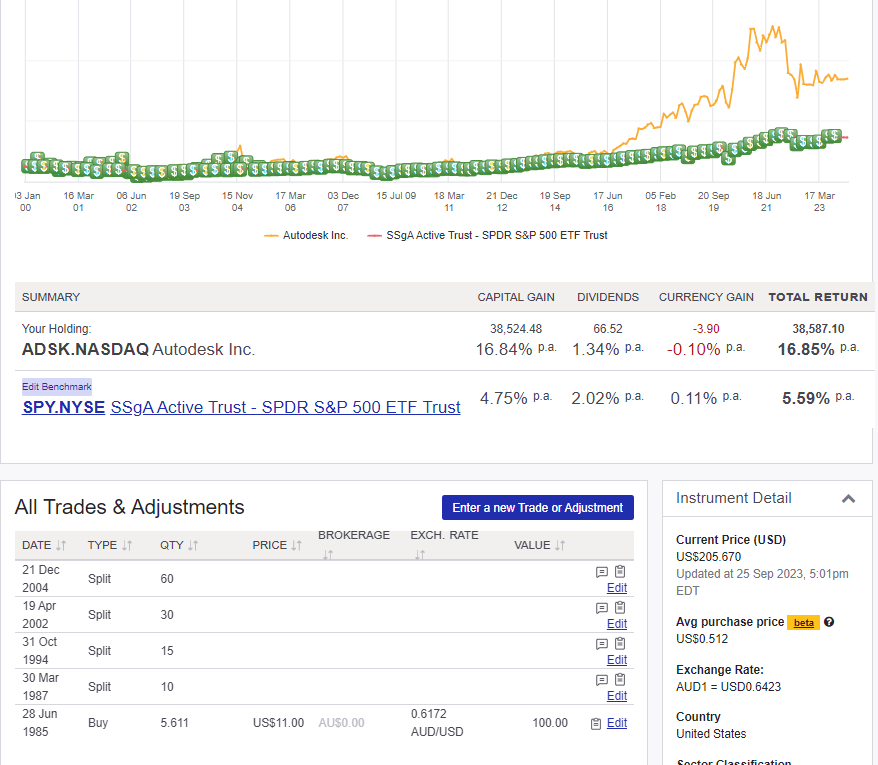
The IPO was outside of Sharesight price history so I obtained IPO price here, and stock split history here. Oracle spatial was first developed in release 4. This was released 2 years before IPO in 1984, so we have captured their entire advance.
Now, I hear some of you complaining that Oracle isn’t a REAL geospatial company. And you’re right! It happens to be the most badass spatial database out there, but I get that this is just a small part of their overall business. Really they’re about vast enterprise database systems for whole regional councils with millions of people, or global organisations employing hundreds of thousands.
So what else can we consider? Well, looking at the list China stands out with China Spacesat. This has grown at 20% since 1997. They are a REAL geospatial company as, amongst the satellites they fly, there are ones doing earth observation and positioning, navigation and timing (PNT). But you can see that this has ‘only’ accumulated just shy of 10k from its original $AUD100 investment. So you must be wondering, amongst all the companies, what is the REAL geospatial company that’s done the best?
Well, we’re back to the US again with Autodesk. From its original $AUD100 investment in 1985 it has compounded to $38,621… This is because, as stated in the episode, every engineering, construction and architecture firm has their software installed. In my view it is TERRIBLE, buggy, unstable, lumbering software that is confusing to use and encourages bad habits around drawings as opposed to generating genuine spatial data… but the truth is they have nailed the industry.
So, I think that’s a fair estimate of things really. America is the best economy with the brightest minds, it stands to reason the most successful geospatial companies come from there. But of course, that says nothing about the future. So it’s great to see China making its way into the mix and this index helps us begin to sift through the opportunities. I’m really excited!
Growth
So, looking at the performance of the index (active and sold positions) over the past decade it is presently at 15.68% over the 200+ companies. Importantly, the S&P 500 index (‘the market’) has basically kept up: 15.32%… So let’s be honest, it is not worth the effort. I could just buy the market, spend no time whatsoever and I’d make just as much money. But, there’s more.
Subindex growth
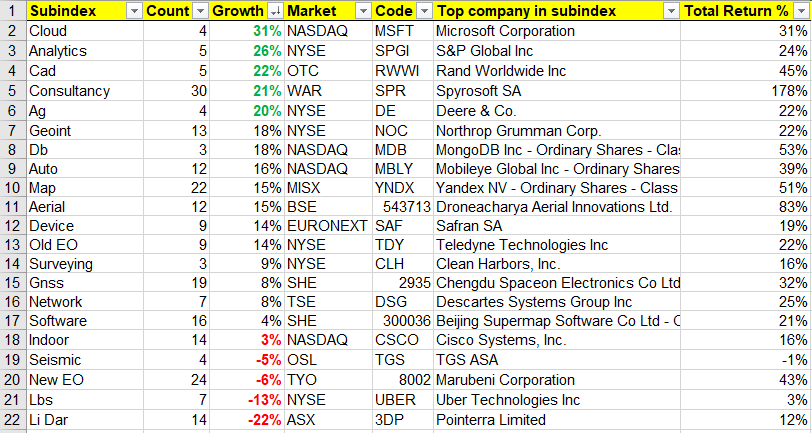
Once again, bear in mind that over the same period since 24 September 2013 the market has grown at 15.32%, invalidating the whole effort for the Geospatial Index. This illustrates the utility of the subindices – one can see which outperform the market! We have 5 that outperform the market by 5% – a HUGE margin!
Base Rates
We can go one step further – recall I mentioned survivorship bias above. I cannot trust the index I’ve assembled prior to 2013 or so. Well, let’s look at the past century of performance of the US market, 10.5%:

So, for the decade of this study, the market has performed at 50% above the historical rate (15 instead of 10%). One may suspect that the same effect applies to The Geospatial Index, so the long term expected growth is also 10%. Dividing the growth rate of the top 5 subindices by 1.5 to find what it might be in regular conditions:

These are still incredibly good growth rates. Yes, the sample sizes of the top 5 are small except for consultancies. If you set the threshold at 10 components per subindex, you’re looking at a top five of 10-14% annual growth in regular economic times.
Conclusion
It is now up 82%.
THE GEOSPATIAL INDEX
This channel, Threads account, newsletter, watchlist and podcast express the view that you are serious about geospatial if you take the view of an investor, venture capitalist or entrepreneur.
You are expected to do your own research. This is not a replacement for that. This is not investment advice. Consider it entertainment.
Bluesky: https://bsky.app/profile/geospatialindex.bsky.social
Threads: https://www.threads.net/@geospatialindex
Watchlist: https://www.tradingview.com/watchlists/123255821/
Meetup: https://www.meetup.com/london-mapup/
Newsletter: https://www.geospatial.money/
Podcast: https://open.spotify.com/show/5gpQUsaWxEBpYCnypEdHFC


#Business


Next article

INTERGEO 2023 is just around the corner, and we’re thrilled to announce that Team Geoawesomeness will be in the heart of the action in Berlin! And we’ve got some exciting activities lined up.
Meet and Greet Evening – Day T minus 1, Monday, 9th October
Before the main event kicks off, we’re hosting a casual meet and greet on Monday evening. It’s a fantastic opportunity to meet fellow geo-enthusiasts, catch up with old friends, and make some new connections in the geo-sphere. Plus, who can resist some good German beverages and pretzels? Save the date and come join us!

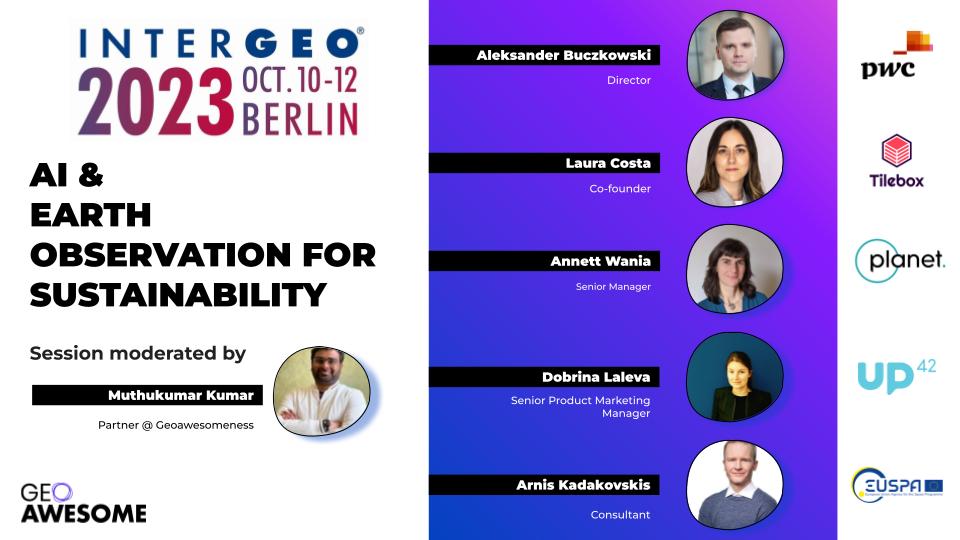
AI and Earth Observation for Sustainability – Day 1, Tuesday 10th
Day 1 promises to be packed with insights, and we’re particularly excited to be moderating a panel on “AI and Earth Observation for Sustainability“. It’s going to be a deep dive into how cutting-edge technologies like Artificial Intelligence can help us leverage Earth Observation data to make our planet more sustainable for generations to come. We believe in the convergence of technology, sustainability, and geospatial science, and this panel is bound to spark important conversations around these themes.
- SIGN up via LINKEDIN
Networking Galore – Day 2, Wednesday 11th
Networking is the name of the game on Day 2! We’re all about forging connections and collaborations. Let’s discuss the latest trends, uncover new opportunities, and pave the way for future collaborations.
Need a Coupon to Register for INTERGEO?
Still haven’t secured your spot at INTERGEO 2023? No worries, we’ve got your back! For those in search of a registration coupon, drop us a line at info@geoawesomeness.com, and we’ll help you out.
Looking forward to connecting, conversing, and celebrating all things geo with you in Berlin.