
Spaceborne vs. In-Situ measurements
The advantage of Earth Observation (EO) is its capability of making continuous measurements in space and time without the need of being in contact with the investigated medium. In-situ measurements still provide the most accurate way of extracting information for one exact location. They also may cover a palette of parameters that are not detectable from space. However, with the advancement in technology (hard- and software of satellites) the accuracy of measurements from space has been increasing in the last years and satellite based analysis expands the sampled spot to a wider spatial region. This extended view shows high advantages for understanding processes and solving problems occurring on the Earth’s surface. On top of the spatial advantage, satellite derived information is scalable in time facilitating regular monitoring and the ability to look into the past by using archived data.
The example of agriculture demonstrates that conditions regarding nutrients or water availability vary spatially within one field. With one or few sampled points on-site it is impossible to generate a spatial image of the conditions on a field. In contrast, a spatial-wide analysis based on satellite data would generate a full picture about the field conditions and may be used to adapt irrigating or fertilizing strategies.
Avoiding spatial-temporal limits of traditional limnological or maritime water field campaigns, industry and public authorities successively acknowledge the advantages of EO derived information and have been starting to replace their local data portfolio with satellite based analysis at least partially.
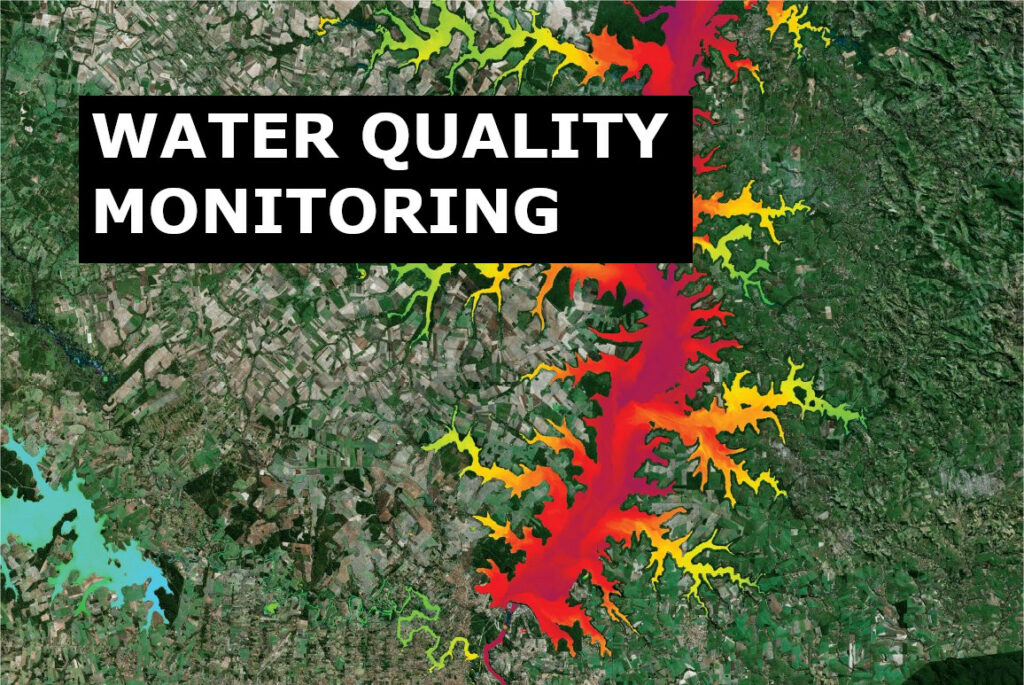
Water quality mapping
Water mapping from space has been approached several times on geoawesomeness, but always with the topic of bathymetry, coastal monitoring and protection. This article complements the water subject by measuring water quality from space. The technology behind relies, as always for optical satellite sensors, on the interpretation of the spectral reflectance of a pixel, in this case over water: it contains a full spectral profile of the water column down to the depth of visibility in case of deep water bodies. Over shallow waters, the pixel also contains sea ground information and can be used to derive bathymetry and to map sea habitats, but leads to incorrect measurement regarding water quality.
How does the technology work?
Pure water (H2O) has specific and well known spectral absorption properties regarding electromagnetic waves. The spectral profile of pure water is impacted and changed by the presence of substances inside the water column. Water substances have different absorption properties that are also well researched. The deviation between the measured spectral response of a water pixel at the satellite sensor to the one of pure water allows to qualify and quantify the occurrence of water substances. The estimation process is complex. Dependent on the sensor, different bands need to be investigated to filter out, which substances occur in water and at which amount. As a huge atmospheric column lies between the water surface and the satellite sensor, these atmospheric influences need to be removed before analysing the water column itself. Atmospheric effects are for instance the presence of aerosols in the air, atmospheric scattering (e.g. Rayleigh scattering) or sun effects on the water surface (e.g. sun glint).
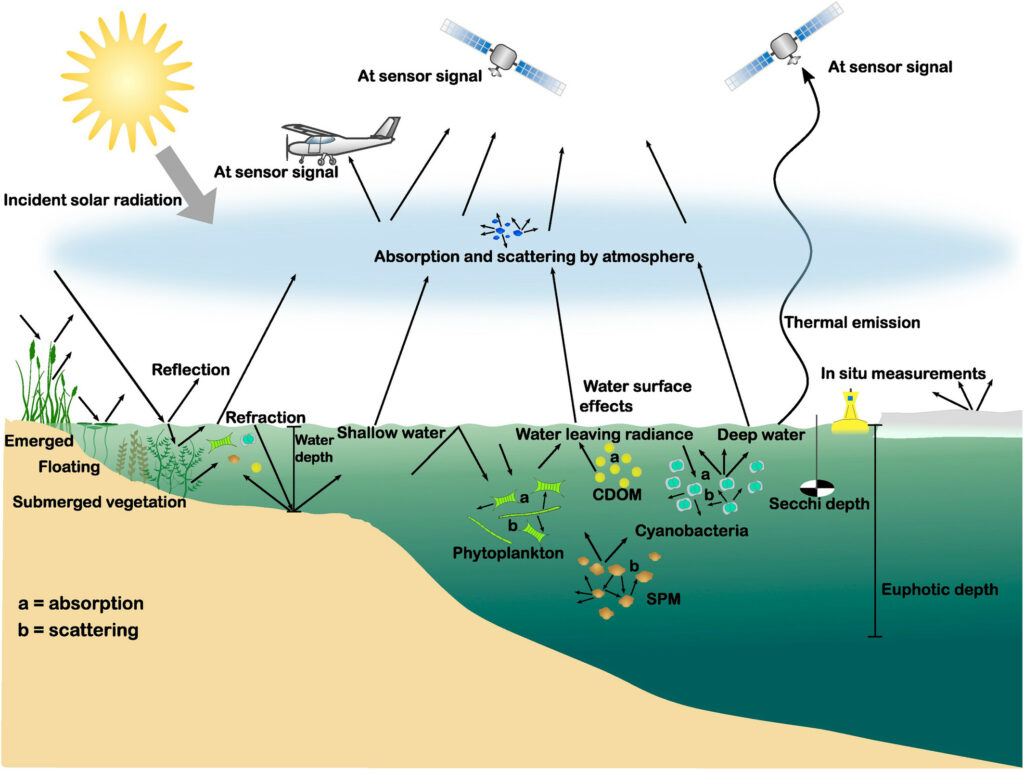
The principle of water remote sensing shown as schematic figure. Source: AGU
Which water quality parameters can be measured from space?
Following water quality parameters can be directly measured from space:
- turbidity
- inorganic dissolved matter
- coloured dissolved organic matter
- chlorophyll-a
- cyanobacteria
These basic water substances can be used as proxy for estimating derived parameters such as the total absorption, total suspended matter, the Secchi depth (depth of visibility) and the trophic state of waters. Cyanobacteria, which are detrimental to humans and animals, can be used to localize harmful algae growth and will be demonstrated in the first use case later. The measurements deliver quantified information corresponding to the amount of a substance in relation to the water volume (e.g. µg/l) or water column (e.g. 1/m) depending on the substance.
What is this information useful for?
The changing environmental conditions and human pressure on water resources, such as the increasing need for water, industry water consumption and population increase, result in a continuously and rapidly rising demand for smart ways of managing the world’s most valuable resource, the fresh and marine water environments. In this context, water mapping from space constitutes a reliable way of retrieving continuous water quality information in space and time at a feasible cost, because it does not require local deployment.
The following examples demonstrate practical use cases of water quality monitoring and were contributed by EOMAP. EOMAP is a leading global service provider of satellite-derived aquatic information in maritime and inland waters for the commercial offshore industry as well as a multitude of government agencies. Pioneering the field of satellite-derived bathymetry and high-resolution water quality monitoring, EOMAP services rely on standardised physical models which are independent of scale, sensor type and geographic location. Additional key services include seafloor, coastal environment, and infrastructure mapping. EOMAP’s technology can be applied at local through to intercontinental scales, with the option of providing continuous and long-term monitoring by harnessing multiple satellite resources. EOMAP was founded in 2006 as a spin-off of the German Aerospace Center (DLR) and is headquartered in Castle Seefeld, just outside of Munich, Germany.
Use Case 1: Lake Monitoring
A classic use case of water quality mapping is the area-wide monitoring of lakes. The quantification of chlorophyll-a, turbidity or Secchi depths gives information about the state of water bodies that might be relevant for water activities. Water conditions are dynamic throughout the year, particularly during the vegetation period. Algae growth for example depends on multiple factors such as temperature, rainfall, the presence of organic substances etc. and fluctuates in space, time, and between water bodies. Hence, real-time and widespread water quality information may help to plan water activities such as swimming, fishing or sailing. Cyanobacteria is a water quality parameter, which soared in importance over the last few years. Its presence in water is harmful for humans and particularly animals having caused an increasing number of dying dogs in German lakes in the last years (e.g. almost 20 fatal incidents only at Tegler See close to Berlin since 2017). With the monitoring capability from space, a continuous picture about the water condition and occurrence of harmful algae could be established making it possible for authorities to issue warnings in time and allow citizens to make the optimal choice which lake to select for the next swimming trip.
The example below shows algae monitoring at Mandichosee in Germany, where indeed in July 2022 a dog died from cyanobacteria. The monitoring from space shows a high likelihood of harmful algae occurrence arising in the days before the accident day. The study was created after the incident and is based on Planet data.
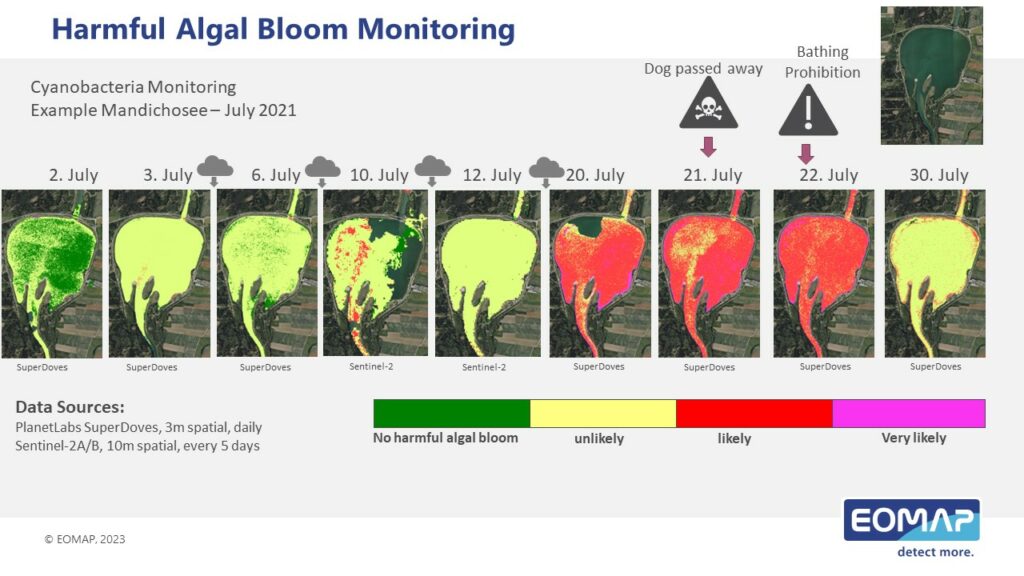
Water quality monitoring time series of Lake Mandicho in Germany in July 2021. The figure shows the Algae Bloom Indicator, a classification relating to the likelihood of harmful algae growth. For the actual analysis additional parameters such as turbidity and chlorophyll-a were analysed. The analysis builds on Planet data. Source: EOMAP
Use Case 2: Dredging
Dredging is applied to create new channels or enlarge existing ones, as well as berth areas, swing basins, marinas and boat harbour areas. Maritime wind parks have become a “popular” recent example associated with dredging. Its activities swirl up sediments and thereby produce turbidity plums that can be transported over long distances by sea currents. It consequently has the potential to reduce water quality, change hydrodynamics (the movement of water), smother plants and animals that live on the seabed, and displace marine life. Its monitoring is necessary and in case of nearby, sensitive habitats even mandatory to prevent environmental damages. Understanding the full spatial and temporal variability of turbidity as consequence from dredging activities can be costly if realized through in-situ monitoring. Satellite derived analysis provides an alternate way of monitoring turbidity over space and time without the need for field deployment.
The example shows an area at Weipa in Australia, where more than 2.4 million m3 of sediment was dredged and relocated in 2019. EOMAP, monitored the site within a period of around 40 days to obtain a full picture of the area before, during and after the interference. The figure shows one sampling day.
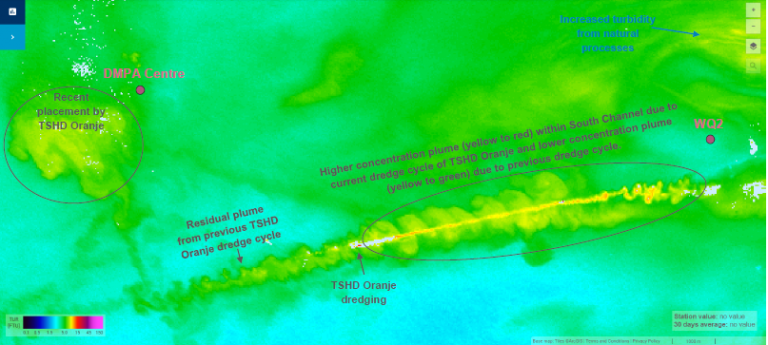
Turbidity monitoring near Weipa off the Australian coast to monitor maritime dredging activities. Dredging monitoring is important to plan protection of nearby habitats. Source: EOMAP
Use case 3: Sediment monitoring
Hydropower is an important source for renewable energy. The economic and ecological evaluation of new hydropower developments rely on a number of environmental conditions, such as key hydrological parameters. Major drivers of the reservoir storage capacity over time, reservoir life time (and related reinvestment time), and also a major driver of the operations costs are directly related to the sediment regime and sediment trapping. Thus, the estimation of sediment fluxes and rates in reservoirs enables hydropower companies to plan and manage sediment operations. It is supported by continous turbidity monitoring from space.
The example below shows the Cahora Bassa Reservoir and inflowing rivers in Moçambique. The artificial lake is retained by one of the world’s largest dams. The reservoir is continuously monitored by EOMAP since 2019.
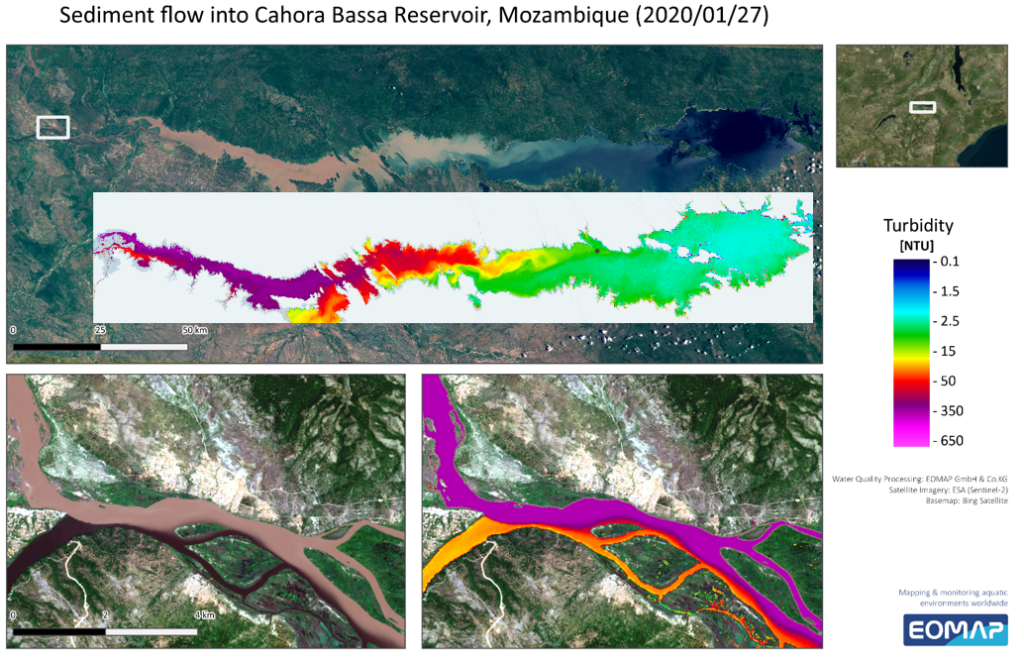
Monitoring of Cohora Bassa Reservoire in Moçambique. The presented maps are taken from an on-going time series. Source: EOMAP
Further examples of water quality monitoring
The figures at the bottom show results from a water quality monitoring at Lake Elsinore and Canyon Lake in California, USA.
Lake Elsinore at the bottom left shows elevated turbidity and chlorophyll-a values. Indeed it frequently experiences high algae growth. The Canyon Lake on the right hand side exhibits lower concentrations of turbidity and chlorophyll-a. It serves as a source of drinking water for the nearby city.
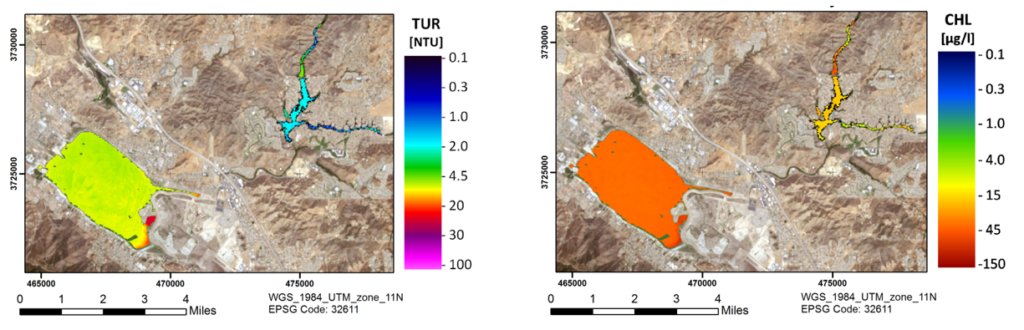
Source: EOMAP
Turbidity map of the Eastern part of Lake Victoria in the triangle between Kenya, Tanzania and Uganda. The area around the Nzoia River delta (upper part) and the bay at Kisumu (right part) show highly elevated turbidity values compared to the remaining parts of the lake. This behavior is also confirmed by the chlorophyll-a map (not shown here) and implies elevated algae growth in these areas.
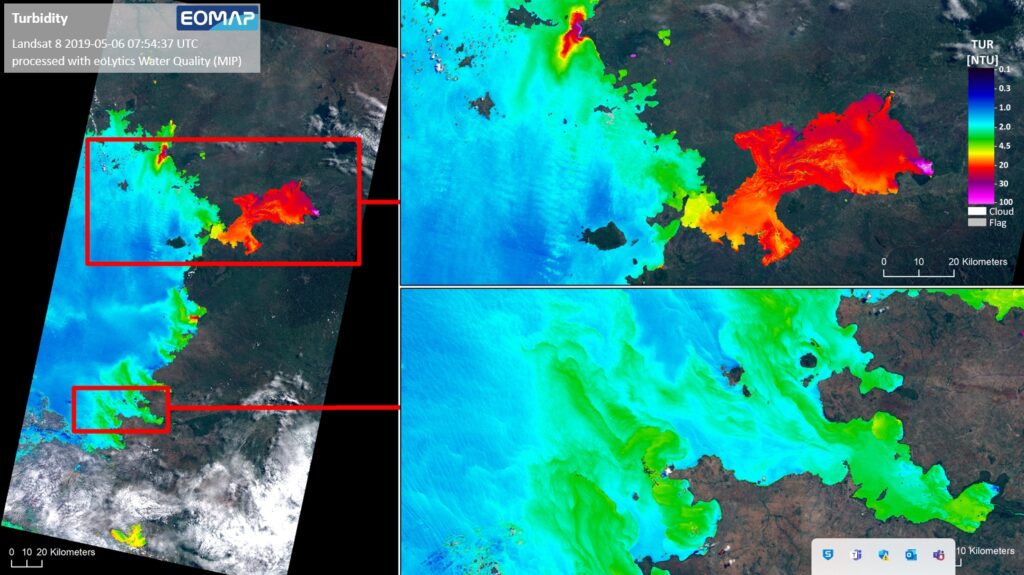
Source: EOMAP
Turbidity map at one of the world’s largest reservoirs, Itaipu in Brazil. The analysis was done in 2018 (for the legend, please look at image above).
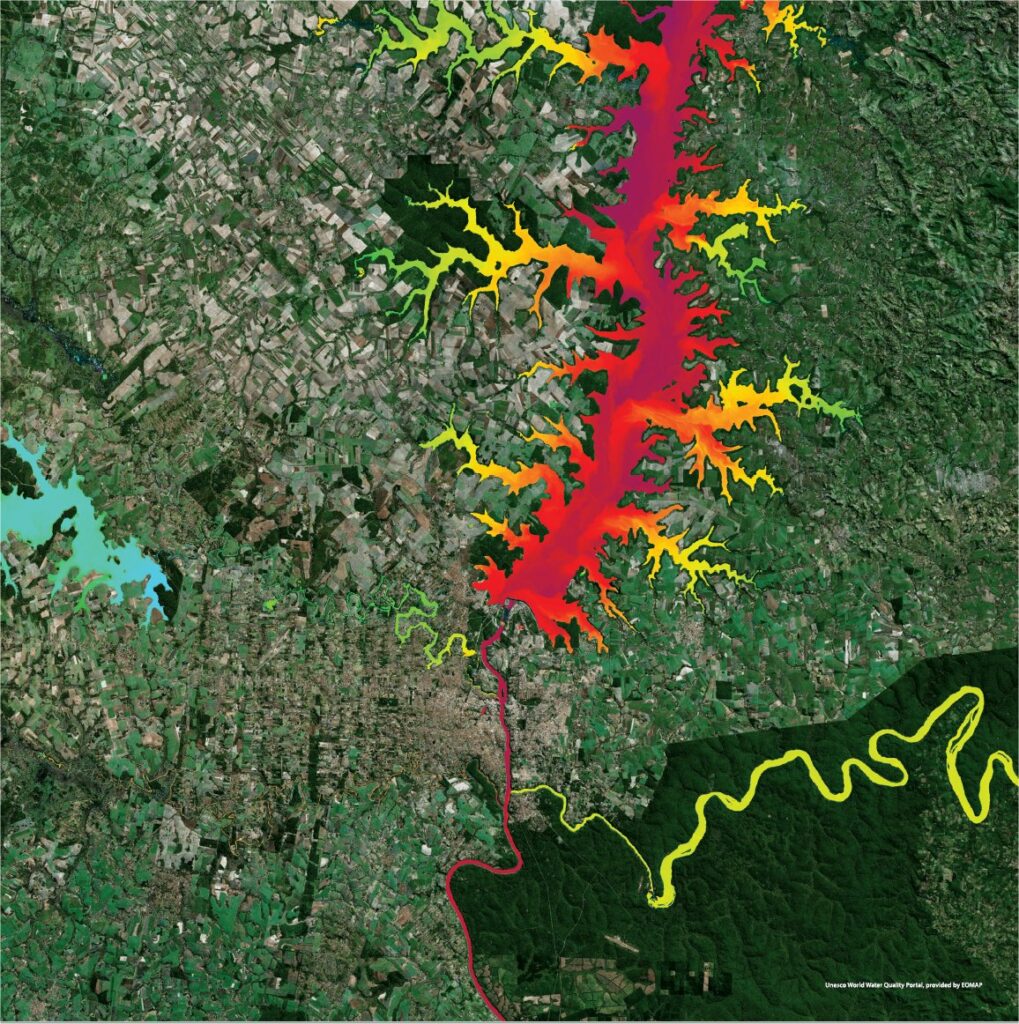
Source: EOMAP

#Business


Next article
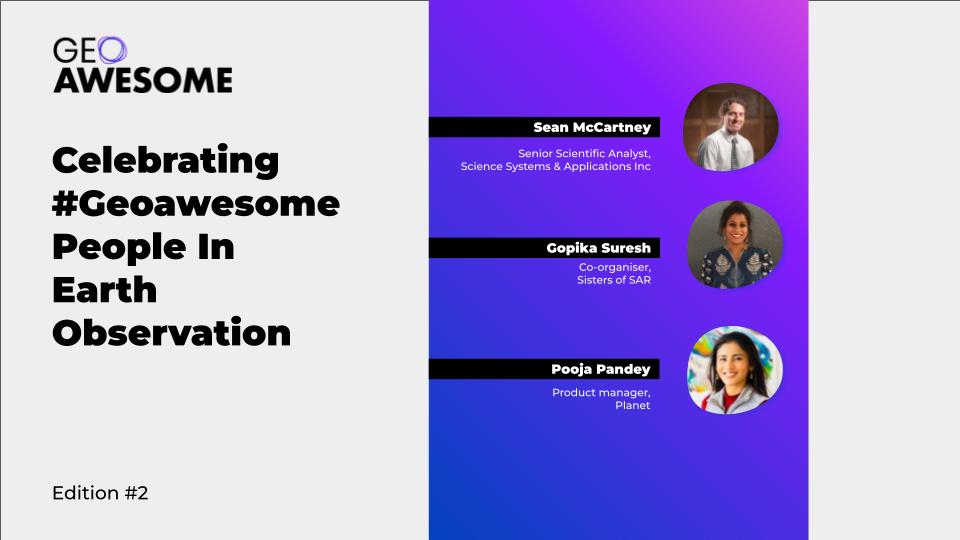

In this series, we’ll be highlighting #geoawesome people making significant contribution in one way or the other to the field of Earth Observation. Get ready to be inspired by their groundbreaking work, dedication to our planet, and the passion they bring to this ever-evolving field.
It’s all about networking and getting to know new people! Happy networking ?
Check out Edition #1 here.
Sean McCartney
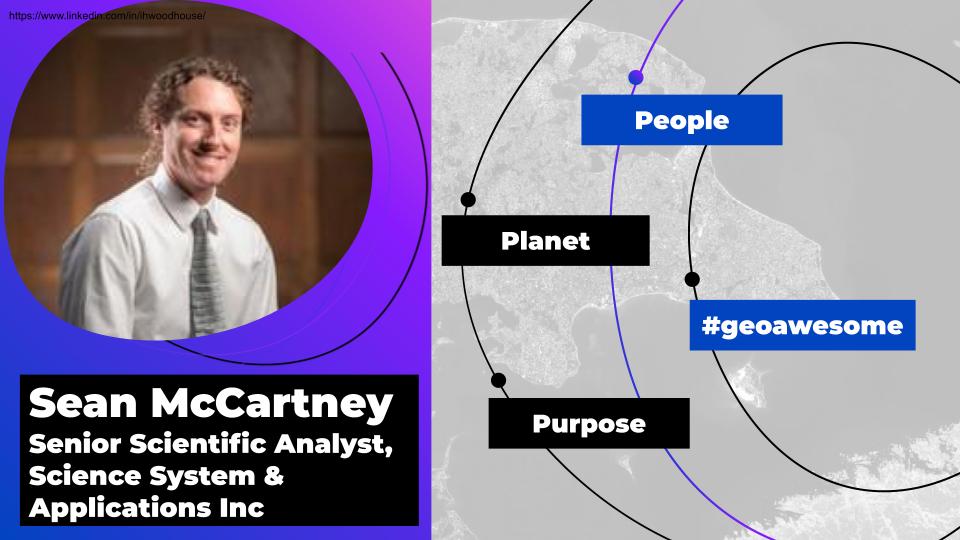
Sean McCartney is a Senior Scientific Analyst at NASA Goddard Space Flight Center, where he has worked for over eight years. He is currently supporting NASA’s Applied Remote Sensing Training (ARSET) program, which offers satellite remote sensing training to policymakers, NGOs, and other applied science professionals seeking to incorporate NASA Earth Science data into their workflow. Sean’s top skills include GIS, program management, and remote sensing. He is fluent in English and has limited working proficiency in French, Malagasy, and Spanish. He holds a certification in Geographic Information Science. Sean’s expertise lies in geospatial technologies combining remote sensing and GIS. He enjoys the challenges of scientific research, partner engagement, proposal writing, capacity building, and communications. Colleagues know him as passionate about his work, always interested in receiving feedback from others, and striving to innovate new ways of leveraging Earth observations to address environmental challenges at the local, national, and international levels. In addition to his work at NASA Goddard Space Flight Center, Sean has experience working overseas and has lived and traveled extensively on five of the seven continents.
Pooja Pandey
Pooja Pandey is an Earth Observation and Remote Sensing Specialist with expertise in Sustainability, Renewable Energy, and Oil/Gas. She has worked at Planet as a Product Manager for close to 6 years. Pooja has an international perspective and is fluent in four languages, having lived and worked in four different countries over three continents. She has experience working in culturally diverse teams and completed an internship in China working with German and Chinese colleagues. Additionally, Pooja has conducted research into different biogas technologies deployable in China as part of a team of four, which was presented to main stakeholders and is now being utilized by the company in expanding their biogas plant technologies. She has also worked as a Media & Communications Intern at IGEA – International Green Economy Association and as a Research Intern at The Linde Group.
Gopika Suresh
Dr. Gopika Suresh is a Synthetic Aperture Radar (SAR) scientist. She is a co-organizer at SistersofSAR and was recognized as one of Geospatial World’s 50 Rising Stars in 2021. Dr. Suresh has extensive experience in SAR-based land use and land cover change detection, coastline monitoring from SAR, natural hazards mapping using SAR and InSAR, oil slicks & offshore seep detection using SAR, InSAR, PolSAR EO4SDGs, Python programming, and GIS.
Gopika completed her PhD in marine geosciences from the University of Bremen in Germany where she designed and implemented the first system that automatically estimates the locations of offshore oil seeps from SAR data called ASLE- Automatic Seep Location Estimator. Her dissertation title was “Offshore oil seepage visible from space: A Synthetic Aperture Radar (SAR) based automatic detection, mapping and quantification system.” She has also authored several publications related to SAR-based classifiers for land applications in Germany and automatic estimation of oil seep locations in synthetic aperture radar images. Currently, Gopika works as a Senior Remote Sensing Expert at UNIQUE forestry and land use GmbH in Freiburg, Baden-Württemberg, Germany. Prior to this role, she worked as a Research Scientist at Bundesamt für Kartographie und Geodäsie in Frankfurt for one year and five months. She also served as a Postdoctoral Researcher at Earth Observatory of Singapore at Nanyang Technological University where she conducted research on natural hazards mapping using SAR and InSAR.
EO Monthly Gazette
Interested in staying informed about the latest news and development in the world of earth observation? Sign up to our new monthly focused newsletter for the EO industry.