How Satellite-Derived Bathymetry Enables Coastal Monitoring and Protection

Editor’s note: This article was written as part of EO Hub – a journalistic collaboration between UP42 and Geoawesomeness. Created for policymakers, decision-makers, geospatial experts and enthusiasts alike, EO Hub is a key resource for anyone trying to understand how Earth observation is transforming our world. Read more about EO Hub here.
Mapping the global sea floor is vital in aiding our understanding of our planet and its climate, but with an estimated 75% of the sea floor unexplored, the world’s vast oceans are still largely unknown.
When it comes to our daily lives, the most crucial areas for us to focus on are the coasts. To understand and predict coastal change, we need accurate, large-scale measurements of key parameters, including bathymetry. However, currently, nearly 50% of the world’s coastal waters remain unsurveyed.
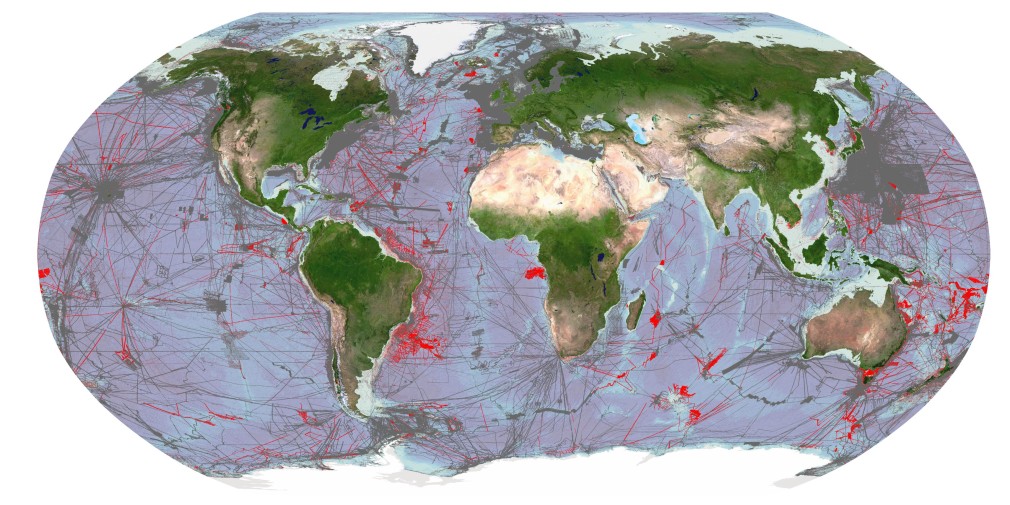
Image showing areas of global seafloor considered to be mapped by General Bathymetric Chart of the Oceans (GEBCO). Grey areas depict coverage of as of 2021, red areas are additions for 2022. Credit: The Nippon Foundation-GEBCO Seabed 2030 Global Center (GDACC) on behalf of Seabed 2030; Source: seabed2030.org
Our vital coastal regions
The shallow water zones near the coast are home to around 10% of the world’s population, playing host to many megacities. These low-lying regions are also of the utmost importance for industrial applications—such as the safe navigation of ships—as well as for coastal protection and management. Coastal areas are also highly dynamic, particularly vulnerable to natural and human-induced changes, impacted by factors including erosion, extreme weather events, sea-level rise, and population movements. Continuous monitoring of the world’s coasts is a necessity.
Gathering bathymetric data for shallow coastal waters has always been a challenge as traditional methods such as sonar or LiDAR are time-consuming and expensive to carry out. As a result, for a large number of these coastal regions, such data is either unavailable or decades old.
One of the promising technologies to bridge this information gap is satellite-derived bathymetry (SDB), which is using multispectral optical data to estimate the depth of near-shore waters.
How does it work?
Satellite data has been used to map the ocean floor for several decades using techniques such as radar altimetry, wave kinematic, and even space-based lasers. Such methods allowed scientists to generate an approximate model of the ocean floor but the resolution of such methods are not enough for shallow waters (down to a depth of 30m).
Satellite-derived bathymetry uses optical image data to try to estimate the depth of the water in a given place. One of the most effective algorithms to do that is called multispectral signal attenuation, which involves analyzing imagery using a combination of spectral bands. As different wavelengths penetrate the water to a greater or lesser degree, the light attenuation can be measured, and elevation ratios are created by analyzing the colour profile and spectral characteristics of coastal areas with known depths. Algorithms are then used to infer water depth from new spectral information by comparing it to known depths of similar areas. With this approach, it is possible to estimate the depth of the water, even down to 30 meters, with a high level of accuracy.
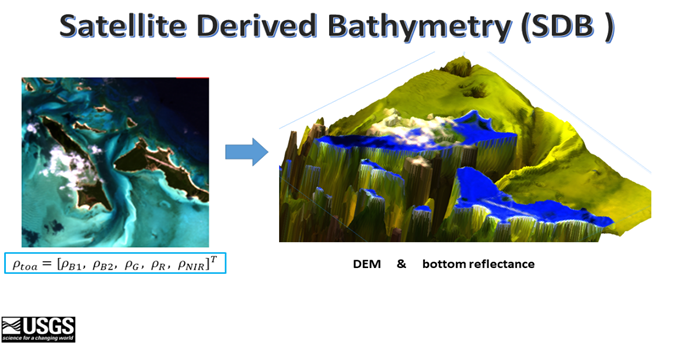
Source: USGS: https://www.usgs.gov/special-topics/coastal-national-elevation-database-%28coned%29-applications-project/science/satellite
The better the resolution and the more spectral bands used in the data, the more accurate the results will be, but even lower resolution data can provide valuable information.
Today, data for SDB is measured from various satellite sources, such as Landsat 8 (NASA), Sentinel-2 (ESA), and Pleiades (Airbus). Recently, Airbus launched a new constellation called Pleiades Neo which has a very high resolution of 30cm available via Up42 marketplace among others. More importantly, it features a new spectral band called deep blue with wavelengths of 400-450 nm, specifically designed for satellite-derived bathymetry and atmospheric corrections. This new spectral band allows for much better interpretation of optical data for shallow waters than previously possible.
What are the benefits of SDB?
SDB is a cost-effective and time-efficient alternative to traditional on-site methods. It doesn’t require ships or human divers, making it a safer method for data collection, and also dramatically reducing the environmental impact caused by more intrusive methods.
Airborne LiDAR bathymetry is another technique to measure the seafloor from the skies. It uses an active sensor which beams a green laser light, as opposed to a passive optical satellite sensor. The use of LiDAR gives higher accuracy than SDB, but at a much higher cost, as it requires dedicated airborne survey and only produces data for a relatively small area. SDB, on the other hand, utilizes existing satellite infrastructure, the images cover a wider area, and data can be captured multiple times a day, meaning it has both repeatability and scalability. It is also time-efficient and can provide near-real time monitoring, making it ideal for regular oceanographic management.
SDB is not without its disadvantages. For instance, it can lack spatial resolution when compared to other methods. Depending on the type of technology used, satellite imagery may be affected by weather conditions, water quality, and the presence of vegetation. It has limited effectiveness in deeper waters. Despite these limitations, SDB is a powerful tool for measuring shallow waters, and can be used very effectively in combination with other methods—above all because the data can be captured with such regularity.
Source: https://business.esa.int/projects/international-satellite-derived-shallow-water-bathymetry-service
Applications of SDB
SDB in coastal regions can play a key role in a variety of practical applications that are essential to our current way of life and preservation of our future.
Bathymetry is an important tool for many industries. In terms of trade and logistics, accurate bathymetric data is essential for ships and port authorities to ensure safe navigation. Sea transportation is an essential component in over 90% of international trade, and the ships used to transport these goods are growing ever bigger. Understanding the shape of the ocean floor is a vital input for models of ocean currents and waves, and therefore bathymetry can help to improve sea-state monitoring, including wave prediction and more. For the telecommunications industry, bathymetry is used to plan the routes of subsea fiber-optic cables, avoiding coral reefs, shipwrecks, sensitive areas and geological obstructions. Around 474 of these cables are responsible for transmitting 99% of international data (according to TeleGeography, 2021).
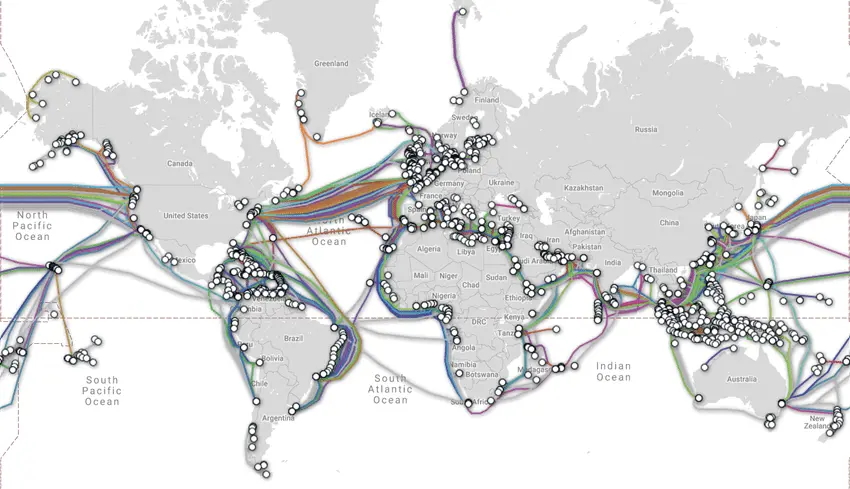
Map of global subsea fiberoptic cables. Source: www.submarinecablemap.com
Energy companies also rely on bathymetry to explore and extract oil and gas, as well as using it to secure new energy resources like wind and ocean energy. It is also used to monitor sedimentary movements in the corridor between the coast and the energy exploitation site to ensure the integrity of cables connecting wind turbines to the shore. These cables are a critical part of the infrastructure for wind energy—which is the fastest growing blue economy sector, as of 2019.
Bathymetry is also used to estimate and control the volume of materials extracted from the seabed and monitor changes caused by dredging activities. Dredging is essential for many industrial and civil engineering applications, but can contribute to coastal erosion and environmental damage if not carefully managed. More broadly, bathymetry is used to better understand coastal erosion caused by both natural and human factors, and can aid in better management of our coasts, including the development of innovative coastal defense systems for risk mitigation and post-crisis analysis.
Accurate and precise knowledge of the seabed is also key in protecting undersea conservation sites and archaeological areas. One way that bathymetry data can help with this is by modelling underwater noise caused by human activity. Furthermore, the technology contributes to food security, helping to identify locations for offshore aquaculture cages, habitat mapping and impact modeling to meet the increasing demand for seafood.
Bathymetry even aids in issues of sovereignty: sovereign waters are defined by the limits of the continental shelf, as dictated by the United Nations Convention on the Law of the Sea (UNCLOS). Bathymetry helps to establish these boundaries and justify the rights of a coastal state to explore (and exploit) its maritime territory.
Satellite-Derived Bathymetry: An essential tool for the future
The monitoring of coastal waters is becoming increasingly important, both for business and for tracking and mitigating climate change. With this in mind, it is clear that satellite-derived bathymetry will be an essential tool for hydrographers in the near future as the technology continues to mature.
The benefits of SDB include its ability to be applied completely remotely, with no associated environmental impacts or human risks, and its cost-effectiveness and time-efficiency compared to traditional methods, making it an important tool for estimating the depth of coastal waters. It still has some limitations in terms of accuracy and availability of data, as well as its effectiveness in deeper waters, but we can expect significant developments in this space in the coming years.
The emergence of SDB takes advantage of the major shift and acceleration in the Earth Observation (EO) market, as the emergence of low-cost small satellite technology continues to democratize access to EO data. Leading EO companies are launching new constellations with spectral bands supporting SDB applications, such as Pleaides Neo and Deep Blue, and the technology is expected to be disrupted in the future by computer vision and deep learning models.
With the ability to remotely, cost-effectively, and efficiently monitor coastal waters, SDB is poised to play a crucial role in our understanding and management of these vital resources.
Did you like the article? Subscribe to our monthly newsletter:

#Categories


Next article
EO-based detection of super-emitters
Editor’s note: This article was written as part of EO Hub – a journalistic collaboration between UP42 and Geoawesomeness. Created for policymakers, decision-makers, geospatial experts and enthusiasts alike, EO Hub is a key resource for anyone trying to understand how Earth observation is transforming our world. Read more about EO Hub here.
Methane (CH4) is a major component of natural gas and a strong greenhouse gas (GHG). Over the past 20 years, it has become 80 times more potent in warming the climate than carbon dioxide. When greenhouse gas enters the atmosphere, it acts as a mantle insulating the Earth. It absorbs energy and thus slows the rate at which heat leaves the planet. This process is referred to as the greenhouse effect and shapes the climate of our planet in a very significant way.
The Earth’s surface temperature is about 14°C. If it were not for the greenhouse effect, the average temperature of the Earth’s surface would be almost -20°C, and the Earth would be covered with ice all the way to the equator. However, with the increase in greenhouse gas emissions over the past few centuries, the greenhouse effect has steadily increased, contributing to the warming of our planet at a rate that many consider alarming.
Super-emitters are sites or facilities, typically in the fossil fuel, waste or agricultural sectors, that produce a disproportionate share of total methane emissions. According to a study of natural gas production in the state of Texas, 1% of natural gas production sites account for 44% of total emissions. Based on the study, the researchers found that emissions come from unintentional failures during natural gas development and production, which means that super-emitting sites have abnormal behavior.
With such large disparities in the output of harmful gas, control is key to preventing emissions and keeping them in check. This is because specific sites can be affected by abnormal conditions, resulting in them being super-emitters at different times. As a result, rather than trying to control emissions from several sites, minimizing emissions requires a monitoring approach that allows for effective and timely responses to the unpredictable nature of when and where a super-emitter will be located.
“Reining in methane emissions is key to limiting global warming,” according to NASA Administrator, Bill Nelson.
How to detect super-emitters using EO
At the COP26 meeting in Glasgow in 2021, following the release of the Global Methane Assessment (CCAC/UNEP) report, more than 100 countries signed the Global Methane Pledge. The signatories pledged to reduce methane emissions by 30% by 2030 relative to 2020. Implementation of the Global Methane Pledge could reduce projected global warming by 0.28°C by 2050. In addition, as indicated in the Global Methane Assessment, a greater reduction in emissions would also be realistic: 45% within a decade.
This raises the question of how best to control emissions to meet the target. Currently, verification of methane emissions can be done using satellites, which has the advantage of obtaining information quickly and globally. There are already several satellites and networks of satellites in orbit around the Earth that provide accurate emissions data. The satellites differ in their sensor parameters, including resolution, both spatial and spectral, recorded electromagnetic wavelength ranges, flight speed, etc. Methane concentration is not measured directly, but is obtained by analyzing and interpreting light intensity in different spectral ranges. Sensors, which use a band within the short-wave infrared spectrum, can detect methane. Methane absorbs infrared light in a unique way called spectral fingerprinting.
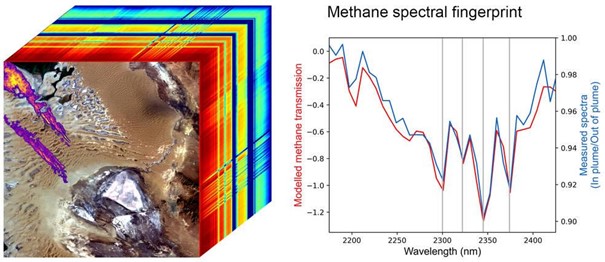
The cube (left) shows methane plumes over Turkmenistan. The colors of the rainbow are spectral fingerprints from the corresponding locations in the front image. The blue line in the graph (right) shows the detected EMIT methane fingerprint; the red line is the expected fingerprint based on atmospheric simulation. Credit: NASA/JPL-Caltech
NASA’s New Earth Space Mission
Initially, NASA’s Earth Surface Mineral Dust Source Investigation (EMIT) mission was intended solely to map the distribution of key minerals in the planet’s dust deserts. However, EMIT has demonstrated that it can also detect the presence of methane. In data that EMIT has collected since its installation on the International Space Station in July, the science team has identified more than 50 “super-emitters” in Central Asia, the Middle East and the southwestern United States. The newly measured methane hotspots – some previously known and others recently discovered – include extensive oil and gas facilities and large landfills. “This exciting new development will not only help scientists better determine where methane leaks are coming from, but also provide insight into how they can be remedied,” NASA Administrator Bill Nelson said. “The International Space Station and NASA’s more than two dozen satellites and instruments in space have long been invaluable in determining climate change on Earth. EMIT is proving to be a key tool in our toolbox to measure this potent greenhouse gas – and stop it at the source.”
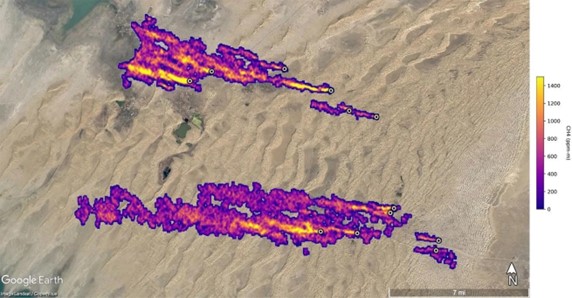
Orbiting the Earth every 90 minutes from its location aboard a space station about 400 kilometers high, EMIT is able to scan vast stretches of the planet tens of kilometers in diameter, while focusing on areas as small as a soccer field. “Some of the plumes EMIT detected are among the largest ever seen – unlike anything that has ever been observed from space,” said Andrew Thorpe, a Jet Propulsion Laboratory (JPL) research technologist leading the methane studies. An example is a cluster of 12 plumes from oil and gas infrastructure in Turkmenistan, with some plumes extending more than 32 kilometers. Scientists estimate that Turkmenistan’s plumes collectively eject methane at a rate of 50,400 kilograms per hour, rivaling the peak flow from the 2015 Aliso Canyon gas field explosion near Los Angeles, one of the largest accidental methane releases in U.S. history.
Super-emitters in Turkmenistan – 12 plumes of methane flux. The plumes were detected by NASA’s Earth Surface Mineral Dust Source Investigation mission, and some of them extend for more than 32 kilometers. Source: NASA/JPL-Caltech
“As we continue to explore the planet, EMIT will look at places where no one thought to look for greenhouse gas emitters before, and find plumes that no one expects,” Robert Green, EMIT’s principal investigator, said.
Organizations and start-ups supporting methane detection
There are several organizations and startups that focus on detecting emissions of harmful greenhouse gases and super-emmiters, including methane. Importantly, all of them use their specialized satellites for this purpose. Worth highlighting here are:
GHGSat – satellites from a private company offering data for the oil, gas, coal mining, waste management, and financial and public institutions sectors, as of 2016.
MethaneSAT – a satellite funded by the US NGO Environmental Defense Fund and the New Zealand Space Agency.
Carbon Mapper – a public-private project of NASA’s Jet Propulsion Laboratory.
GeoCarb – geostationary satellite, a joint initiative between NASA and the University of Oklahoma, among others, scheduled for launch in 2023.
Copernicus Sentinel-5 Precursor – a satellite of the European Space Agency and the European Commission.
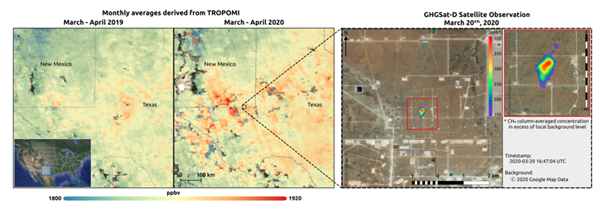
To obtain precise information about the location of an emission point, each company uses its own methods, and combines available technologies. For example, the SRON and GHGSat research teams have been working since early 2019 to detect methane hotspots. The SRON team uses data from the Copernicus Sentinel-5P satellite to detect super-emitters on a global scale. The GHGSat team then uses data from the GHGSat satellites to quantify and attribute emissions to specific sites around the world. Their work has led to the discovery of several new hot spots in 2020, such as above a coal mine in China. The team also detected methane emissions over the Permian Basin, the largest oil-producing region in the United States.
Another method was to combine data from two missions: Copernicus Sentinel-5P and Sentinel-2 using artificial intelligence algorithms. As a result, Kayrros specialists detected 13 methane emission events in 2019-2020 along the Yamal-Europe pipeline, which runs through Russia, Belarus, Poland and Germany, over a distance of 4196 kilometers. They also estimated that one leak dumped as much as 93 tons of methane every hour.
Both findings confirm the need for constant emissions control. Undetected methane leaks from the energy industry are a global problem – and a serious one. A lot of useful data is available for anyone interested in doing their own analysis. Companies like UP42 are also helping to raise environmental awareness by distributing environmentally important data – available to anyone.
Conclusions
When one hears about global warming, by far the most prevalent material is about the fight against carbon dioxide. However, reducing methane emissions is also very important, because methane has a stronger warming effect in the short term than CO2, and reducing methane emissions would have a more direct effect on the climate. Methane accounts for about 30 percent of the increase in global temperature since industrialization, and emissions rose to record levels for the second year in a row last year. In addition, super-emitters can increase emissions by as much as dozens of times, relative to average emitting facilities or equipment. This is therefore a huge problem for both the environment and us humans. The only way to stop this process is to limit emissions. But the key here is control and accurate detection of super-emitters. Satellite technology, which has been active in this area for several years and is constantly developing in the industry, is invaluable here. It is only with the use of EO that we are able to control the changes taking place around the world so quickly and virtually in real time.
Did you like the article? Read more and subscribe to our monthly newsletter!