EO-based detection of super-emitters

Editor’s note: This article was written as part of EO Hub – a journalistic collaboration between UP42 and Geoawesomeness. Created for policymakers, decision-makers, geospatial experts and enthusiasts alike, EO Hub is a key resource for anyone trying to understand how Earth observation is transforming our world. Read more about EO Hub here.
Methane (CH4) is a major component of natural gas and a strong greenhouse gas (GHG). Over the past 20 years, it has become 80 times more potent in warming the climate than carbon dioxide. When greenhouse gas enters the atmosphere, it acts as a mantle insulating the Earth. It absorbs energy and thus slows the rate at which heat leaves the planet. This process is referred to as the greenhouse effect and shapes the climate of our planet in a very significant way.
The Earth’s surface temperature is about 14°C. If it were not for the greenhouse effect, the average temperature of the Earth’s surface would be almost -20°C, and the Earth would be covered with ice all the way to the equator. However, with the increase in greenhouse gas emissions over the past few centuries, the greenhouse effect has steadily increased, contributing to the warming of our planet at a rate that many consider alarming.
Super-emitters are sites or facilities, typically in the fossil fuel, waste or agricultural sectors, that produce a disproportionate share of total methane emissions. According to a study of natural gas production in the state of Texas, 1% of natural gas production sites account for 44% of total emissions. Based on the study, the researchers found that emissions come from unintentional failures during natural gas development and production, which means that super-emitting sites have abnormal behavior.
With such large disparities in the output of harmful gas, control is key to preventing emissions and keeping them in check. This is because specific sites can be affected by abnormal conditions, resulting in them being super-emitters at different times. As a result, rather than trying to control emissions from several sites, minimizing emissions requires a monitoring approach that allows for effective and timely responses to the unpredictable nature of when and where a super-emitter will be located.
“Reining in methane emissions is key to limiting global warming,” according to NASA Administrator, Bill Nelson.
How to detect super-emitters using EO
At the COP26 meeting in Glasgow in 2021, following the release of the Global Methane Assessment (CCAC/UNEP) report, more than 100 countries signed the Global Methane Pledge. The signatories pledged to reduce methane emissions by 30% by 2030 relative to 2020. Implementation of the Global Methane Pledge could reduce projected global warming by 0.28°C by 2050. In addition, as indicated in the Global Methane Assessment, a greater reduction in emissions would also be realistic: 45% within a decade.
This raises the question of how best to control emissions to meet the target. Currently, verification of methane emissions can be done using satellites, which has the advantage of obtaining information quickly and globally. There are already several satellites and networks of satellites in orbit around the Earth that provide accurate emissions data. The satellites differ in their sensor parameters, including resolution, both spatial and spectral, recorded electromagnetic wavelength ranges, flight speed, etc. Methane concentration is not measured directly, but is obtained by analyzing and interpreting light intensity in different spectral ranges. Sensors, which use a band within the short-wave infrared spectrum, can detect methane. Methane absorbs infrared light in a unique way called spectral fingerprinting.
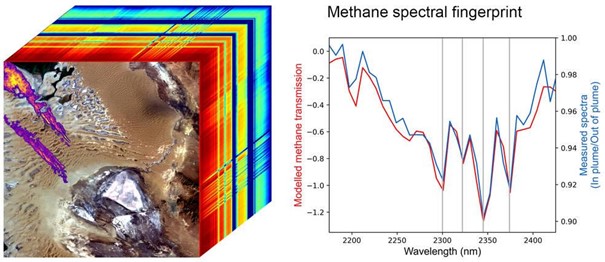
The cube (left) shows methane plumes over Turkmenistan. The colors of the rainbow are spectral fingerprints from the corresponding locations in the front image. The blue line in the graph (right) shows the detected EMIT methane fingerprint; the red line is the expected fingerprint based on atmospheric simulation. Credit: NASA/JPL-Caltech
NASA’s New Earth Space Mission
Initially, NASA’s Earth Surface Mineral Dust Source Investigation (EMIT) mission was intended solely to map the distribution of key minerals in the planet’s dust deserts. However, EMIT has demonstrated that it can also detect the presence of methane. In data that EMIT has collected since its installation on the International Space Station in July, the science team has identified more than 50 “super-emitters” in Central Asia, the Middle East and the southwestern United States. The newly measured methane hotspots – some previously known and others recently discovered – include extensive oil and gas facilities and large landfills. “This exciting new development will not only help scientists better determine where methane leaks are coming from, but also provide insight into how they can be remedied,” NASA Administrator Bill Nelson said. “The International Space Station and NASA’s more than two dozen satellites and instruments in space have long been invaluable in determining climate change on Earth. EMIT is proving to be a key tool in our toolbox to measure this potent greenhouse gas – and stop it at the source.”
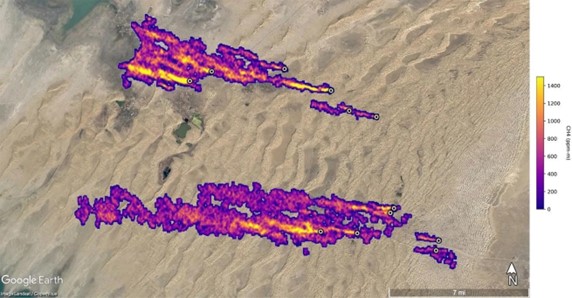
Orbiting the Earth every 90 minutes from its location aboard a space station about 400 kilometers high, EMIT is able to scan vast stretches of the planet tens of kilometers in diameter, while focusing on areas as small as a soccer field. “Some of the plumes EMIT detected are among the largest ever seen – unlike anything that has ever been observed from space,” said Andrew Thorpe, a Jet Propulsion Laboratory (JPL) research technologist leading the methane studies. An example is a cluster of 12 plumes from oil and gas infrastructure in Turkmenistan, with some plumes extending more than 32 kilometers. Scientists estimate that Turkmenistan’s plumes collectively eject methane at a rate of 50,400 kilograms per hour, rivaling the peak flow from the 2015 Aliso Canyon gas field explosion near Los Angeles, one of the largest accidental methane releases in U.S. history.
Super-emitters in Turkmenistan – 12 plumes of methane flux. The plumes were detected by NASA’s Earth Surface Mineral Dust Source Investigation mission, and some of them extend for more than 32 kilometers. Source: NASA/JPL-Caltech
“As we continue to explore the planet, EMIT will look at places where no one thought to look for greenhouse gas emitters before, and find plumes that no one expects,” Robert Green, EMIT’s principal investigator, said.
Organizations and start-ups supporting methane detection
There are several organizations and startups that focus on detecting emissions of harmful greenhouse gases and super-emmiters, including methane. Importantly, all of them use their specialized satellites for this purpose. Worth highlighting here are:
GHGSat – satellites from a private company offering data for the oil, gas, coal mining, waste management, and financial and public institutions sectors, as of 2016.
MethaneSAT – a satellite funded by the US NGO Environmental Defense Fund and the New Zealand Space Agency.
Carbon Mapper – a public-private project of NASA’s Jet Propulsion Laboratory.
GeoCarb – geostationary satellite, a joint initiative between NASA and the University of Oklahoma, among others, scheduled for launch in 2023.
Copernicus Sentinel-5 Precursor – a satellite of the European Space Agency and the European Commission.
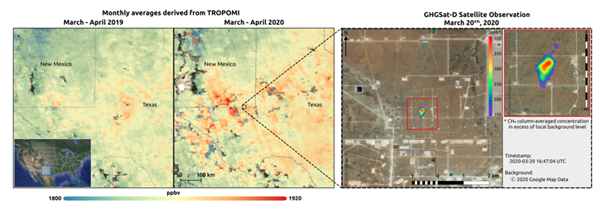
To obtain precise information about the location of an emission point, each company uses its own methods, and combines available technologies. For example, the SRON and GHGSat research teams have been working since early 2019 to detect methane hotspots. The SRON team uses data from the Copernicus Sentinel-5P satellite to detect super-emitters on a global scale. The GHGSat team then uses data from the GHGSat satellites to quantify and attribute emissions to specific sites around the world. Their work has led to the discovery of several new hot spots in 2020, such as above a coal mine in China. The team also detected methane emissions over the Permian Basin, the largest oil-producing region in the United States.
Another method was to combine data from two missions: Copernicus Sentinel-5P and Sentinel-2 using artificial intelligence algorithms. As a result, Kayrros specialists detected 13 methane emission events in 2019-2020 along the Yamal-Europe pipeline, which runs through Russia, Belarus, Poland and Germany, over a distance of 4196 kilometers. They also estimated that one leak dumped as much as 93 tons of methane every hour.
Both findings confirm the need for constant emissions control. Undetected methane leaks from the energy industry are a global problem – and a serious one. A lot of useful data is available for anyone interested in doing their own analysis. Companies like UP42 are also helping to raise environmental awareness by distributing environmentally important data – available to anyone.
Conclusions
When one hears about global warming, by far the most prevalent material is about the fight against carbon dioxide. However, reducing methane emissions is also very important, because methane has a stronger warming effect in the short term than CO2, and reducing methane emissions would have a more direct effect on the climate. Methane accounts for about 30 percent of the increase in global temperature since industrialization, and emissions rose to record levels for the second year in a row last year. In addition, super-emitters can increase emissions by as much as dozens of times, relative to average emitting facilities or equipment. This is therefore a huge problem for both the environment and us humans. The only way to stop this process is to limit emissions. But the key here is control and accurate detection of super-emitters. Satellite technology, which has been active in this area for several years and is constantly developing in the industry, is invaluable here. It is only with the use of EO that we are able to control the changes taking place around the world so quickly and virtually in real time.
Did you like the article? Read more and subscribe to our monthly newsletter!

#Categories


Next article
Editor’s note: This article was written as part of EO Hub – a journalistic collaboration between UP42 and Geoawesomeness. Created for policymakers, decision-makers, geospatial experts and enthusiasts alike, EO Hub is a key resource for anyone trying to understand how Earth observation is transforming our world. Read more about EO Hub here.
Ever since the Explorer 6 satellite captured the first image of Earth in 1959, organizations have been finding ways to exploit and add value to Earth Observation (EO) data. Although still described as ‘emerging’, the sector has seen significant growth in recent years, and is now a booming market, with EO data being used to monitor land, sea and atmospheric factors; and finding numerous applications, from agriculture and the environment to logistics and security.
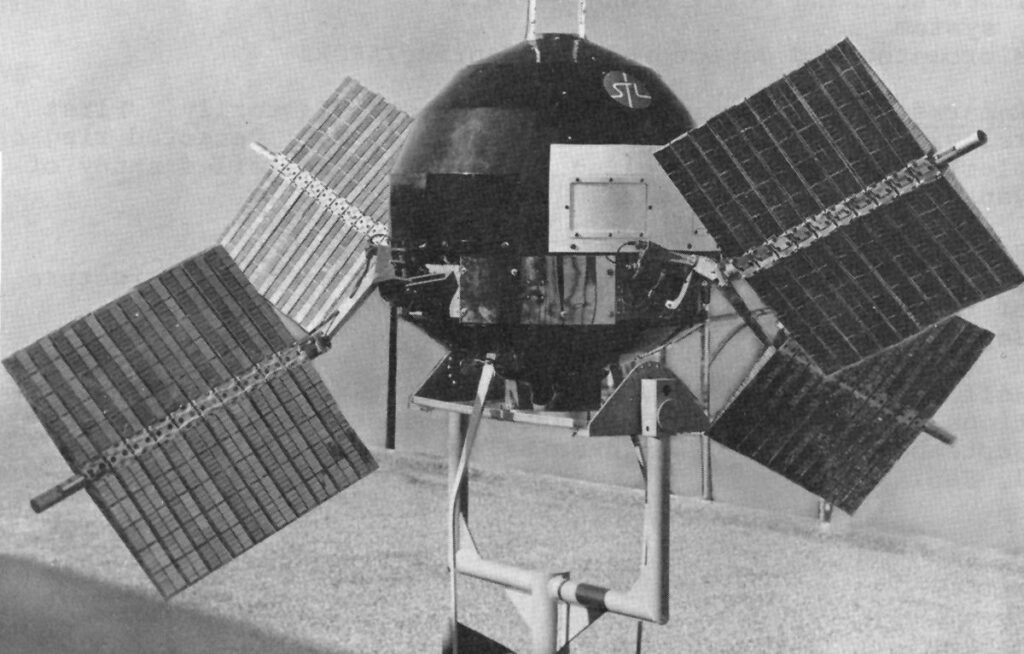
Explorer 6 — photo from NASA
The market is expected to grow even more rapidly over the coming decades, in part due to recent technological breakthroughs regarding data collection and storage, as well as new business models, including online data marketplaces and cloud infrastructure to process data. However, the single most important factor has been unlocking the bottleneck right at the beginning of the EO ‘value chain’: the initial cost of launching a satellite into space.
Understanding the EO value chain is critical in providing context, from explaining how the industry got to where it is today to predict where it is headed next.
Defining the Earth Observation value chain
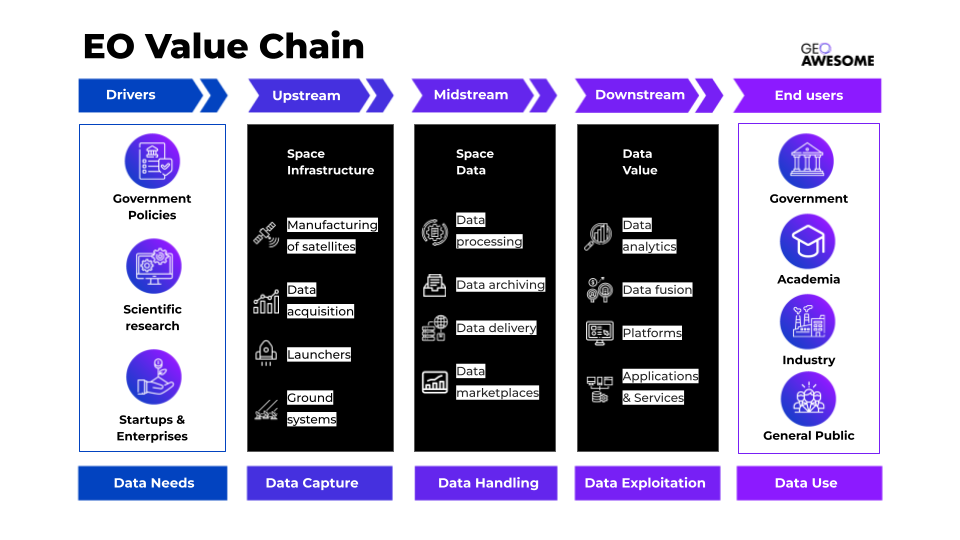
When it comes to the EO industry itself, the core value chain can be divided into three main segments: upstream, midstream and downstream.
The upstream component encompasses data capture. In practice, it refers to the manufacturing and operation of satellites, also covering the launch and ground systems and any other relevant space infrastructure.
The EO midstream is all about data handling. This effectively means how data is received by the ground infrastructure, then how it is stored, pre-processed, catalogued and archived. Midstream also involves data distribution and delivery through EO marketplaces like UP42, among others.
Downstream is where data is exploited—or, in other words, has value added to it, by being processed and converted into products, applications and services. This involves big data and analytics, and will often mean integration with other sources of data.
To paint the full picture, we should also include initial drivers and end users. The market is driven by scientific analysis and R&D, as well as government policies and the mandates of individual agencies and departments. End users at the end of the chain are critical elements, as they are generating the demand for the sector to grow in the first place. In recent years, we are seeing an interesting shift. It is no longer the reserve of the military and science; we are now seeing governments, academia, industry and even the general public as customers for EO products.
The evolution of the Earth Observation value chain
We are currently witnessing a rapid evolution of the EO value chain, with three main drivers: broad technological development, an increasing need to monetize that technology beyond its traditional applications in the military and government, and the entrance of new players into the market.
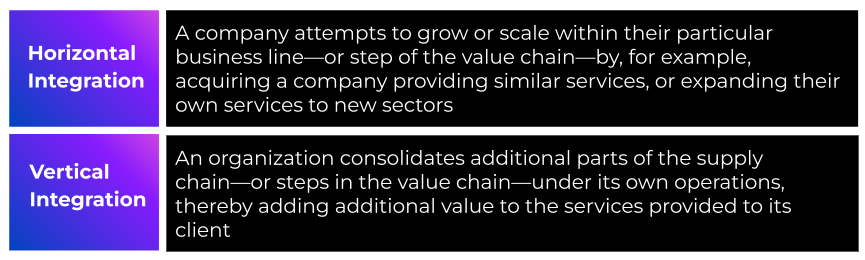
As a result, there are currently multiple examples of both horizontal and vertical integration occurring in the EO market. Understanding where and why this is happening plays a major role in analyzing how the EO sector operates and where its future lies.
Downstream, there has been an explosion in the number of independent startups who are providing niche data analytics services; partnering with large satellite operators or marketplaces to access their enormous archives and then processing the data for clients. Many of these, like LiveEO, Orbital Insights, and Satelligence, are integrating horizontally as they expand their offering to new sectors. Orbital, for instance, now focuses on retail, finance, insurance and defense
Upstream, on the other hand, many satellite manufacturers are in the process of vertical integration. In theory, the aim is to simplify the way that clients purchase, extract, and leverage their data, but from a business point of view it’s about capturing a higher share of value. Planet, for example, is expanding its data processing and analytics capacities with the hope of adding both value and differentiation to its offering, by providing basic tools including change detection, object classification, and more. Another example is Maxar. Back in 2016 the satellite data giant acquired geospatial analytics company Radiant Group, with the aim of strengthening their presence in the intelligence field, especially in the US.
Some large incumbents are integrating both vertically and horizontally. For example, since the early 2000s, Airbus has been investing in the development of the Farmstar platform to capture the agricultural market. In doing this, Airbus is expanding their offering across the value chain right the way to the downstream, by creating software which enables end clients to easily access and analyze the data from their Pleaides and SPOT constellations. At the same time the company has been involved in multiple SAR and optical satellite projects.
Vertical integration is currently the topic of much discussion within the industry. It certainly has advantages, creating customer loyalty and providing the end client with easy access to data. It can also be cost-effective:
However, for the industry more broadly, there are also downsides to vertical integration. There is an argument that satellite manufacturers, for example, should focus on their core business offering of data capture and allow other companies to create solutions which add value. If a satellite operator provides additional services, it is able to offer the data itself at a discounted price, whereas a startup has less flexibility, as it needs to buy the data and then offer analytics on top.
By incorporating data analytics, satellite manufacturers tend to close down opportunities, blocking the market for new entrants and, in a way, cannibalizing their own market. Additionally, from a customer point of view, buying data directly from the satellite operator is likely to restrict clients to a given ecosystem of data and solutions rather than giving them the flexibility of choice.
The importance of the midstream
The midstream has the potential to provide balance to the EO value chain: Marketplaces and data handling solutions provide a service to the upstream value chain players (the satellite operators) by expanding the market for their data, whilst also serving the downstream value chain by making the data more affordable, accessible and practical, so downstream companies can build their own solutions for clients.
Open access programs—like the EU’s Copernicus and NASA’s Landsat—have made EO data freely available to both end users and downstream operators. However, the data from these programs is only of low–medium resolution, and it, therefore, has limited applications. EO data marketplaces like UP42, on the other hand, provide access to high-resolution data, as well as the infrastructure and capacity to process and analyze it.
Marketplaces such as UP42 integrate multiple data providers, including Airbus, Capella Space, and more. This ensures that clients are not limited to a single vendor but are able to take advantage of whichever provider best suits their requirements—adding huge value when it comes to analysis of the data. UP42 is also integrated with Esri, and other significant geospatial software providers; this increase in advanced analytical service integrations will also provide huge value to end users.
This data democratization enables companies across the value chain to expand horizontally; it allows satellite companies to focus on making the best satellites and win the market by having the best data, and allows startups and companies that build data solutions and analytics to do just that, rather than spending energy on solving problems around access to data and data processing. As a result, it accelerates innovation—which in turn brings significant growth to the whole industry.
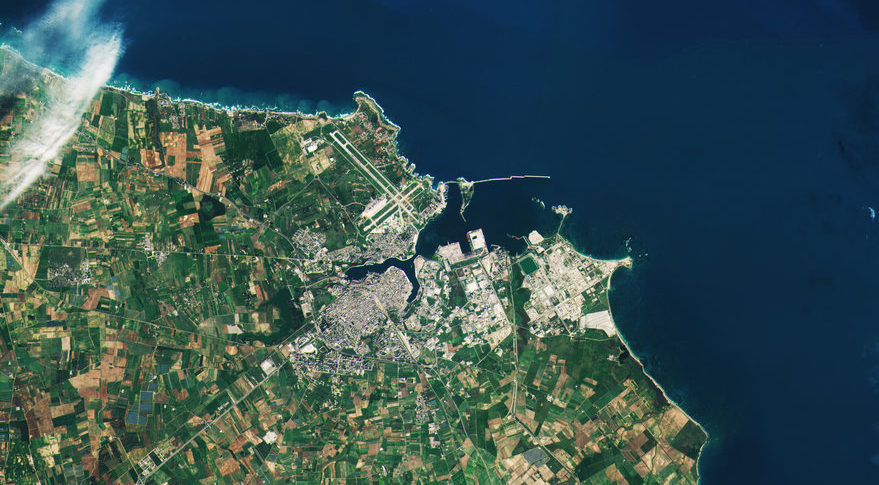
Satellite image from UP42 platform
Big Tech and EO
One more major development that shouldn’t be overlooked isthe arrival of Big Tech on the EO scene. Digital titans like Amazon (with Amazon AWS) and Google (Google Cloud) began by offering data storage and cloud computing services to players at every stage of the value chain, and are now investing in additional functionalities.
In partnership with Capella Space, Amazon has launched AWS Ground Station, a service which enables clients to “control satellite communications, process data and scale operations”, all without the hassle of creating their own ground station infrastructure.
Google, meanwhile, has been integrating vertically in both directions, investing in satellites and providing data to end users: Having recently acquired an equity stake in Planet, the digital giant has now also secured a multi-year deal to buy EO data from Planet for use in its own services, including Google Maps and Google Earth Engine.
A collaborative ecosystem for a better future
The role already played by Earth Observation data in our society cannot be underestimated, but there is still tremendous opportunity for improvement.
When it comes to EO data, each segment of the value chain (upstream, midstream, and downstream) brings the information held within the data closer to its end user. A value chain perspective is hugely useful in recognizing the interconnectivity of different parts of the EO ecosystem—it helps define how individual pieces of the industry fit into the larger whole.
There is an increasing availability of EO data and processing infrastructure, not only provided by satellite companies themselves but also by marketplaces like UP42 and tech giants including Google. A healthy ecosystem is essential in providing an environment where new entrants can explore new ways to harness the power of EO data. Through collaboration, horizontal integration, and fostering interoperability, access to data can become even more widespread—and EO can thus play a critical role in helping humanity.
Did you like the article? Read more and subscribe to our monthly newsletter!