How are Satellites Used to Observe the Ocean?

Editor’s note: This article was written as part of EO Hub – a journalistic collaboration between UP42 and Geoawesomeness. Created for policymakers, decision makers, geospatial experts and enthusiasts alike, EO Hub is a key resource for anyone trying to understand how Earth observation is transforming our world. Read more about EO Hub here.
As humans, we really do tend to take the oceans for granted. They cover 71% of the Earth’s surface and provide over half of all the oxygen that this planet produces. And yet, for such an important resource, only about 20% of the sea bed has been mapped in detail thus far. This points to an immense amount of potential for discovery – especially when we consider the wide-ranging implications that oceans have on climate, biodiversity, human flourishing, and more.
That’s why it’s incumbent on us to do a better job of monitoring, mapping, and tracking the oceans – across a wide variety of different factors. Doing this well can help us keep on top of issues like climate change, environmental protection, protection of endangered species, and the health of seaside towns and cities. This is challenging, of course, because of their scale and remoteness – but that’s where satellites are so useful. Whether we are trying to measure depth (bathymetry), color, circulation, sea ice, sea surface height, temperature, or weather – satellites offer us a way of doing this precisely and accurately without having to actually be on the water ourselves.
A History of Ocean Observation from Space
Satellites have played a key role in oceanography for more than 40 years now dating back to the very first project called ‘The Coastal Zone Colour Scanner’ in 1978. This project was the first time we had used a satellite for measuring the ocean’s color and it was the first proof of concept that such an audacious goal could be achieved.
It would take until 1997 for the next project to be launched – this time the Sea-Viewing Wide Field-of-View Sensor (SeaWiFS) that truly kickstarted the industry in the modern era. From there, the world of oceanography leveraged the huge jump in active satellites and began to discover more and more use cases for monitoring and protecting ocean ecosystems. Over time, the spatial, spectral, and temporal resolution of the satellite data improved, allowing us to do more and more with the data we were collecting.
Fast forward to today and satellites play an invaluable role in this endeavor and continue to grow in importance as the technology accelerates.
Key Applications for Ocean Satellites
For a sense of how useful and wide-ranging these satellites can be, let’s explore some of the key applications that are currently being utilized by clients around the world:
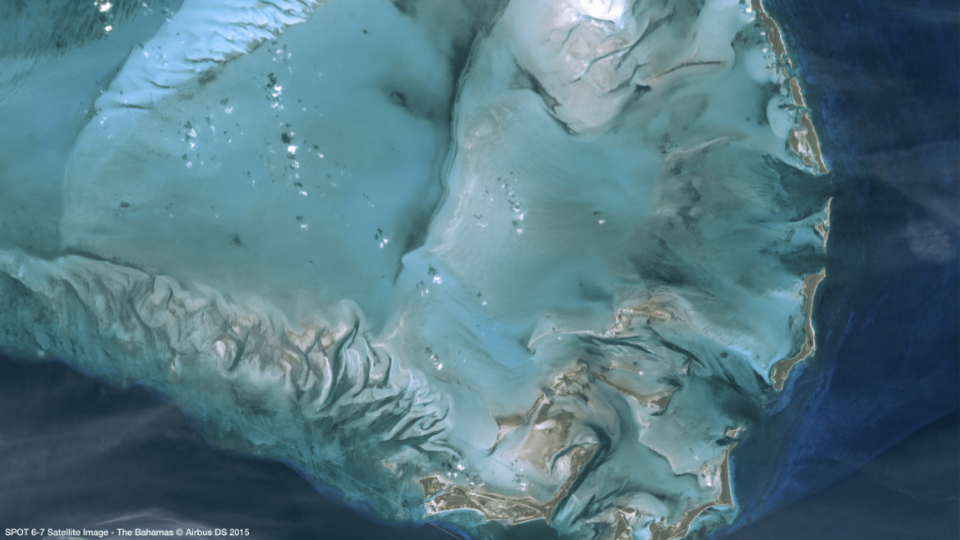
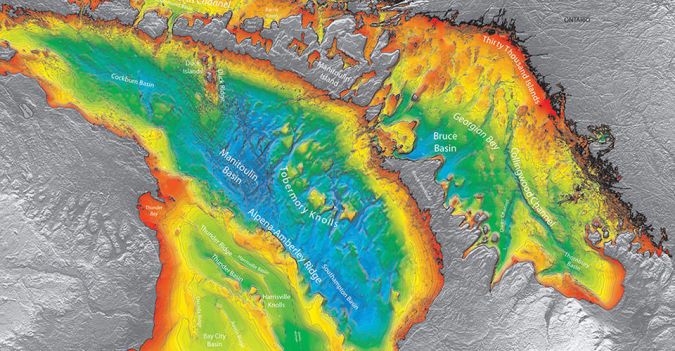
Bathymetry
Measuring ocean depth is a key factor in understanding how climate is affecting our ocean levels and the ecosystems that inhabit them. Satellite radar altimeters enabled the creation of the first global sea floor depth models. These were modeled indirectly by measuring the inversion from gravity. The underwater topography such as sea mountains adds extra pull to Earth’s gravitational field, drawing more water around them and bulging the sea surface outward. This is very useful for generic mapping and is used extensively in applications such as Google Earth and others. Then, on the coast, satellite-derived bathymetry which is based on optical satellite data provides a lot of value. By studying the color profile and spectral signatures of near-shore areas augmented by satellite data, we can arrive at incredibly accurate estimations even at a depth of 30m. The higher the resolution of the data the better here, but even at low resolution there is value to be found. Satellite-derived bathymetry is particularly important for the safety of navigation, hydrodynamic modeling, and coastal environmental monitoring and protection amongst other applications.
Sea Level Rise
This data is valuable as we assess the impacts of climate change. Rising sea levels are not just dangerous for luxury beachfront property but also for thousands of low-lying cities, towns, and villages around the world that are situated near the shores. In addition, unchecked sea level changes risk damaging wetlands, mangroves, and other important ecosystems that we should be striving to protect. NASA and ESA use radar satellites for these altimetry measurements and the outputs can be combined with data from coastal tide gauges and Argo floats – a global network of mobile ocean sensors that move up and down the water column. The combination of these gives us a holistic picture of sea levels that can then inform decision-making.
Measuring Sea Surface Temperatures.
Sea surface temperatures are crucial barometers for a range of different factors such as fish behavior, coral bleaching, weather, tracking predators, and so on. Temperature is also often the first sign of large changes in currents which can have compounding effects on everything else that we care about. The most common instrument used in the field is the Visible Infrared Imaging Radiometer Suite (VIIRS) which is aboard the NOAA/NASA Suomi NPP Satellite. This sensor captures temperature data on a daily basis, allowing scientists to craft maps that show how sea temperatures change over time across every region of the world.
source: NASA
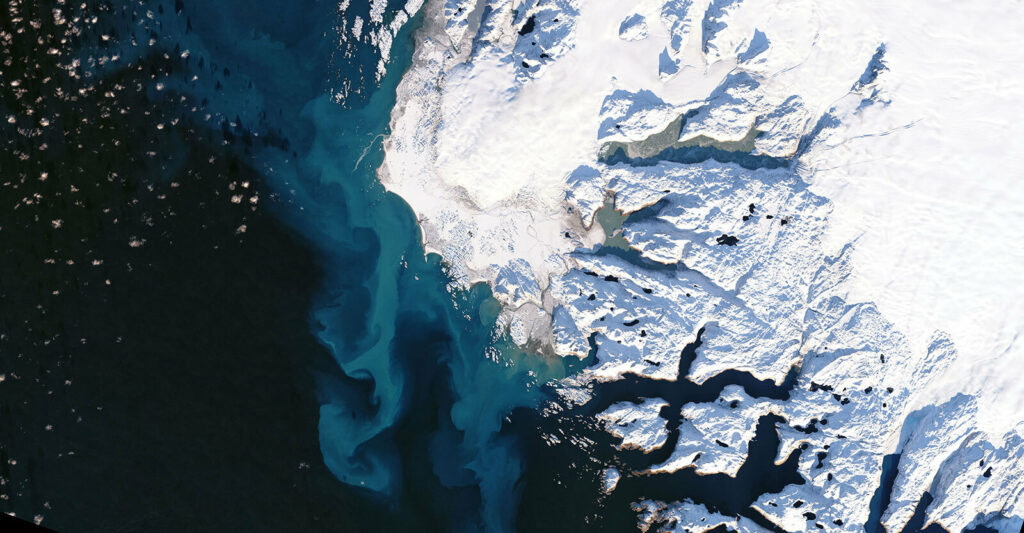
Measuring Sea Surface Color
Color is another valuable data type that satellites can collect for us – helping to identify algae growth, flood patterns, river plumes, and more. Having this information allows us to take proactive action such as dealing with harmful algae growth that may be contaminating shellfish and killing other sea creatures. Once again, the value is really in monitoring the subtle gradations in color over time, something that can only be accomplished through regular satellite information – and giving us the chance to see changes early so we can respond accordingly.
Weather Monitoring
Speaking of climate change, it’s also really important that we accurately measure and monitor the weather conditions that are continually unfolding across the globe. The ocean is one of the largest regulators of weather patterns and so it’s an inextricable component of large-scale weather monitoring. Satellites do a great job of measuring and reporting on this weather so that users of all kinds can pull timely and accurate weather data from a platform like UP42. This simply wouldn’t be possible otherwise and it’s a great reminder of how interlinked satellites are with our normal lives, even if we don’t realize it.
Regulatory Compliance
The climate data and sea level information gathered from satellites are key inputs for various regulatory bodies that seek to manage maritime navigation, coastal protection, coastal management, and other environmental risk reporting. As more rigor and scrutiny is required, satellite data offers an objective source of truth that can be the foundation of various practical risk mitigation strategies on a micro and a macro level.
Conclusions
These are just a few of the practical applications of satellites when it comes to oceanic observation, but it certainly isn’t an exhaustive list. This technology continues to transform how we see our oceans and it plays a significant role in how we manage the future of our planet.
As satellite technology improves, we’ll see more and more of this data coming into the public sphere – to inform our decisions and to bring more awareness to the issues that we face across our oceans. This is a conversation that desperately needs more mainstream attention, especially considering the downstream (pardon the pun) effects that play themselves out across the rest of society.
Understanding our oceans is a non-negotiable if we want to manage their power, conserve their resources, and deliver our earth to the next generation in a condition that is, at the very least, the same as we found it.
Did you like the article? Subscribe to our monthly newsletter:

#Data type

Next article
Beyond NDVI: What are vegetation indices, and how are they used in precision farming?
Editor’s note: This article was written as part of EO Hub – a journalistic collaboration between UP42 and Geoawesomeness. Created for policymakers, decision makers, geospatial experts and enthusiasts alike, EO Hub is a key resource for anyone trying to understand how Earth observation is transforming our world. Read more about EO Hub here.
Farmers and agronomists tend to be very practical, hands-on people. What they want, above all, is full awareness of the situation in their fields: are there any diseases affecting their plants? Are the plants sufficiently watered? Are they fertilizing effectively and efficiently? If a grower is dealing with an area covering dozens of hectares, it can be very difficult to keep track of the relevant details with field visits and ground sensors alone.
This is where vegetation indices come in. Vegetation indices are a remote sensing technique that can be used to identify vegetation and measure its health and vitality—and they are becoming an increasingly important parameter within crop development analytics, enabling analysis at a local, regional, country-wide or even global level. On the largest scale, vegetation indices may show global trends which can influence policy, inform global aid support and help to prepare for food supply challenges, whereas on the most localized level, they can provide detailed data for individual growers, to help better understand the health of specific parts of a field—or even specific plants.
How do vegetation indices work?
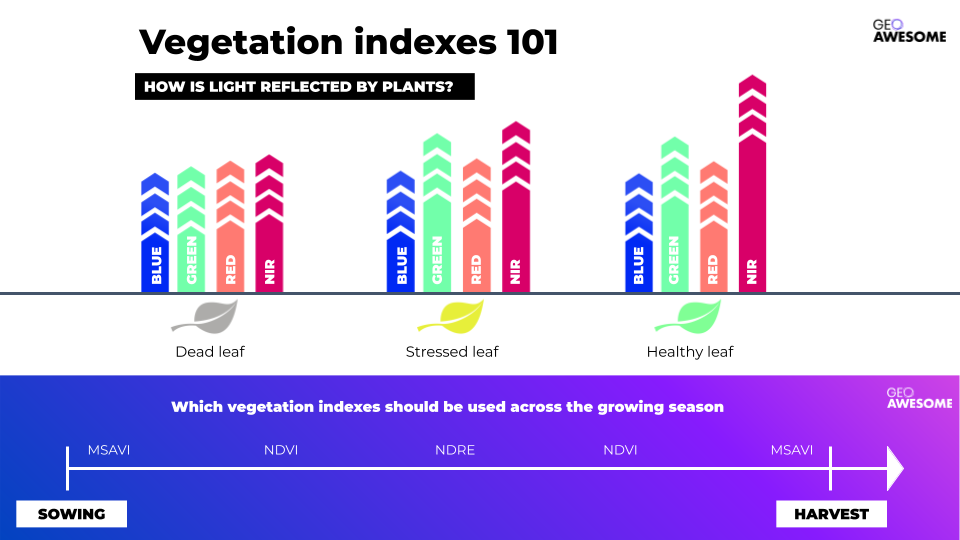
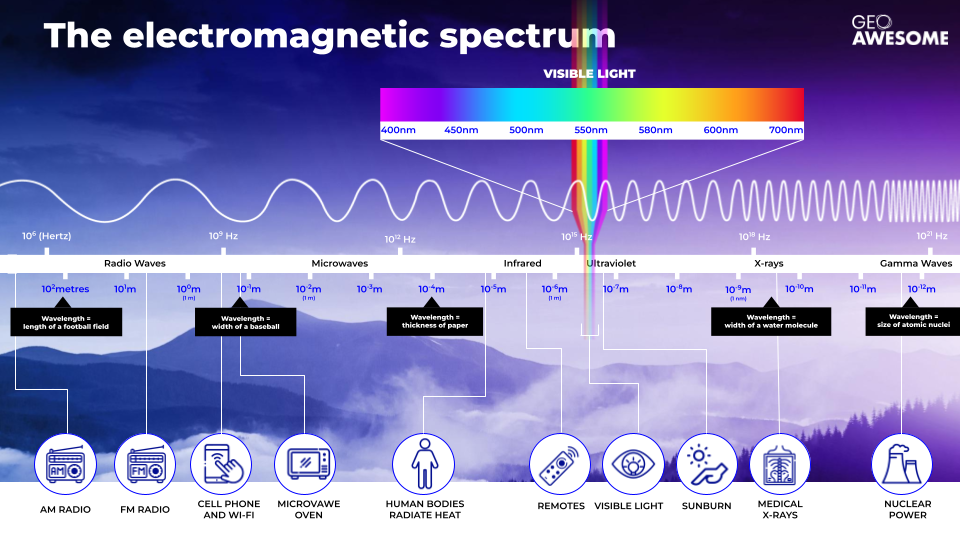
Visible light—the light that reflects off objects and enables us to see them with the human eye—is part of the electromagnetic spectrum; specifically, wavelengths between around 400–700nm. The wavelengths either side of visible light are ultraviolet (UV) and infrared rays.
Plants absorb some of this light, and use it to grow, through the process of photosynthesis. Vegetation indices work by analyzing the light which is not absorbed, but instead reflected off the leaves, using this information to detect plantsand evaluate their condition. Broadly speaking, healthy plants (those rich in chlorophyll) reflect more near-infrared (NIR) and green light than those with stressed or dead leaves.
The concept itself is straightforward, and the output from vegetarian indices is relatively easy to interpret: typically, it will be presented in the form of a heatmap, where green color shows healthy vegetation and a red color indicates less healthy plants. This ease of use is one of the reasons that vegetation indices are so widely used in agriculture.