Beyond NDVI: What are vegetation indices, and how are they used in precision farming?

Editor’s note: This article was written as part of EO Hub – a journalistic collaboration between UP42 and Geoawesomeness. Created for policymakers, decision makers, geospatial experts and enthusiasts alike, EO Hub is a key resource for anyone trying to understand how Earth observation is transforming our world. Read more about EO Hub here.
Farmers and agronomists tend to be very practical, hands-on people. What they want, above all, is full awareness of the situation in their fields: are there any diseases affecting their plants? Are the plants sufficiently watered? Are they fertilizing effectively and efficiently? If a grower is dealing with an area covering dozens of hectares, it can be very difficult to keep track of the relevant details with field visits and ground sensors alone.
This is where vegetation indices come in. Vegetation indices are a remote sensing technique that can be used to identify vegetation and measure its health and vitality—and they are becoming an increasingly important parameter within crop development analytics, enabling analysis at a local, regional, country-wide or even global level. On the largest scale, vegetation indices may show global trends which can influence policy, inform global aid support and help to prepare for food supply challenges, whereas on the most localized level, they can provide detailed data for individual growers, to help better understand the health of specific parts of a field—or even specific plants.
How do vegetation indices work?
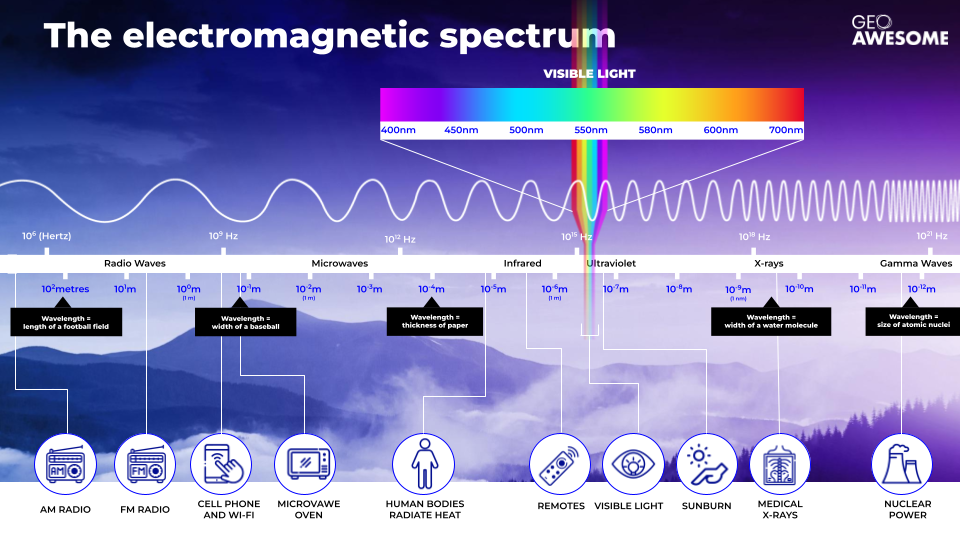
Visible light—the light that reflects off objects and enables us to see them with the human eye—is part of the electromagnetic spectrum; specifically, wavelengths between around 400–700nm. The wavelengths either side of visible light are ultraviolet (UV) and infrared rays.
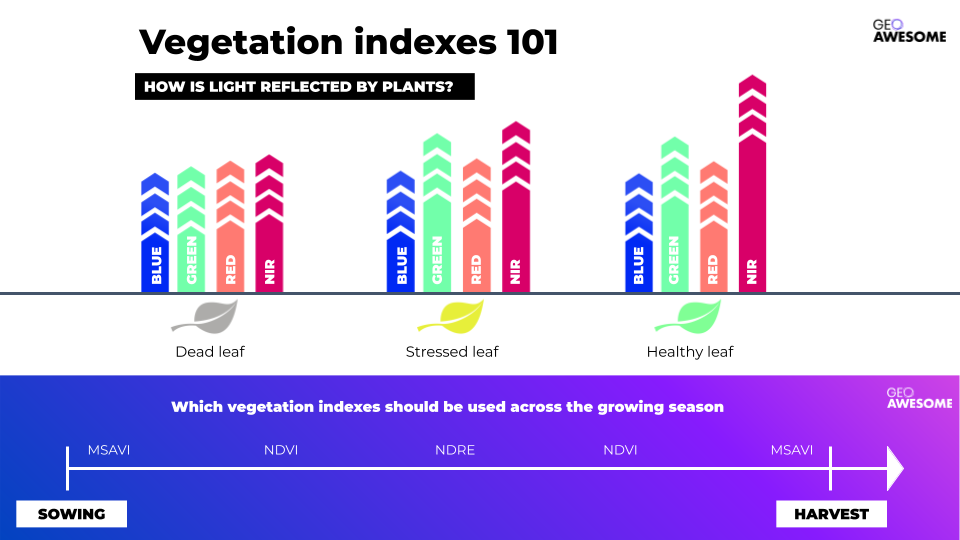
Plants absorb some of this light, and use it to grow, through the process of photosynthesis. Vegetation indices work by analyzing the light which is not absorbed, but instead reflected off the leaves, using this information to detect plantsand evaluate their condition. Broadly speaking, healthy plants (those rich in chlorophyll) reflect more near-infrared (NIR) and green light than those with stressed or dead leaves.
The concept itself is straightforward, and the output from vegetarian indices is relatively easy to interpret: typically, it will be presented in the form of a heatmap, where green color shows healthy vegetation and a red color indicates less healthy plants. This ease of use is one of the reasons that vegetation indices are so widely used in agriculture.
How do you like to article so far? Support our blog by subscribing to our monthly newsletter!
NDVI: A half-century of vegetation analysis
The best-known vegetation index is the Normalized Difference Vegetation Index, or NDVI. Developed in the 1970s, the technology takes advantage of what was at the time a breakthrough in earth observation data: the multispectral data provided by Landsat-1. Despite its 50-year history, NDVI has experienced a boom within the last decade, due to the increased availability of open satellite data—including the Sentinel constellation from 2014 onwards—together with the growing popularity of drone technology, combining to democratize earth observation.
Specifically, NDVI works by comparing red and NIR light to identify the amount of chlorophyll in leaves. Initially it was used simply to detect the presence of vegetation—and NDVI remains one of the most widely used indices for detecting plant canopies using remotely-sensed multispectral data—but the technology was quickly adopted to quantify ‘photosynthetic capacity’, a key indicator of plant health.
The primary disadvantage of NDVI is that the index reaches high ‘saturation’ relatively quickly—effectively, as soon as the field is covered by healthy, reflective leaves, the NDVI will be at a very high level. This naturally makes it a good indicator of plant health and biomass, but it lacks subtlety when it comes to warning signs early in the growing season and vegetation changes late in the season.
Beyond NDVI
Given the limitations of NDVI, and to avoid misinterpretation of results, online farming platforms provide agronomists with a wide range of other vegetation indices to complement NDVI. Some of the most popular ones include:
Modified Soil Adjusted Vegetation Index (MSAVI)
MSAVI is a variation on the Soil Adjusted Vegetation Index (SAVI). Both indexes are designed to mitigate the effects of soil on light analysis, making them more sensitive in circumstances where there is a high percentage of bare soil, scarce vegetation, or low chlorophyll content—all instances where NDVI struggles to provide accurate measurements. MSAVI is therefore most useful for monitoring crops in the first months following sowing.
Normalized Difference Red Edge (NDRE)
Another popular vegetation index, NDRE works by analyzing ‘red edge’ light—the narrow band of the visible light spectrum where red becomes NIR. It’s particularly sensitive to chlorophyll content, changes in leaf area, and the effect of soil in the background. It can measure the NIR light which has penetrated through to the lower part of the canopy, and is therefore ideal for analyzing the health and vigor of mid- and late-season crops, when the leaves have accumulated high levels of chlorophyll. NDRE can also be very helpful for determining the relative nitrogen content of crops, independent of the quantity of nitrogen in the soil.
Canopy Chlorophyll Content Index (CCCI)
CCCI analyzes the relative levels of reflected red, red edge, and NIR light, and is used to estimate the amount of nitrogen—a key component of chlorophyll. By correlating CCCI with tissue samples from crops, farmers are able to accurately estimate the nitrogen (N) variation of across a field. This method can provide information on N levels much earlier in the growing season than other indices, which helps growers to fertilize more precisely and efficiently.
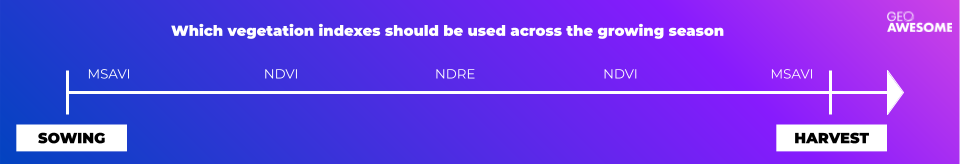
Each vegetation index has a different sensitivity, and therefore they should be applied at different stages in the growth cycle: MSAVI is applied in early stages, when there is limited leaf coverage; NDVI during the period of rapid growth; then NDRE at later stages when leaf coverage is fuller. It can then be useful to return to NDVI and finally MSAVI again as foliage decreases and the crop transitions to ‘senescence’.
How do farmers use vegetation indices in practice?
The tools above are just a small sample of the many vegetation indices which can help farmers understand different parameters of crops or soil, including nitrogen variation, moisture levels, and more. Farmers can access and calculate these indices via farm management platforms, GIS tools, or satellite data and algorithm marketplaces such as UP42, where multiple complex vegetation indices such as NDVI, NDWI (Normalized Difference Water Index) EVI, and MSI (Moisture Stress Index) are all available.
However, the increasing popularity of vegetation indices can also lead to a misconception that reflectance values are the definitive measure of vegetation health. This is not the case, and researchers are keen to point out that a vegetation index is a qualitative measurement, rather than a quantitative one. Furthermore, a similar output may mean a completely different thing for two different fields.
Data-driven farms should therefore use multiple indices to analyze the performance of their crops through the season, and integration with other sources of data is key in avoiding misinterpretation. It’s only once these additional data layers are applied that the true meaning of a vegetation index can be understood. An example might be a field in which NDVI indicates underperformance in two separate areas. Without additional data, the assumption may be that the cause of this is the same in both areas. However, other data sources can reveal different issues, including erosion, moisture, or nutrient content.
Fortunately, farmers and agronomists are traditionally hugely risk-averse. They know that one poor decision can have devastating effects on yields. As a result, most agronomists—those who are progressive enough to use vegetation indices at all—will not implicitly trust the data on its own. They will verify the data in person, physically going to the field to inspect the areas, and overlaying the satellite data with other data layers including soil samples and elevation data.
Indeed, knowing how to interpret and apply the data is often more important than the type of camera used to capture it. And of course, vegetation indices do not eliminate the job of the agronomist, as the most important factor in interpreting the data is understanding the physiology of the plant itself. Vegetation indices are useless unless they are used by someone who understands the data, but also the plant, the soil, and the wider environment.
What’s next for vegetation indices?
Researchers, data scientists and agronomists are constantly searching for new formulas that can provide much needed information on crop performance. In some cases, farmers are even looking to create their own custom indices, and some companies already provide index calculators that meet this need. If someone has a thorough understanding of both the physiology of their plants and the data, they can customize an index to answer their specific questions.
There’s also potential to be mined in Synthetic Aperture Radar (SAR). SAR is very well understood by the agriculture industry, and embraced for its ability to penetrate cloud cover, but currently it’s used on a fairly broad level. The fact that it can provide data from below leaf canopies holds great promise for more specific indices.
Finally, the drone industry can offer a different perspective, as the imagery is captured from closer to the ground, with fewer atmospheric factors to contend with. There is therefore less pre-processing and correction needed, and the image resolution is much higher, meaning drone data can potentially be used to more accurately calculate an ‘absolute’ reflectance value from which all the ‘relative’ indices are calculated. Additionally, centimetre level resolution means that it can be observed and calculated with much higher level of detail, even for an individual plant.
Interestingly, very-high resolution satellite data such as Pléiades Neo with 30cm GSD also opens a wide range of possibilities to analyze the conditions of individual plants. Such data are particularly useful for high-value crops like vineyards and olive orchards, which are now facing increasing challenges of drought, so farmers need to use water resources in a far more efficient way.
Combining this ultra-targeted information with more generic overview coming from open satellite imagery may well provide farmers with that perfect combination of data that they seek. Such scenarios are getting more and more feasible with the wide availability of open and commercial satellite data via easy to use marketplaces such as UP42.
Vegetation indices—a vital part of a modern, digitalized farm
There is a whole world of vegetation indices available to the agriculture industry, going way beyond NDVI. In practice, even regular RGB or true color maps will give an agronomist highly relevant information—and very often there is a clear correlation between NDVI and RGB data. Each additional data source can be another powerful instrument in the agronomist’s toolbox, helping them to make informed decisions on the farm.
However, vegetation indices are not absolute values; they are indicators of the health and condition of a plant. To truly understand the information, and to use it for more detailed analysis of crop performance, farmers should combine vegetation indices with other data layers, including elevation models and soil samples. And of course, to make the most effective use of vegetation indices, a farm needs to be operating digitally already—this means using farm management software, variable rate spraying machines, and digitalized processes across the board.

#Data source

Next article
The New Elevation Product From Airbus is Set to Offer DEM with 0.5m Resolution
The geospatial community has been buoyed by continual improvements in the quality of satellite data which allows users to look at the world from a completely different perspective. The accelerated innovation has opened the doors for very high-resolution data that unlocks a whole new range of new applications. A great example is the new Pléiades Neo data from Airbus that we’ve covered previously here on the blog.
This type of high-resolution satellite imagery allows us to not only have a 2D view of the entire globe, but it also allows us to piece together multiple images to create sophisticated 3D models using the principles of photogrammetry.
Introducing DEM Airbus
Airbus’ Elevation Portfolio offers a large range of Elevation products from global off-the-shelf to local and on demand availability.
The so called WorldDEMTM, elevation models are based on Airbus radar satellites, TerraSAR-X and TanDEM-X. The WorldDEM products are fully functional off-the-shelf datasets covering the entire surface of the Earth, from pole-to-pole, in different resolutions up to 5m posting with WorldDEM Neo.
The on-demand Elevation products are created to use the wide range of Airbus satellite optical systems including Pléiades and Pléiades Neo. Therefore these products are at a much higher resolution and they are only purchased as and when needed – to take advantage of the most updated data possible. Up until now the on-demand Elevation data had three products based on Pleiades 50cm imagery– Elevation1 & 4 (with 1m and 4m resolution) and a 3D textured Model (3D mesh model with realistic fascades).
However, the company has now developed an exciting new 50cm resolution elevation product from Pléiades Neo which is set to transform the state of the industry once again.
Launching Elevation 0.5
Thanks to the launch of new Pléiades Neo 30cm optical satellites, Airbus is now in a position to offer 50cm resolution elevation models to users. This is the result of extensive R&D work that pushed the resolution and accuracy to an industry-leading standard that is unmatched by any other satellite data provider.
Comprehensive testing allowed the team to calibrate and validate the final resolution to 50cm and the relative accuracy to a level of 1m. The absolute accuracy is between 3m and 5m – thanks to a worldwide Airbus own reference database – but this can be further improved when a customer provides Airbus with additional ground control points, which may take it even under the 1m resolution threshold.
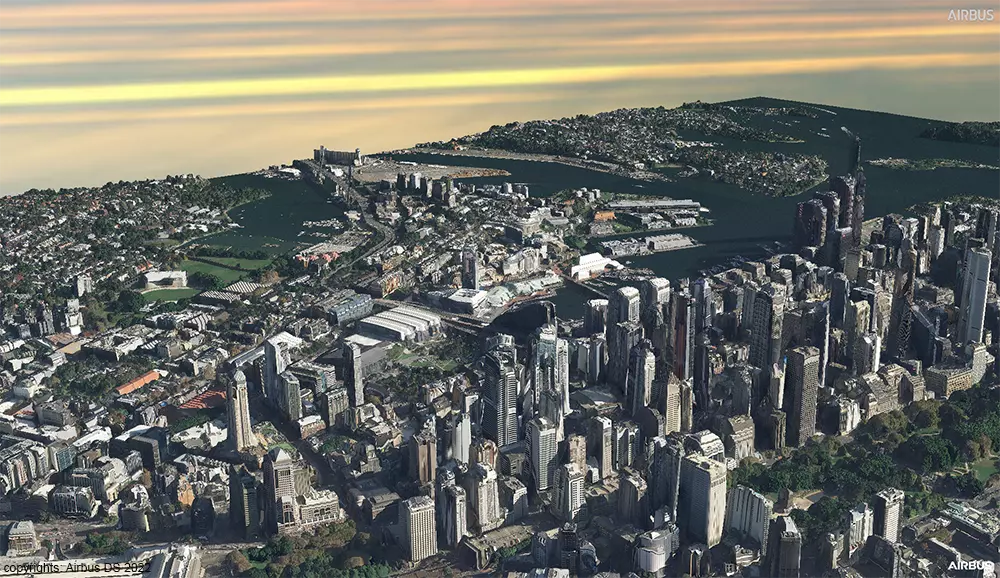
It’s worth noting though, that accuracy is not the be-all and end-all. In addition to this, the new 50cm elevation product offers exceptional 3D photorealistic quality. Objects such as trees and buildings are represented in a way that the industry simply hasn’t seen before – thanks to the leverage created on Airbus’ proprietary photogrammetric production process and algorithms.
After some tests run by early adopters, Airbus is ready to release Elevation 0.5 model to the market very soon.
How Does It Work?
Creating a digital elevation model of this kind requires multiple high-resolution satellite images that can then be combined using the principles of photogrammetry. It starts with measuring the conjugate points in your images which are then associated with ground control points to achieve the matching that you need. Then photogrammetry helps to solve for the 3D geo-referencing which can then create the model and visualization that you’re after.
To understand how Airbus’ production process works specifically, we spoke to the Head of Imagery Production at Airbus: Jean-Charles Pruvost. He explains that the process starts by defining the area of interest. Once this is determined, Airbus will check the topography and environment in that specific area so that the parameters can be correctly configured for the tasking team.
After this has been completed, the tasking team will take the necessary stereo or tri stereo images – typically being limited to 10-15 degrees if you’re looking at dense urban areas.
The duration of this part of the process – the editing step – is directly related to the size of the area of interest. A single Pléiades Neo image has up to a 14 km width, which is already huge, but it is possible to combine several images to cover very large areas!
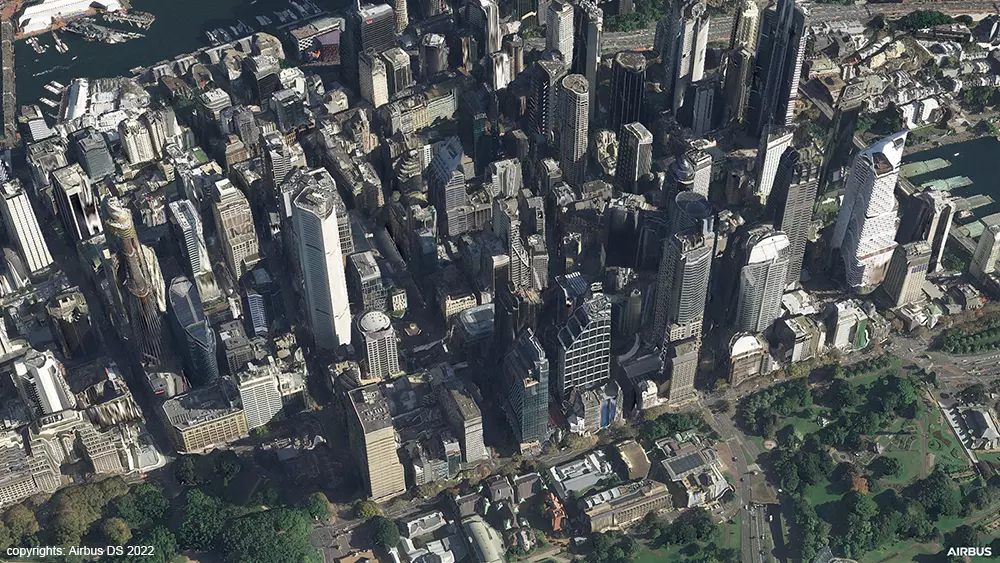
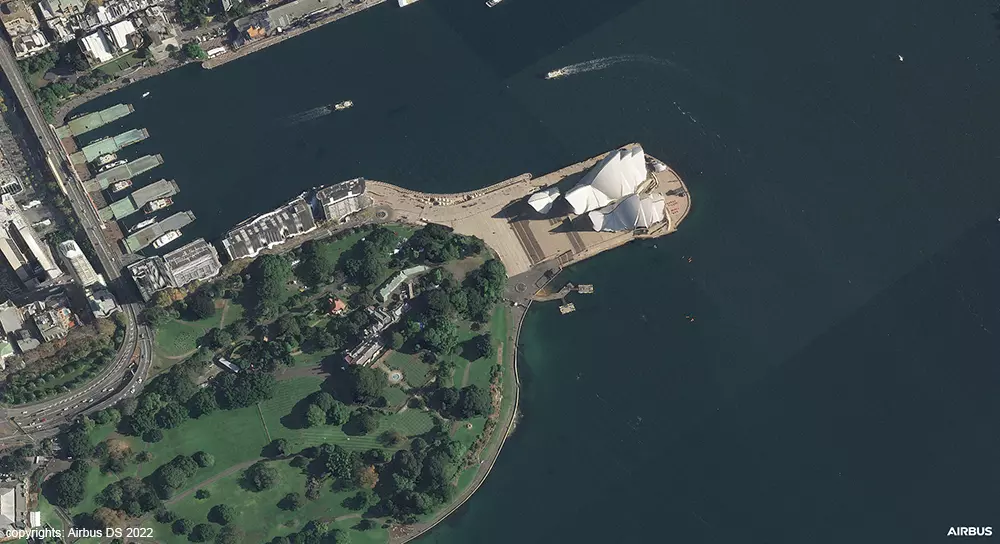
Airbus engineers will then adjust the images to reduce noise and ensure that the resulting 3D models are fair representations compared to the specification provided. Some of the samples that we’ve seen of these are simply astonishing. You can zoom in to roofs, buildings, and street furniture – to see a level of detail that is mind blowing.
copyrights: Airbus DS 2022
Applications and Use Cases
There is a range of exciting use cases that become possible with this level of resolution. While the focus of these models tends to be on digital terrain modelling and 3D visualizations, there are natural extensions, for instance, for the gaming and the defence industries. Some of these applications include:
- High precision weapon targeting and mission preparation in the military context.
- 3D stickers can be placed around airports and bases to handle low-altitude flights and other such considerations.
- Digital Twin visualizations to simulate plants, mining areas, and other Smart City concepts.
- Nuanced public visualizations to enhance wireless network projects, public transport implementations, and more.
- Analysis of solar energy potential on rooftops.
- Creating climate zone maps of urban areas, including urban heat islands and land use maps.
- Replacing the need for drone or aerial data in the mining industry.
- Monitoring the power grid or other similar assets over large areas.
- Improving farm management.
- Progress monitoring for the construction sector.
The applications here are vast and varied and as Jean-Charles Pruvost says: “It looks like a real game changer for the industry.” But as with many new technological breakthroughs, we’ll only truly understand the impact once users can experiment and push the boundaries of what is possible.
Conclusion
Elevation 0.5 represents an inflexion point for the satellite data industry, bringing a level of accuracy and photorealism that we have never seen before. It remains to be seen how this new technology will be utilized – but what is clear is that it opens doors to analyses and modelling capabilities that can transform the way we think about our world.
There is yet to be determined how pricing and product specifications will play out in the marketplace, but for those select clients who are currently in talks with Airbus – we look forward to seeing what is possible with a resolution of under one meter.
How do you like to article so far? Support our blog by subscribing to our monthly newsletter!
NDVI: A half-century of vegetation analysis
The best-known vegetation index is the Normalized Difference Vegetation Index, or NDVI. Developed in the 1970s, the technology takes advantage of what was at the time a breakthrough in earth observation data: the multispectral data provided by Landsat-1. Despite its 50-year history, NDVI has experienced a boom within the last decade, due to the increased availability of open satellite data—including the Sentinel constellation from 2014 onwards—together with the growing popularity of drone technology, combining to democratize earth observation.
Specifically, NDVI works by comparing red and NIR light to identify the amount of chlorophyll in leaves. Initially it was used simply to detect the presence of vegetation—and NDVI remains one of the most widely used indices for detecting plant canopies using remotely-sensed multispectral data—but the technology was quickly adopted to quantify ‘photosynthetic capacity’, a key indicator of plant health.
The primary disadvantage of NDVI is that the index reaches high ‘saturation’ relatively quickly—effectively, as soon as the field is covered by healthy, reflective leaves, the NDVI will be at a very high level. This naturally makes it a good indicator of plant health and biomass, but it lacks subtlety when it comes to warning signs early in the growing season and vegetation changes late in the season.
Beyond NDVI
Given the limitations of NDVI, and to avoid misinterpretation of results, online farming platforms provide agronomists with a wide range of other vegetation indices to complement NDVI. Some of the most popular ones include:
Modified Soil Adjusted Vegetation Index (MSAVI)
MSAVI is a variation on the Soil Adjusted Vegetation Index (SAVI). Both indexes are designed to mitigate the effects of soil on light analysis, making them more sensitive in circumstances where there is a high percentage of bare soil, scarce vegetation, or low chlorophyll content—all instances where NDVI struggles to provide accurate measurements. MSAVI is therefore most useful for monitoring crops in the first months following sowing.
Normalized Difference Red Edge (NDRE)
Another popular vegetation index, NDRE works by analyzing ‘red edge’ light—the narrow band of the visible light spectrum where red becomes NIR. It’s particularly sensitive to chlorophyll content, changes in leaf area, and the effect of soil in the background. It can measure the NIR light which has penetrated through to the lower part of the canopy, and is therefore ideal for analyzing the health and vigor of mid- and late-season crops, when the leaves have accumulated high levels of chlorophyll. NDRE can also be very helpful for determining the relative nitrogen content of crops, independent of the quantity of nitrogen in the soil.
Canopy Chlorophyll Content Index (CCCI)
CCCI analyzes the relative levels of reflected red, red edge, and NIR light, and is used to estimate the amount of nitrogen—a key component of chlorophyll. By correlating CCCI with tissue samples from crops, farmers are able to accurately estimate the nitrogen (N) variation of across a field. This method can provide information on N levels much earlier in the growing season than other indices, which helps growers to fertilize more precisely and efficiently.
Each vegetation index has a different sensitivity, and therefore they should be applied at different stages in the growth cycle: MSAVI is applied in early stages, when there is limited leaf coverage; NDVI during the period of rapid growth; then NDRE at later stages when leaf coverage is fuller. It can then be useful to return to NDVI and finally MSAVI again as foliage decreases and the crop transitions to ‘senescence’.
How do farmers use vegetation indices in practice?
The tools above are just a small sample of the many vegetation indices which can help farmers understand different parameters of crops or soil, including nitrogen variation, moisture levels, and more. Farmers can access and calculate these indices via farm management platforms, GIS tools, or satellite data and algorithm marketplaces such as UP42, where multiple complex vegetation indices such as NDVI, NDWI (Normalized Difference Water Index) EVI, and MSI (Moisture Stress Index) are all available.
However, the increasing popularity of vegetation indices can also lead to a misconception that reflectance values are the definitive measure of vegetation health. This is not the case, and researchers are keen to point out that a vegetation index is a qualitative measurement, rather than a quantitative one. Furthermore, a similar output may mean a completely different thing for two different fields.
Data-driven farms should therefore use multiple indices to analyze the performance of their crops through the season, and integration with other sources of data is key in avoiding misinterpretation. It’s only once these additional data layers are applied that the true meaning of a vegetation index can be understood. An example might be a field in which NDVI indicates underperformance in two separate areas. Without additional data, the assumption may be that the cause of this is the same in both areas. However, other data sources can reveal different issues, including erosion, moisture, or nutrient content.
Fortunately, farmers and agronomists are traditionally hugely risk-averse. They know that one poor decision can have devastating effects on yields. As a result, most agronomists—those who are progressive enough to use vegetation indices at all—will not implicitly trust the data on its own. They will verify the data in person, physically going to the field to inspect the areas, and overlaying the satellite data with other data layers including soil samples and elevation data.
Indeed, knowing how to interpret and apply the data is often more important than the type of camera used to capture it. And of course, vegetation indices do not eliminate the job of the agronomist, as the most important factor in interpreting the data is understanding the physiology of the plant itself. Vegetation indices are useless unless they are used by someone who understands the data, but also the plant, the soil, and the wider environment.
What’s next for vegetation indices?
Researchers, data scientists and agronomists are constantly searching for new formulas that can provide much needed information on crop performance. In some cases, farmers are even looking to create their own custom indices, and some companies already provide index calculators that meet this need. If someone has a thorough understanding of both the physiology of their plants and the data, they can customize an index to answer their specific questions.
There’s also potential to be mined in Synthetic Aperture Radar (SAR). SAR is very well understood by the agriculture industry, and embraced for its ability to penetrate cloud cover, but currently it’s used on a fairly broad level. The fact that it can provide data from below leaf canopies holds great promise for more specific indices.
Finally, the drone industry can offer a different perspective, as the imagery is captured from closer to the ground, with fewer atmospheric factors to contend with. There is therefore less pre-processing and correction needed, and the image resolution is much higher, meaning drone data can potentially be used to more accurately calculate an ‘absolute’ reflectance value from which all the ‘relative’ indices are calculated. Additionally, centimetre level resolution means that it can be observed and calculated with much higher level of detail, even for an individual plant.
Interestingly, very-high resolution satellite data such as Pléiades Neo with 30cm GSD also opens a wide range of possibilities to analyze the conditions of individual plants. Such data are particularly useful for high-value crops like vineyards and olive orchards, which are now facing increasing challenges of drought, so farmers need to use water resources in a far more efficient way.
Combining this ultra-targeted information with more generic overview coming from open satellite imagery may well provide farmers with that perfect combination of data that they seek. Such scenarios are getting more and more feasible with the wide availability of open and commercial satellite data via easy to use marketplaces such as UP42.
Vegetation indices—a vital part of a modern, digitalized farm
There is a whole world of vegetation indices available to the agriculture industry, going way beyond NDVI. In practice, even regular RGB or true color maps will give an agronomist highly relevant information—and very often there is a clear correlation between NDVI and RGB data. Each additional data source can be another powerful instrument in the agronomist’s toolbox, helping them to make informed decisions on the farm.
However, vegetation indices are not absolute values; they are indicators of the health and condition of a plant. To truly understand the information, and to use it for more detailed analysis of crop performance, farmers should combine vegetation indices with other data layers, including elevation models and soil samples. And of course, to make the most effective use of vegetation indices, a farm needs to be operating digitally already—this means using farm management software, variable rate spraying machines, and digitalized processes across the board.