Applications of satellite technology in biodiversity conservation

Editor’s note: This article was written as part of EO Hub – a journalistic collaboration between UP42 and Geoawesomeness. Created for policymakers, decision-makers, geospatial experts and enthusiasts alike, EO Hub is a key resource for anyone trying to understand how Earth observation is transforming our world. Read more about EO Hub here.
Biodiversity refers to the variety of living organisms that inhabit our planet, including plants, animals, fungi, and microorganisms. This diversity not only enriches the natural world but also plays a crucial role in sustaining the ecological balance and providing vital ecosystem services. Unfortunately, human activities such as habitat destruction, climate change, and pollution have led to a significant loss of biodiversity in recent years. To address this pressing issue, scientists and conservationists have turned to satellite data as a valuable tool for monitoring and managing biodiversity. In this blog post, we will delve into what biodiversity is, why it matters, and how satellite data can help in conserving it.
Understanding biodiversity and its crisis
Have you ever wondered what would happen if biodiversity didn’t exist? How serious would the consequences be? The truth is that without biodiversity, the entire support system for human and animal life would collapse. The Millennium Ecosystem Assessment (MEA, 2005) indicated that the main ecosystem services related to human functioning are fresh water, food, raw materials, medicines, nutrient cycling, wastewater treatment, regulation of infectious diseases and climate, and recreation. Human access to biotic and abiotic elements of the natural environment minimizes threats to both physical and mental health. Consequently, we must realize that the ecosystems around us are essential to life on Earth. We can’t just remove a species. Everything carries greater or lesser consequences.
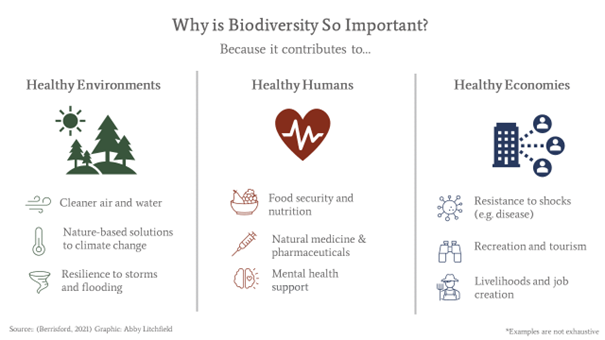
Recent decades have been characterized by an unprecedented rate of global change. Just think of the doubling of the human population over the past 50 years, going hand-in-hand with increased life expectancy, the quadrupling of the global economy, and a billion people lifted out of extreme poverty. This remarkable growth, however, has come at the expense of the natural environment, which has increasingly transformed and exploited for human needs and activities. This may be our last opportunity to save the biodiversity of our ecosystem, which is crucial to our future survival. At the Rio+20 Conference on Sustainable Development, UN member states reaffirmed “the seriousness of the global loss of biodiversity and ecosystem degradation, and highlighted the negative impact of this situation on food security, nutrition, access to water, the health of the rural poor and people around the world.”
The essence of data in supporting biodiversity
Achieving the UN Sustainable Development Goals and the Convention on Biological Diversity goals requires an evidence-based approach to conservation management. There is a need to analyze high-quality monitoring data to inform decision-making and evaluate policy interventions. In addition, the scientific community needs access to global, long-term, reliable information on spatio-temporal changes in the distribution of direct and indirect anthropogenic pressures on biodiversity. Information about the distribution, structure, composition and functioning of ecosystems is needed, as well as evidence of the effectiveness of various management actions. Equally important is the rapid detection of direct anthropogenic and natural threats to sensitive species and ecosystems. We are talking about habitat degradation – floods, deforestation, fires and illegal activities, such as poaching and hunting, among others.
Species distribution models (SDMs)
Species distribution models (SDMs) combine observations of species occurrence with integral biological attributes and environmental data (temperature, monthly precipitation, etc.). This is aimed at predicting the dynamics of species populations, i.e., their abundance over time and space, and the variability of geographic distribution. Changes in ecosystem functioning are largely influenced precisely by changes in species abundance and occurrence. SDMs have a rich range of applications. Among other things, they are used to model the historical distributions of species, predict the potential impact of climate change on their populations, and estimate the future growth of invasive species. It is one of the most important methods used in theoretical and applied ecological research. However, traditional SDM studies have usually relied on records of species occurrence from national atlases and herbariums, which has often generated many errors and inaccuracies. In addition, field surveys of habitats and populations are popular, but such a solution is extremely time-consuming. Thus, there is an emerging need for new and better data to speed up work and minimize the risk of error. Therefore, the opportunity for advances in ecological modeling lies in integrating the species distribution models with remote sensing technologies.
Application of EO data to remote sensing of environmental conditions
We can divide ecological factors into abiotic and biotic – they regulate the distribution and abundance of populations. Abiotic factors are non-living elements of the environment that directly or indirectly affect living organisms (water, terrain, climate, etc.). Satellite remote sensing offers continuous and regular observations of these climatic parameters. The first parameter we will look at is land surface temperature (LST), which measures thermal radiation emissions from land surfaces (bare soil, vegetation canopy, etc.) heated by incident solar energy. It is a key input indicator for climate models, as well as ecological or hydrological models. LST derived from remote data readings enables better SDM forecasting. Data products from Terra and Aqua MODIS and NPP VIIRS have been successfully integrated into SDM studies to improve simulations of ecological processes and biodiversity changes.
Estimating changes in precipitation over space and time is a key aspect of drought early warning and monitoring the impact of climate change. This is why controlling precipitation – another key environmental parameter – is so important in ecological modeling. Precipitation has a significant impact on the productivity of ecosystems and on the biodiversity of plant species and their distribution. NASA’s Precipitation Measurement Missions (PMMs) provide a continuous, long-term record of precipitation data through the Global Precipitation Measurement Mission (GPM) and the Tropical Rainfall Measurement Mission (TRMM).
Soil moisture is another important parameter for understanding ecosystem productivity. It controls the amount of water, replenishes aquifers, and can contribute to excessive runoff. It greatly influences the diversity of fungi and the distribution of plant species. NASA’s Soil Moisture Active Passive (SMAP) satellite is very useful here. It takes moisture measurements in the top 5 cm of soil around the world every 2-3 days with a spatial resolution of 9-36 km. Studies have shown that synthetic aperture radar (SAR) also has great potential to estimate surface moisture at higher spatial resolution.
This animation shows a time lapse of sea surface salinity and soil moisture from NASA’s Soil Moisture Active Passive (SMAP) satellite from April 2015 through February 2019
Biotic factors, on the other hand, are the effects of organisms directly or indirectly on other organisms. Here remote sensing plays an important role in the remote detection of indicators of photosynthetic activity. In particular, the vegetation difference index (NDVI) is often used to predict the biodiversity of ecosystem plant species in different climatic areas. Additionally, the index can be used as a predictor of food availability for habitat modeling. MODIS NDVI products have been used in this way to model vervet habitats in Africa (you can read more about it here).
Remote sensing of species distribution
In SDM studies, data on presence, absence and abundance are extremely rare. Satellite and aerial remote sensing come to the aid, providing high-resolution images over large geographic areas. With this technology, it is possible to verify the spatial errors inherent in field surveys and, most importantly, save valuable time when surveying populations.
For remote plant detection, a condition must be fulfilled – the intended species must have a unique phenology or growth form. Only then will the use of surface reflection in the visible and near-infrared range yield results. Of course, it is often possible to distinguish vegetation types such as deserts, forests and swamps, but in order to analyze a particular species, its spectral characteristics must be distinguished. Hyperspectral remote sensing is indispensable here, combining spectroscopy and imaging. The acquired data sets usually consist of 100-200 spectral bands, greatly increasing the ability to distinguish the characteristic spectral signatures of individual plant species. In their paper, Tree species discrimination in tropical forests using airborne imaging spectroscopy, J. Féret and G.P. Asner successfully used HyMap, a hyperspectral scanner. It provides 128 bands in the reflective region of the solar wavelength 0.45 – 2.5 um with continuous coverage with an average bandwidth of 15 nm. This allows for highly accurate results in plant species detection studies.
However, NDVI can be useful not only for studying vegetation but also animals. As it turns out, changes in the distribution of NDVI over time can be correlated with the range of daily and seasonal movements of animal species. Another example of using space data for animal observation is the ICARUS (International Cooperation for Animal Research Using Space) Initiative. This is an international effort to develop a satellite-based observation system for small animals such as birds, bats and turtles. As part of the process, Icarus scientists will attach mini-transmitters to various animal species. These transmitters will then send their measurement data to the International Space Station (ISS). The receiving station will, in turn, transmit the data to the ground station, from where it will be sent to the relevant teams of researchers.
Conclusions
The opportunities for advancing conservation science through the development of innovative remote sensing products are promising. Using new technologies will allow faster and more accurate studies of biodiversity. Space agencies are constantly launching satellite remote sensing – the CEOS Missions, Instruments and Measurements (MIM) database currently contains detailed information on about 300 Earth observation satellite missions and 830 instruments currently in operation or scheduled to be launched in the next 15 years. However, remote sensing data products are not yet fully utilized and will contribute more to SDM for biodiversity monitoring and policy. It is becoming increasingly easy these days to obtain multispectral and optical data with very high resolution. Manyproviders offer data that are already corrected and analyzed, which can make the work much easier. Incorporating satellite remote sensing into the standard elements of an ecologist’s toolkit will certainly bring tangible benefits to biodiversity research.
Did you like the article? Read more and subscribe to our monthly newsletter!

#Categories

Next article
How Satellite-Derived Bathymetry Enables Coastal Monitoring and Protection
Editor’s note: This article was written as part of EO Hub – a journalistic collaboration between UP42 and Geoawesomeness. Created for policymakers, decision-makers, geospatial experts and enthusiasts alike, EO Hub is a key resource for anyone trying to understand how Earth observation is transforming our world. Read more about EO Hub here.
Mapping the global sea floor is vital in aiding our understanding of our planet and its climate, but with an estimated 75% of the sea floor unexplored, the world’s vast oceans are still largely unknown.
When it comes to our daily lives, the most crucial areas for us to focus on are the coasts. To understand and predict coastal change, we need accurate, large-scale measurements of key parameters, including bathymetry. However, currently, nearly 50% of the world’s coastal waters remain unsurveyed.
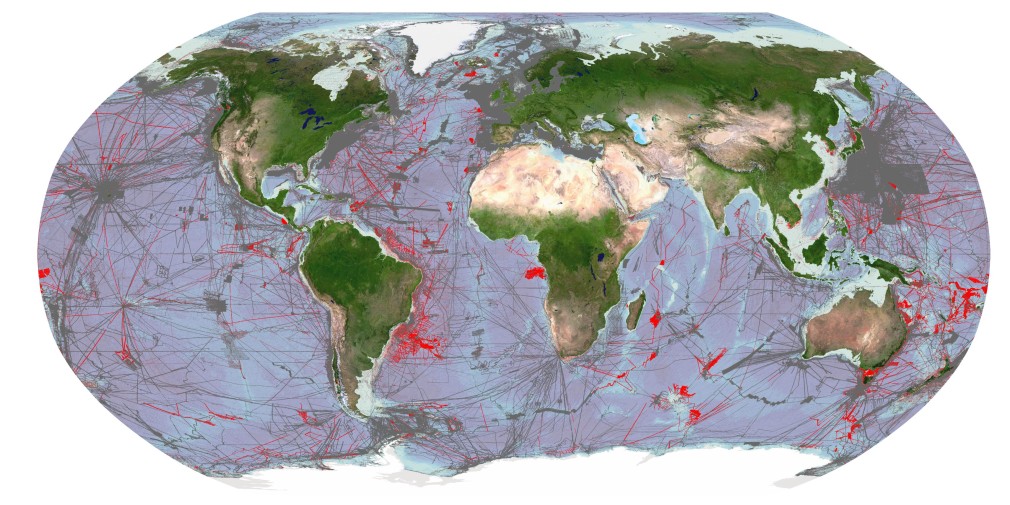
Image showing areas of global seafloor considered to be mapped by General Bathymetric Chart of the Oceans (GEBCO). Grey areas depict coverage of as of 2021, red areas are additions for 2022. Credit: The Nippon Foundation-GEBCO Seabed 2030 Global Center (GDACC) on behalf of Seabed 2030; Source: seabed2030.org
Our vital coastal regions
The shallow water zones near the coast are home to around 10% of the world’s population, playing host to many megacities. These low-lying regions are also of the utmost importance for industrial applications—such as the safe navigation of ships—as well as for coastal protection and management. Coastal areas are also highly dynamic, particularly vulnerable to natural and human-induced changes, impacted by factors including erosion, extreme weather events, sea-level rise, and population movements. Continuous monitoring of the world’s coasts is a necessity.
Gathering bathymetric data for shallow coastal waters has always been a challenge as traditional methods such as sonar or LiDAR are time-consuming and expensive to carry out. As a result, for a large number of these coastal regions, such data is either unavailable or decades old.
One of the promising technologies to bridge this information gap is satellite-derived bathymetry (SDB), which is using multispectral optical data to estimate the depth of near-shore waters.
How does it work?
Satellite data has been used to map the ocean floor for several decades using techniques such as radar altimetry, wave kinematic, and even space-based lasers. Such methods allowed scientists to generate an approximate model of the ocean floor but the resolution of such methods are not enough for shallow waters (down to a depth of 30m).
Satellite-derived bathymetry uses optical image data to try to estimate the depth of the water in a given place. One of the most effective algorithms to do that is called multispectral signal attenuation, which involves analyzing imagery using a combination of spectral bands. As different wavelengths penetrate the water to a greater or lesser degree, the light attenuation can be measured, and elevation ratios are created by analyzing the colour profile and spectral characteristics of coastal areas with known depths. Algorithms are then used to infer water depth from new spectral information by comparing it to known depths of similar areas. With this approach, it is possible to estimate the depth of the water, even down to 30 meters, with a high level of accuracy.
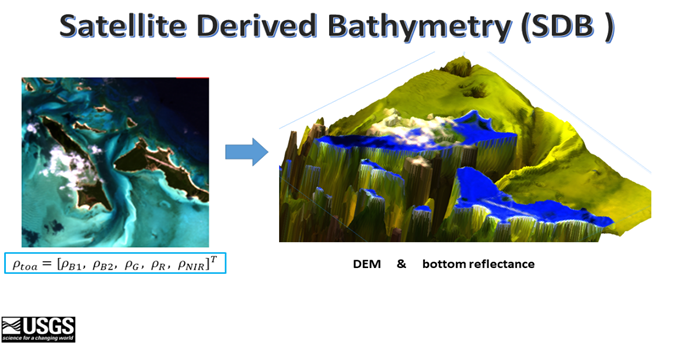
Source: USGS: https://www.usgs.gov/special-topics/coastal-national-elevation-database-%28coned%29-applications-project/science/satellite
The better the resolution and the more spectral bands used in the data, the more accurate the results will be, but even lower resolution data can provide valuable information.
Today, data for SDB is measured from various satellite sources, such as Landsat 8 (NASA), Sentinel-2 (ESA), and Pleiades (Airbus). Recently, Airbus launched a new constellation called Pleiades Neo which has a very high resolution of 30cm available via Up42 marketplace among others. More importantly, it features a new spectral band called deep blue with wavelengths of 400-450 nm, specifically designed for satellite-derived bathymetry and atmospheric corrections. This new spectral band allows for much better interpretation of optical data for shallow waters than previously possible.
What are the benefits of SDB?
SDB is a cost-effective and time-efficient alternative to traditional on-site methods. It doesn’t require ships or human divers, making it a safer method for data collection, and also dramatically reducing the environmental impact caused by more intrusive methods.
Airborne LiDAR bathymetry is another technique to measure the seafloor from the skies. It uses an active sensor which beams a green laser light, as opposed to a passive optical satellite sensor. The use of LiDAR gives higher accuracy than SDB, but at a much higher cost, as it requires dedicated airborne survey and only produces data for a relatively small area. SDB, on the other hand, utilizes existing satellite infrastructure, the images cover a wider area, and data can be captured multiple times a day, meaning it has both repeatability and scalability. It is also time-efficient and can provide near-real time monitoring, making it ideal for regular oceanographic management.
SDB is not without its disadvantages. For instance, it can lack spatial resolution when compared to other methods. Depending on the type of technology used, satellite imagery may be affected by weather conditions, water quality, and the presence of vegetation. It has limited effectiveness in deeper waters. Despite these limitations, SDB is a powerful tool for measuring shallow waters, and can be used very effectively in combination with other methods—above all because the data can be captured with such regularity.
Source: https://business.esa.int/projects/international-satellite-derived-shallow-water-bathymetry-service
Applications of SDB
SDB in coastal regions can play a key role in a variety of practical applications that are essential to our current way of life and preservation of our future.
Bathymetry is an important tool for many industries. In terms of trade and logistics, accurate bathymetric data is essential for ships and port authorities to ensure safe navigation. Sea transportation is an essential component in over 90% of international trade, and the ships used to transport these goods are growing ever bigger. Understanding the shape of the ocean floor is a vital input for models of ocean currents and waves, and therefore bathymetry can help to improve sea-state monitoring, including wave prediction and more. For the telecommunications industry, bathymetry is used to plan the routes of subsea fiber-optic cables, avoiding coral reefs, shipwrecks, sensitive areas and geological obstructions. Around 474 of these cables are responsible for transmitting 99% of international data (according to TeleGeography, 2021).
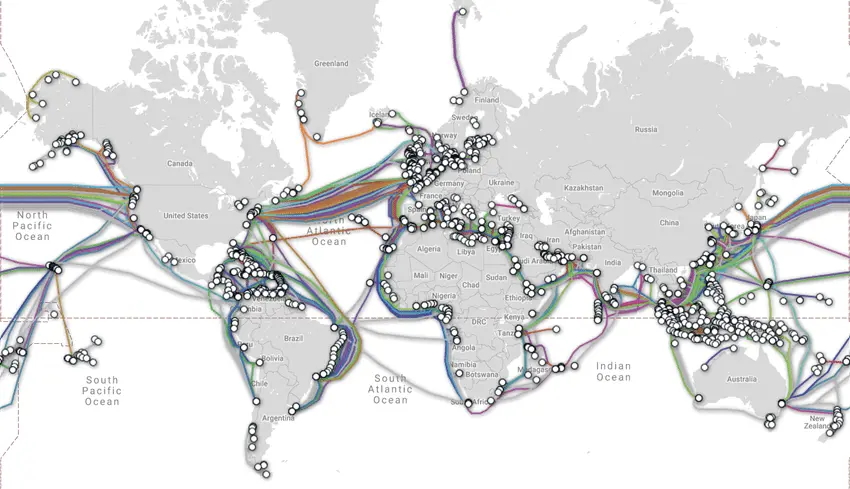
Map of global subsea fiberoptic cables. Source: www.submarinecablemap.com
Energy companies also rely on bathymetry to explore and extract oil and gas, as well as using it to secure new energy resources like wind and ocean energy. It is also used to monitor sedimentary movements in the corridor between the coast and the energy exploitation site to ensure the integrity of cables connecting wind turbines to the shore. These cables are a critical part of the infrastructure for wind energy—which is the fastest growing blue economy sector, as of 2019.
Bathymetry is also used to estimate and control the volume of materials extracted from the seabed and monitor changes caused by dredging activities. Dredging is essential for many industrial and civil engineering applications, but can contribute to coastal erosion and environmental damage if not carefully managed. More broadly, bathymetry is used to better understand coastal erosion caused by both natural and human factors, and can aid in better management of our coasts, including the development of innovative coastal defense systems for risk mitigation and post-crisis analysis.
Accurate and precise knowledge of the seabed is also key in protecting undersea conservation sites and archaeological areas. One way that bathymetry data can help with this is by modelling underwater noise caused by human activity. Furthermore, the technology contributes to food security, helping to identify locations for offshore aquaculture cages, habitat mapping and impact modeling to meet the increasing demand for seafood.
Bathymetry even aids in issues of sovereignty: sovereign waters are defined by the limits of the continental shelf, as dictated by the United Nations Convention on the Law of the Sea (UNCLOS). Bathymetry helps to establish these boundaries and justify the rights of a coastal state to explore (and exploit) its maritime territory.
Satellite-Derived Bathymetry: An essential tool for the future
The monitoring of coastal waters is becoming increasingly important, both for business and for tracking and mitigating climate change. With this in mind, it is clear that satellite-derived bathymetry will be an essential tool for hydrographers in the near future as the technology continues to mature.
The benefits of SDB include its ability to be applied completely remotely, with no associated environmental impacts or human risks, and its cost-effectiveness and time-efficiency compared to traditional methods, making it an important tool for estimating the depth of coastal waters. It still has some limitations in terms of accuracy and availability of data, as well as its effectiveness in deeper waters, but we can expect significant developments in this space in the coming years.
The emergence of SDB takes advantage of the major shift and acceleration in the Earth Observation (EO) market, as the emergence of low-cost small satellite technology continues to democratize access to EO data. Leading EO companies are launching new constellations with spectral bands supporting SDB applications, such as Pleaides Neo and Deep Blue, and the technology is expected to be disrupted in the future by computer vision and deep learning models.
With the ability to remotely, cost-effectively, and efficiently monitor coastal waters, SDB is poised to play a crucial role in our understanding and management of these vital resources.
Did you like the article? Subscribe to our monthly newsletter: