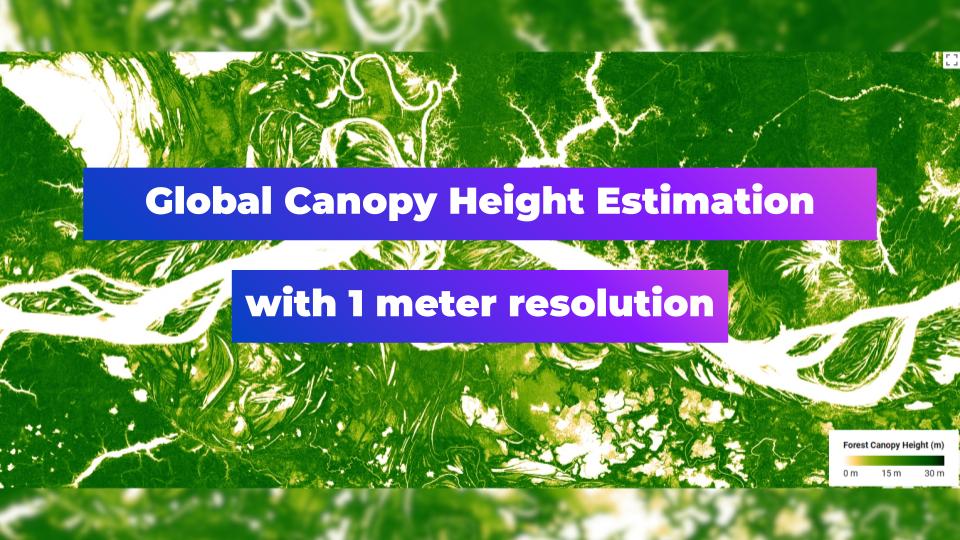

That’s just a geoawesome news! The quality of satellite-based products is improving year by year! Here’s a perfect example of mapping the elements of Earth’s environment globally. Meta Sustainability group and the World Resources Institute have recently released a Global Canopy Height map at 1m resolution.
What is Global Canopy Height Estimation?
Global Canopy Height Estimation refers to the process of determining the height of forest canopies around the world using various remote sensing techniques. This estimation is crucial for several ecological and environmental studies, including biodiversity assessment, biomass estimation, and climate change research.
Gathering of the data
To generate this global map there was a need to collect 18 million satellite images from 2009 to 2020, highlighting the data from 2018 to 2020. Over 1 trillion pixels resulted in an impressive 15+ TB of data! What about the accuracy? From information provided by the authors the mean absolute error is 2.8 meters. To generate the model AI tool such as DiNOv2 was used, which enables for accurate assessment of carbon stocks.

Canopy height in NYC, Google Earth Engine
Comparison with data from 2005 and 1km resolution, Belem, Brasil, South America, Source: Google Earth Engine
Spreading the news!
Thanks to the authors it’s possible to check out the possibilities of The Canopy Height map by yourself! Follow the link for online application. Case studies above were created using Google Earth Engine and uploading the following variables:
- Newest version: 1 meter resolution map:
var canopy_ht = ee.ImageCollection(“projects/meta-forest-monitoring-okw37/assets/CanopyHeight”)
- Older version: 1 kilometer resolution map:
var dataset = ee.Image(‘NASA/JPL/global_forest_canopy_height_2005’)
Know the difference: Global Canopy Height Estimation vs. nDSM
Mentioned Height map may sound familiar to nDSM – Normalized Digital Surface Model, but it’s limited only to the processed and modeled height of the canopy. nDSM presents the height of all surface structures above the ground, eg. buildings, infrastructure and vegetation. It’s generated by raster differencing DSM and DEM rasters. Example below is a visualization of DEM (Digital Elevation Model), DSM (Digital Surface Model), nDSM and satellite imagery for the west district of San Francisco. In nDSM visualization it’s notable that buildings are included next to tree cover in parks.
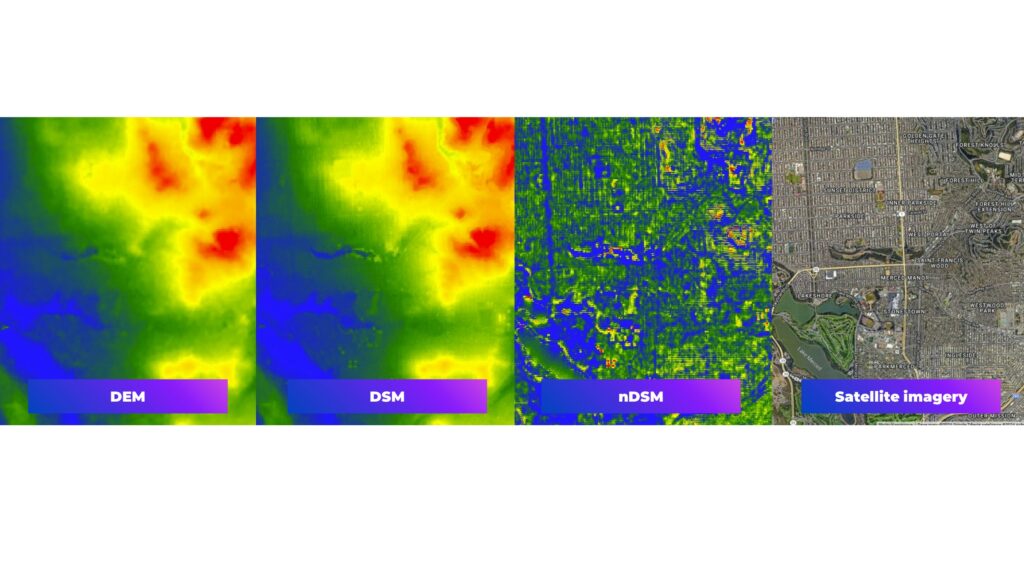
Know the difference. DEM, DESM and nDSM model
Conclusions
The recent release of a Global Canopy Height map at 1 meter marks a significant advancement in satellite-based monitoring. Utilizing the AI tool DiNOv2, this initiative analyzed satellite images, resulting in a highly detailed map that significantly improves the assessment of carbon stocks. This breakthrough demonstrates how AI tools are instrumental in enhancing the quality and precision of satellite-derived products, offering more reliable data and automation processing for ecological studies and environmental management.
Source: gee-community-catalog.org
Did you like the article? Read more and subscribe to our monthly newsletter!

#Environment


Next article
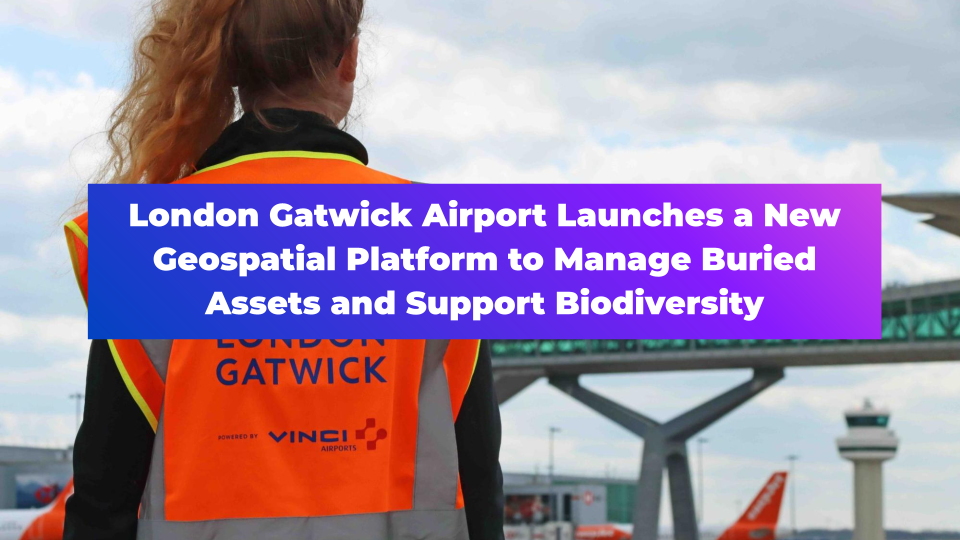
London Gatwick Airport Launches a New Geospatial Platform to Manage Buried Assets and Support Biodiversity

We like to keep our eyes on all things spatial at Geoawesomeness. This new industry development caught our attention as brings together some flourishing technologies and trending topics: geospatial platforms, digital twins, and democratizing geospatial data.
London Gatwick Airport has created a new geospatial platform using Esri’s GIS (Geographic Information System) to support multiple operational areas, including engineering and environmental services. The platform reduces the risk of airport disruption from accidental damage to utilities and helps to manage environmental impacts.
It integrates all spatial data into a single view. Combined with advanced spatial analysis tools, mobile apps, and a dashboard, the Esri platform provides new insights to support better collaboration and decision-making across the airport.

London Gatwick is using the geospatial platform to support its Biodiversity Action Plan.
The airport is using the platform to support its award-winning Biodiversity Action Plan, designed to deliver a biodiversity net gain at London Gatwick by 2030. London Gatwick’s 1,600-acre site is home to 75 hectares of woodlands, grasslands and wetlands, as well as hundreds of species of mammals, birds, insects and bees.
The geospatial platform gathers environmental data such as protected, rare or invasive alien species, bat box locations, notable birds and environmental stewardship areas. It also visualizes the estimated embodied carbon of built assets.
Insights from the GIS allow London Gatwick to plan works around any environmentally sensitive sites to minimize impact and seek ways to bring additional benefits, such as improving biodiversity.
The single view of buried assets including gas, electricity, telecoms, water, and fuel, is proving critical in reducing accidental damage to utilities across the 1,600-acre site.
Field engineers, third-party contractors and major consulting firms all use the same single view of data, accessible on any device when planning excavations. With up to 50 engineering and construction projects on-site at any one time, the new system is making work safer and reducing the risk of disruption to airport operations from any unplanned outages.
“Being able to visualize and interrogate all spatial data from any discipline, on any device, is critical to the sustainable future of London Gatwick. Democratizing spatial data in this way drives significantly more business and operational value from it,” explained Simon Richardson, Digital Information Lead, London Gatwick Airport.

Simon Richardson, Digital Information Lead, London Gatwick.
“The Esri GIS has given us the foundation to create a digital twin. As a complex site with over 70 years of history, we are building a virtual representation of what has previously been built along with future plans, which helps manage the airport’s development.”
London Gatwick selected GIS from Esri UK following a competitive tender. Previously, the airport used Autodesk’s Infrastructure Map Server to manage spatial data but looked for another GIS software vendor when the product became unsupported.
“We selected GIS from Esri UK because its Managed Cloud Service made it more accessible at lower cost than an on-premise approach,” continued Richardson. “It also removes the burden of system management and updates, which saves a significant amount of time, allowing more resource to focus on strategic projects. The new system is quicker and easier to use and the benefits far outweigh the cost.”
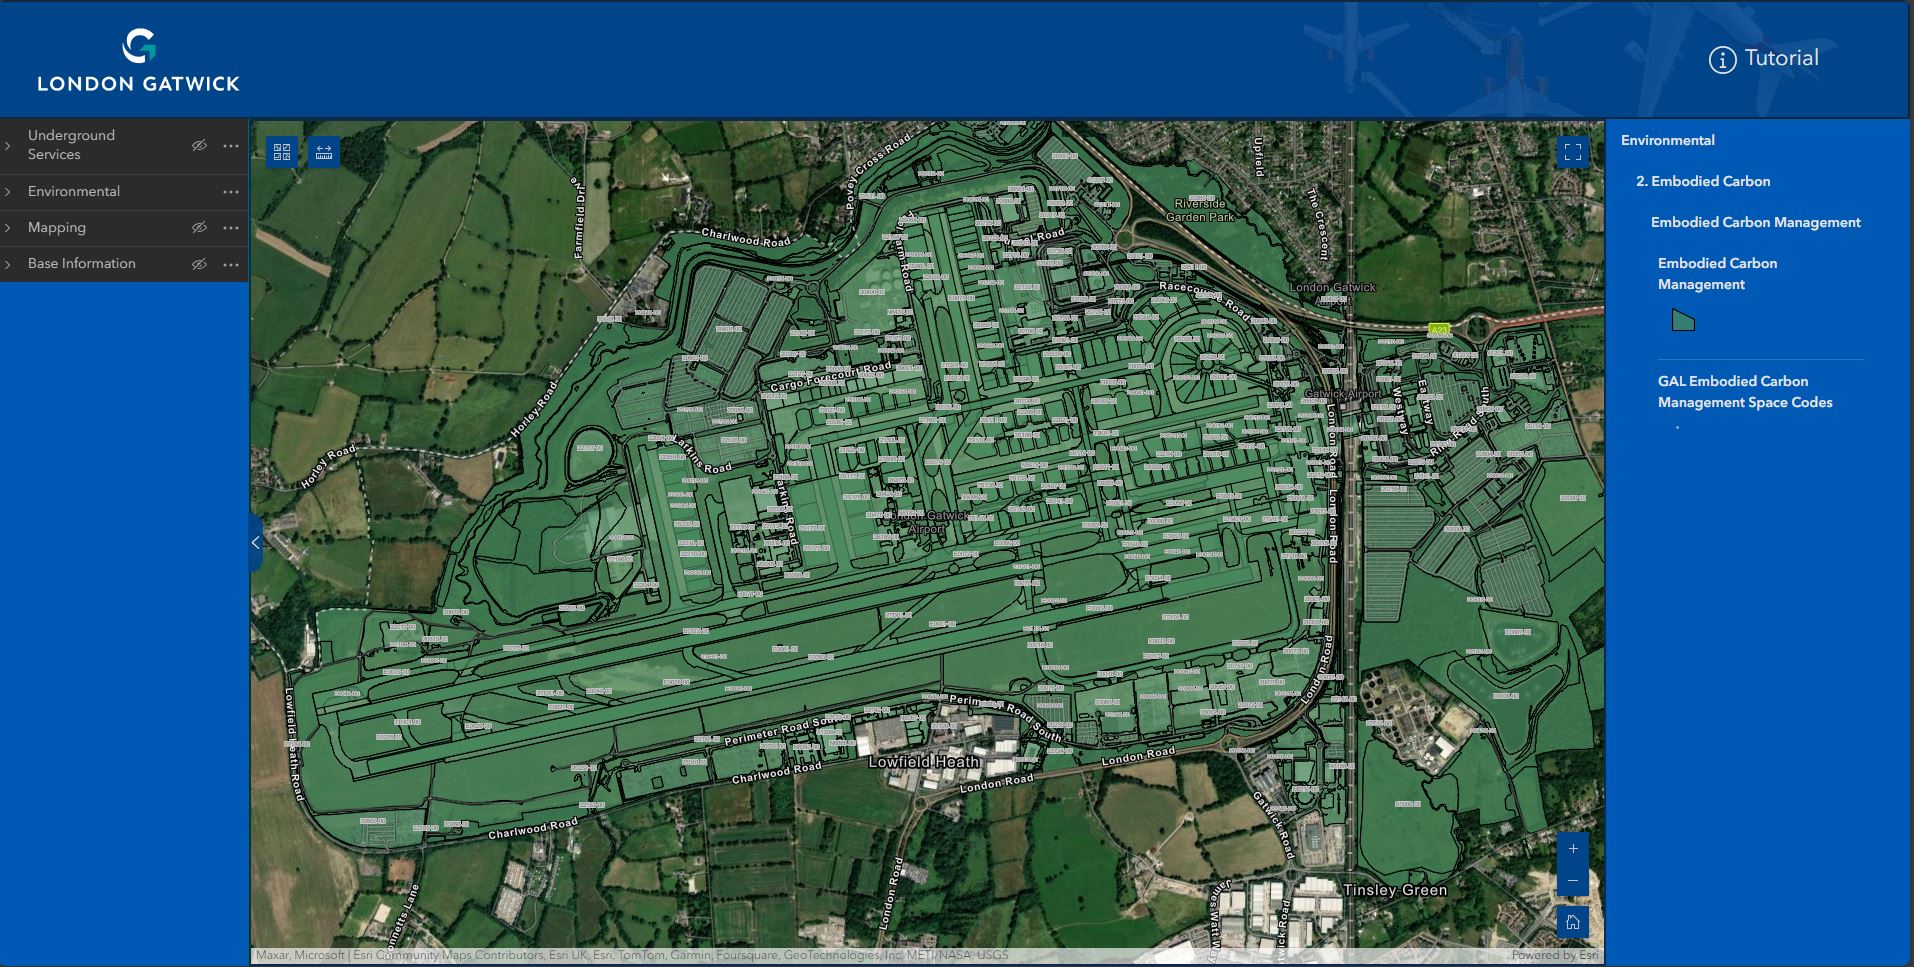
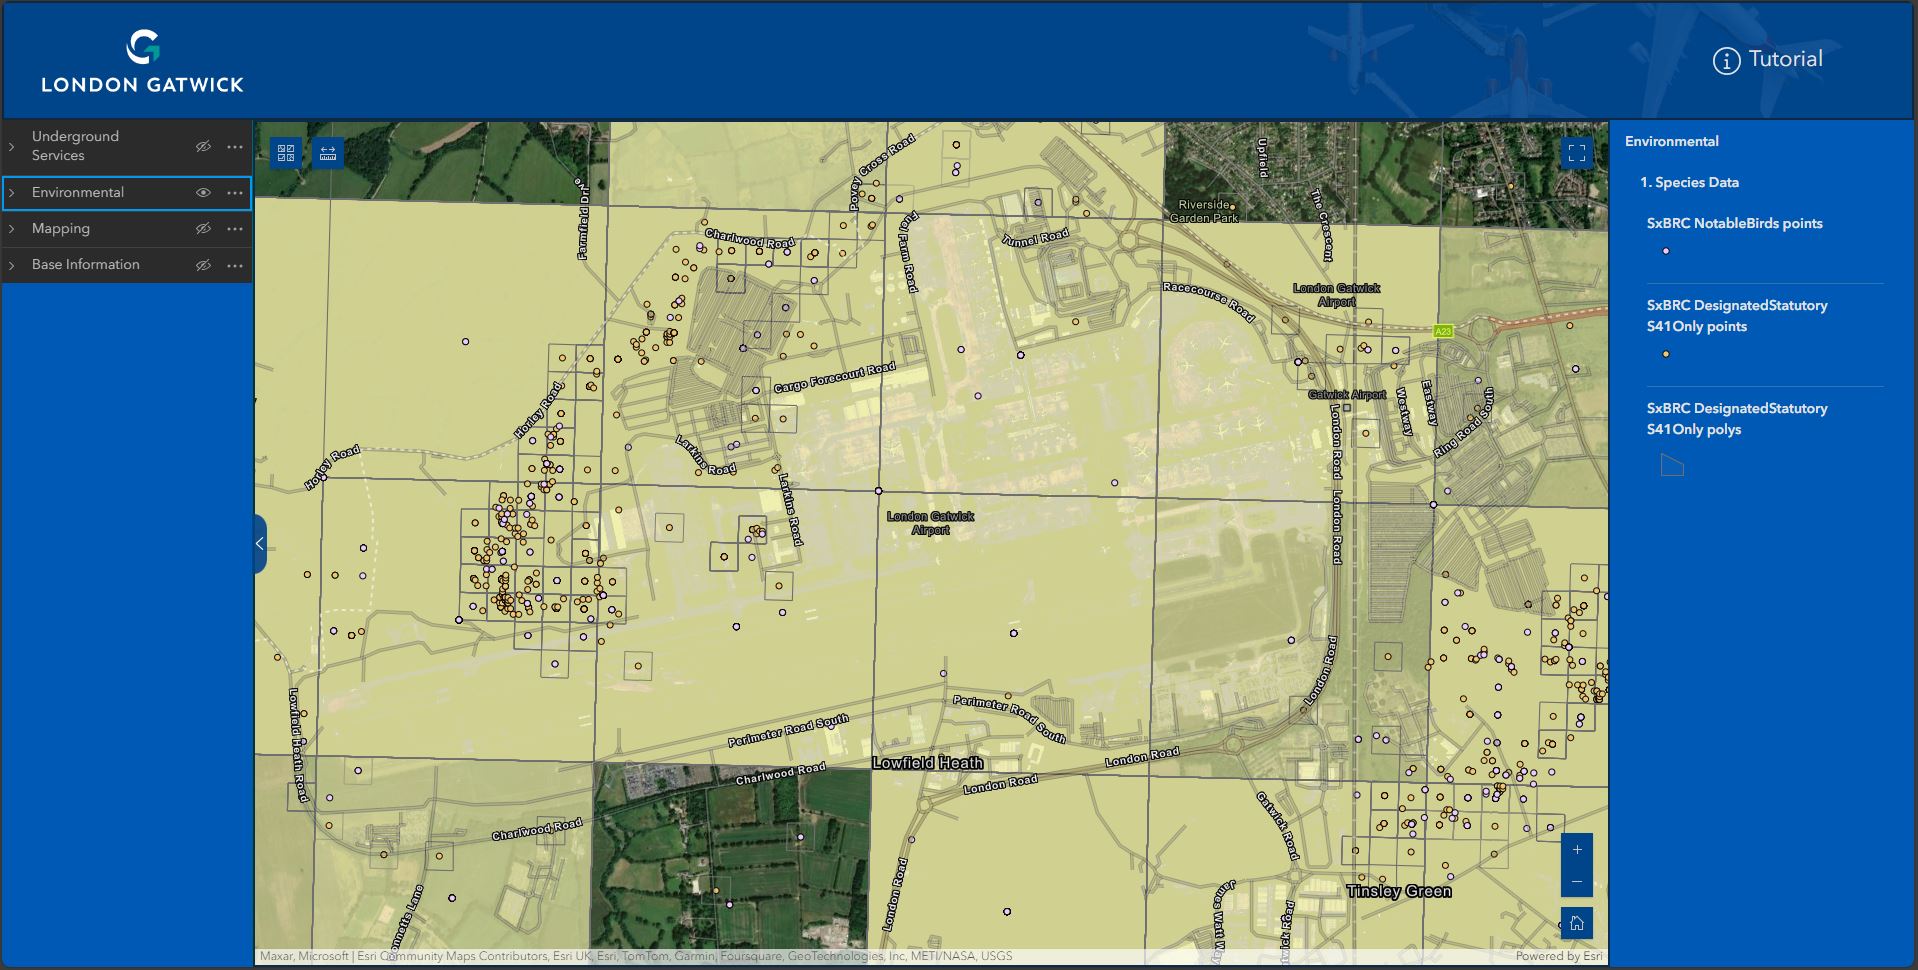
The geospatial platform visualizes critical infrastructure information spanning the 70-year history of the airport.
The system is already making engineering and construction work safer by reducing accidental strikes on buried utilities and enabling better management of the airports’ biodiversity.
With the rise of digital twins and London Gatwick’s platform being a foundation for one, this type of technology is one to watch as cities, towns, airports and more build virtual representations of the past, present, and future. Mirroring our complex world in this way enables us to gain smart, connected insights that transform decision-making.
What are your thoughts on London Gatwick’s geospatial platform? On airports utilizing digital twins? Is this a new frontier for innovation and efficiency? Where do you see the global airport digital twin market going in the coming years? We’re curious to see if airport operators try to keep pace with the technology of the future and if regulators will drive innovation in the coming years.
Let us know what you think!
Did you like the article about London Gatwick’s new geospatial platform? Read more and subscribe to our monthly newsletter!