 Are there Geocoders in the house? Well you don’t necessarily have to be a Geo-coder to quickly get these Codes working on your machine. Just a little tweaking/bidding settles the matter.
I was gonna talk about these piece of codes posted by New York Public Library Lab on Github. This is an outcome of the Map-Vectorizer project they embarked upon to quickly do the things they were doing.
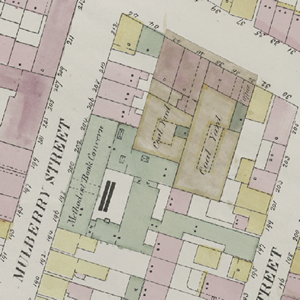
They sought to develop a kind of ‘’OCR for Maps’’, Map-Object Character Recognition (MOCR) aimed at automating the process of scanned image vectorization.
I have used lots of auto-vectorization programs in the past including ArcScan , R2V etc. but this very program does a far better job.
This program can extract neatly polygon shapes as well as the color attribute of the polygons.
However, the program has not been made stand-alone yet, it is still dependent on the following programs running on your machine; some programs bidding required.
To get the Code (program) properly tweaked and nicely doing the job, you need: Python with OpenCV, ImageMagick, R, GIMP and GDAL.
Provided below is some piece of information from Github to give you a clear guide in achieving the goal; Thanks to Github!
Dependencies
A few things to be installed in your system in order to work properly. So far it has been tested on Mac OS X Lion so these instructions apply to that configuration only. I am sure you will be able to adapt it to your current configuration.
- Python with OpenCV
- ImageMagick with the
libtiffdelegate. If usingbrewthis means:brew install libtiffbrew install imagemagick --with-libtiff- To verify all is well:
convert -list formatshould displayTIFFandTIFF64in the list
- R – Make sure it is in your PATH (so you can run it via command-line by typing
R). - You’ll need the following R packages. On OS X simply navigate to
Packages & Data, choose your CRAN mirror region, then search for and install:rgdalalphahull(you will needtripack,sgeostat,splancsas dependencies)igraphshapefiles- On the CLI (by typing
Rin a terminal window) you will know you have all the required dependencies if you can run this with no errors:
    library(rgdal)
    library(alphahull)
    library(igraph)
    library(shapefiles)
    quit() # this will quit R
- GIMP
- GDAL Tools, on OS X try version 1.9. Per MapBox: The first time you install the GDAL package there is one additional step to make sure you can access these programs. In Mac OS, Open the Terminal application and run the following commands:
    echo 'export PATH=/Library/Frameworks/GDAL.framework/Programs:$PATH' >> ~/.bash_profile
    source ~/.bash_profile
- It is also a good idea to install QGIS to test your results
First run
These step by step instructions should work as-is. If not, check all the above are working before submitting an issue.
- Take note of the path where the GIMP executable is installed (the default value in the vectorizer is the Mac OS location:
/Applications/Gimp.app/Contents/MacOS/gimp-2.8). - Run the script on the provided test GeoTIFF:
python vectorize_map.py test.tif - Accept the GIMP folder location or input a different one and press ENTER.
NOTE: The vectorizer has problems with filenames that contain spaces. This will be supported eventually.
This should take about 70 seconds to process. If it takes less there might be an error (or your machine rulez). Take a look at the console output to find the possible culprit.
If it works, you will see a test folder with a test-traced set of files (.shp, .dbf, .prj and .shx) and two log files.
Customizing The Vectorizer to your own maps
The Vectorizer was made to work with the NYPL map atlases. It is likely that your maps have different quality and colors. In order for this to work in your maps, you first need to do some minor config adjustments to generate a proper threshold file for your set (assuming it is a map set similar to the provided exampletest.tif):
- Your map needs to be in WSG84 projection. Other projections might be supported in the future.
- Open a representative from map (or maps) in GIMP
- With the color picker, select the color that most represents the paper/background color (using a 5-pixel averaging pick would be best). Make note of the red, green and blue values (0-255).
- Do the same for the building colors (like the pink, green, blue in the example).
You now want to produce a neat black-white image where lines are black and all the rest is white:
- Apply
Colors > Brightness-Contrast...looking to make the lines darker and buildings/paper brighter. The default values are -50 brightness and 95 contrast. These may or may not work for you. Make note of the values that work best. - Now apply
Colors > Threshold.... This takes a black and a white value. Anything darker/lighter than these values will become black/white respectively. The default values are 160 black and 255 white. Make note of the values that work best.
You now have the configuration values for your maps (map color list, brightness-contrast values, threshold values). Open vectorize_config_default.txt and replace the default values with your custom values. Save it as vectorize_config.txt (and keep the default just in case). Your config file should look like:
BRIGHTNESS_VALUE,CONTRAST_VALUE,BLACK_VALUE,WHITE_VALUE, brightness-contrast-thresholdblack-thresholdwhite
PAPER_RED,PAPER_GREEN,PAPER_BLUE,paper
BLDG_RED,BLDG_GREEN,BLDG_BLUE,somebuildingcolor
BLDG_RED,BLDG_GREEN,BLDG_BLUE,someotherbuildingcolor
...
It should always start with brightness/contrast/threshold in the first line and paper in the second line. There should also be at least one building color. You can add as many building colors as you wish (since our maps at NYPL are hand-colored, colors are not uniform so we have lighter/darker versions to compensate that).
When you run the vectorizer again, it will find this config file and use those values instead of the defaults.
It is likely that the vectorizer won’t produce excellent results in the first try. It is a matter of adjusting these color values to generalize as much as possible to your map set.
Source: Github.com

#Science


Next article


Isn’t it so awesome to meet like-minded GIS Professionals, Researchers and business experts and exchange thoughts with them? Isn’t so exciting to explore and spread the capabilities of GIS technology and build and nurture your GIS community? Yes, I am talking about International GIS Day -2013 and it is falling on Wednesday 20th November 2013.
For those who are interested to know about International GIS Day, the first formal GIS Day held in year 1999 and aiming to have good initiative for people to learn about geography and the uses of GIS and subsequently building a healthy GIS community.
To celebrate GIS Day, several GIS communities have already arranged this event to celebrate it at international, national and region level. Last year alone more than 950 hosts and thousands of participants across the world made GIS Day 2012 one of the largest ever.
If you are happened to be in Brisbane, Australia, “GIS People” is hosting a free Brisbane-based event in the main foyer of 123 Eagle Street, Brisbane CBD. For more details, click here.
Future Dates
2014 – Wednesday, November 19, 2014
2015 – Wednesday, November 18, 2015
2016 – Wednesday, November 16, 2016
2017 – Wednesday, November 15, 2017
I have chosen my nearby place to attend the GIS Day event and it’s your turn now? Let’s expand our GIS community and spread the advantages of GIS technology. To let others get benefited, I would request readers of Geoawesomeness blog to comment below about GIS Day events in their cities and suggestions to get registered, which will be very helpful. Thank you.