

Click to open a large version in the new window
Humans have always dreamed about spaceflights, but only in the second half of the 20th century, we developed rockets that were powerful enough to overcome the force of gravity to reach orbital velocities that could open space to human exploration.
Everything started in 1957 when the Soviets launched the first artificial satellite, Sputnik 1, into space. The first U.S. satellite, Explorer 1, went into orbit one year later in 1958. In 1961 the next milestone was space exploration had been achieved – Yuri Gagarin became the first human to orbit Earth. His flight lasted 108 minutes, and Gagarin reached an altitude of about 202 miles (327 kilometers). We had to wait 8 years to 1969 for Astronaut Neil Armstrong to take “one giant leap for mankind” as he stepped onto the moon… The road to space exploration has been long and often bumpy, but we have managed to achieve a lot.
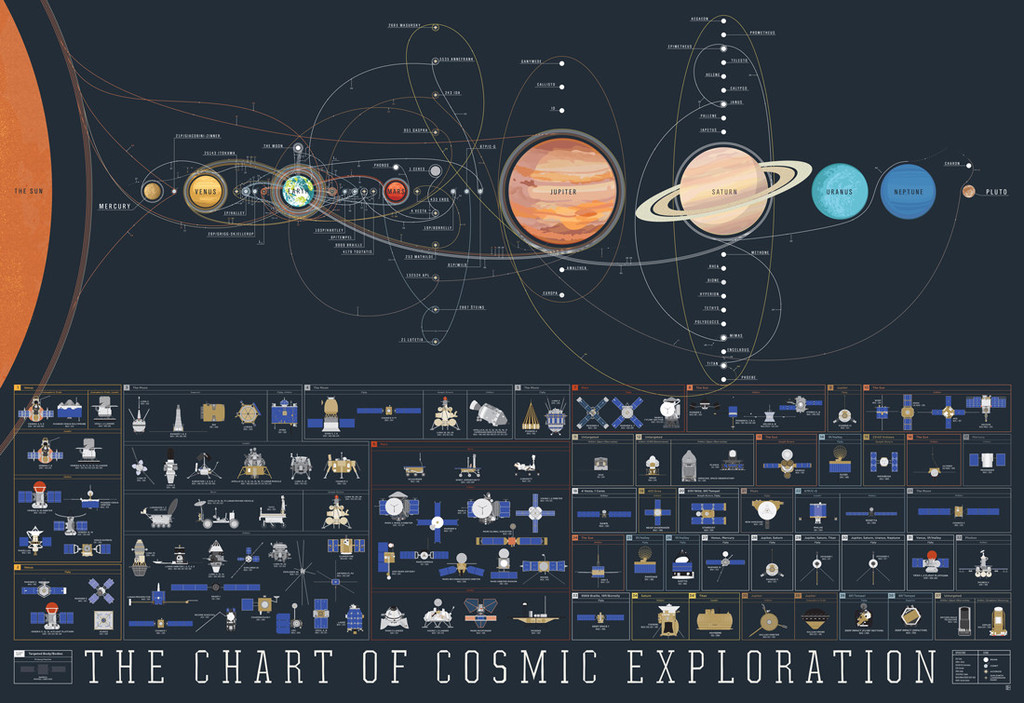
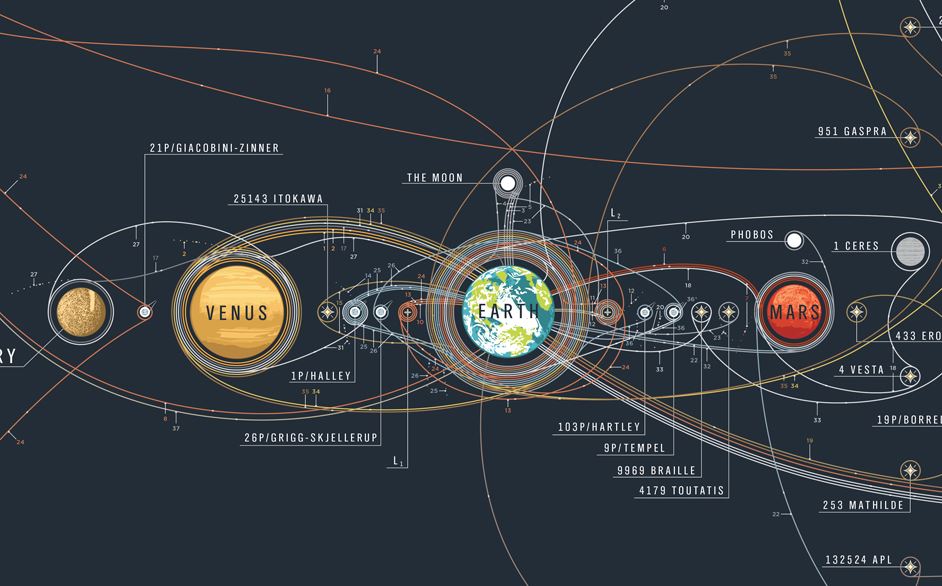
The awesome poster called Chart of Cosmic Exploration documents every major space mission starting from the Luna 2 in 1959 to the DSCOVR in 2015. The map traces the trajectories of every orbiter, lander, rover, flyby, and impactor which ever left the Earth’s orbit and completed its mission. Additionally, each poster features an array of over 100 exploratory instruments with hand-illustrated renderings of each spacecraft. It’s awesome and beautiful!
Did you like this article? Read more and subscribe to our monthly newsletter!

#


Next article

Lidar-based visualization – Willamette River
Every now and then you might come across something so beautiful that it takes your breath away. When you’re a GeoGeek it typically includes some sort of maps. It happened to me today when I accidentally saw this map. It’s amazing.
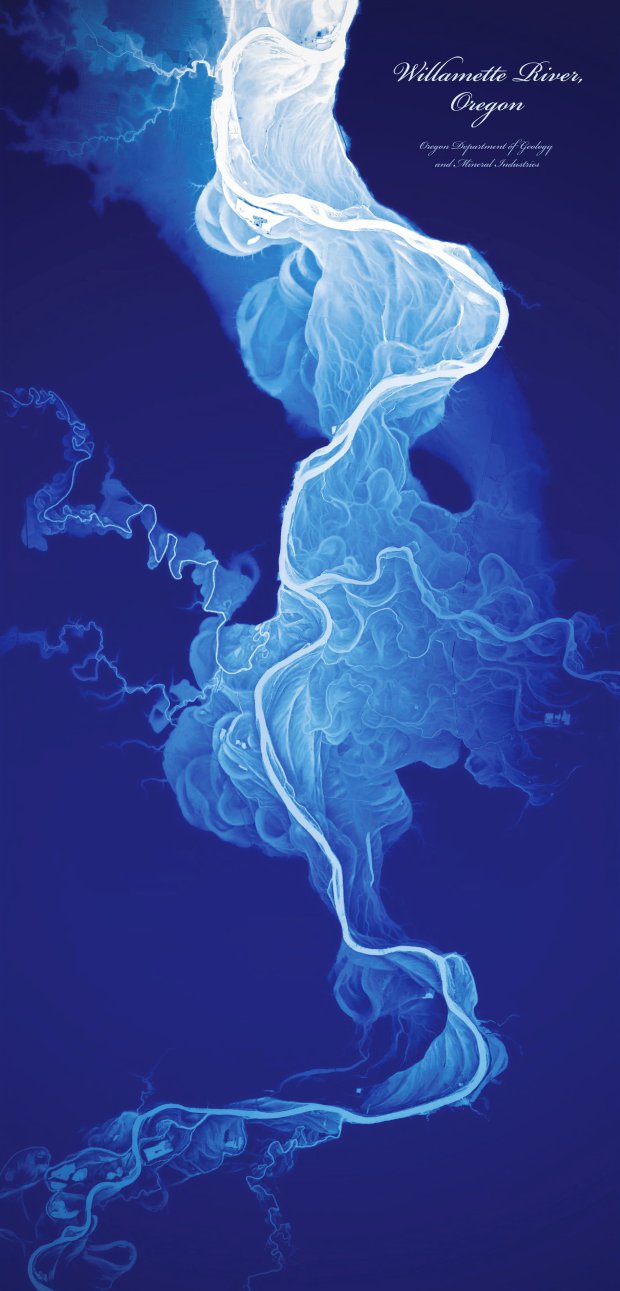
The visualisation has been created by a cartographer Dan Coe, based on the Lidar data captured by the Oregon’s Department of Geology. The image is a digital elevation model of the Willamette river valley, where the elevation heights have been represented by a range of colors from white in the lower elevations to dark blue in the higher elevations. Actually the elevation range is only 50 foot (15 meters) but the results are amazing. The map shows the history of how the river channels were changing in the course of the last 12,000 to 15,000 years.
Find out much more! In Washington State, the rugged landscape, veiled by lush greenery, conceals intriguing secrets beneath its surface. Since 2015, the Department of Natural Resources has embarked on a mission to map the entire state using Lidar technology, revealing hidden features like landslides, river basins, and glaciers. While about a third of the state has been mapped so far, ongoing efforts promise to uncover even more striking geological details, providing a deeper understanding of the region’s dynamic terrain.
Beautiful.
Did you like this post about lidar-based visualization? Read more and subscribe to our monthly newsletter!