
What day comes once every four years? February 29!
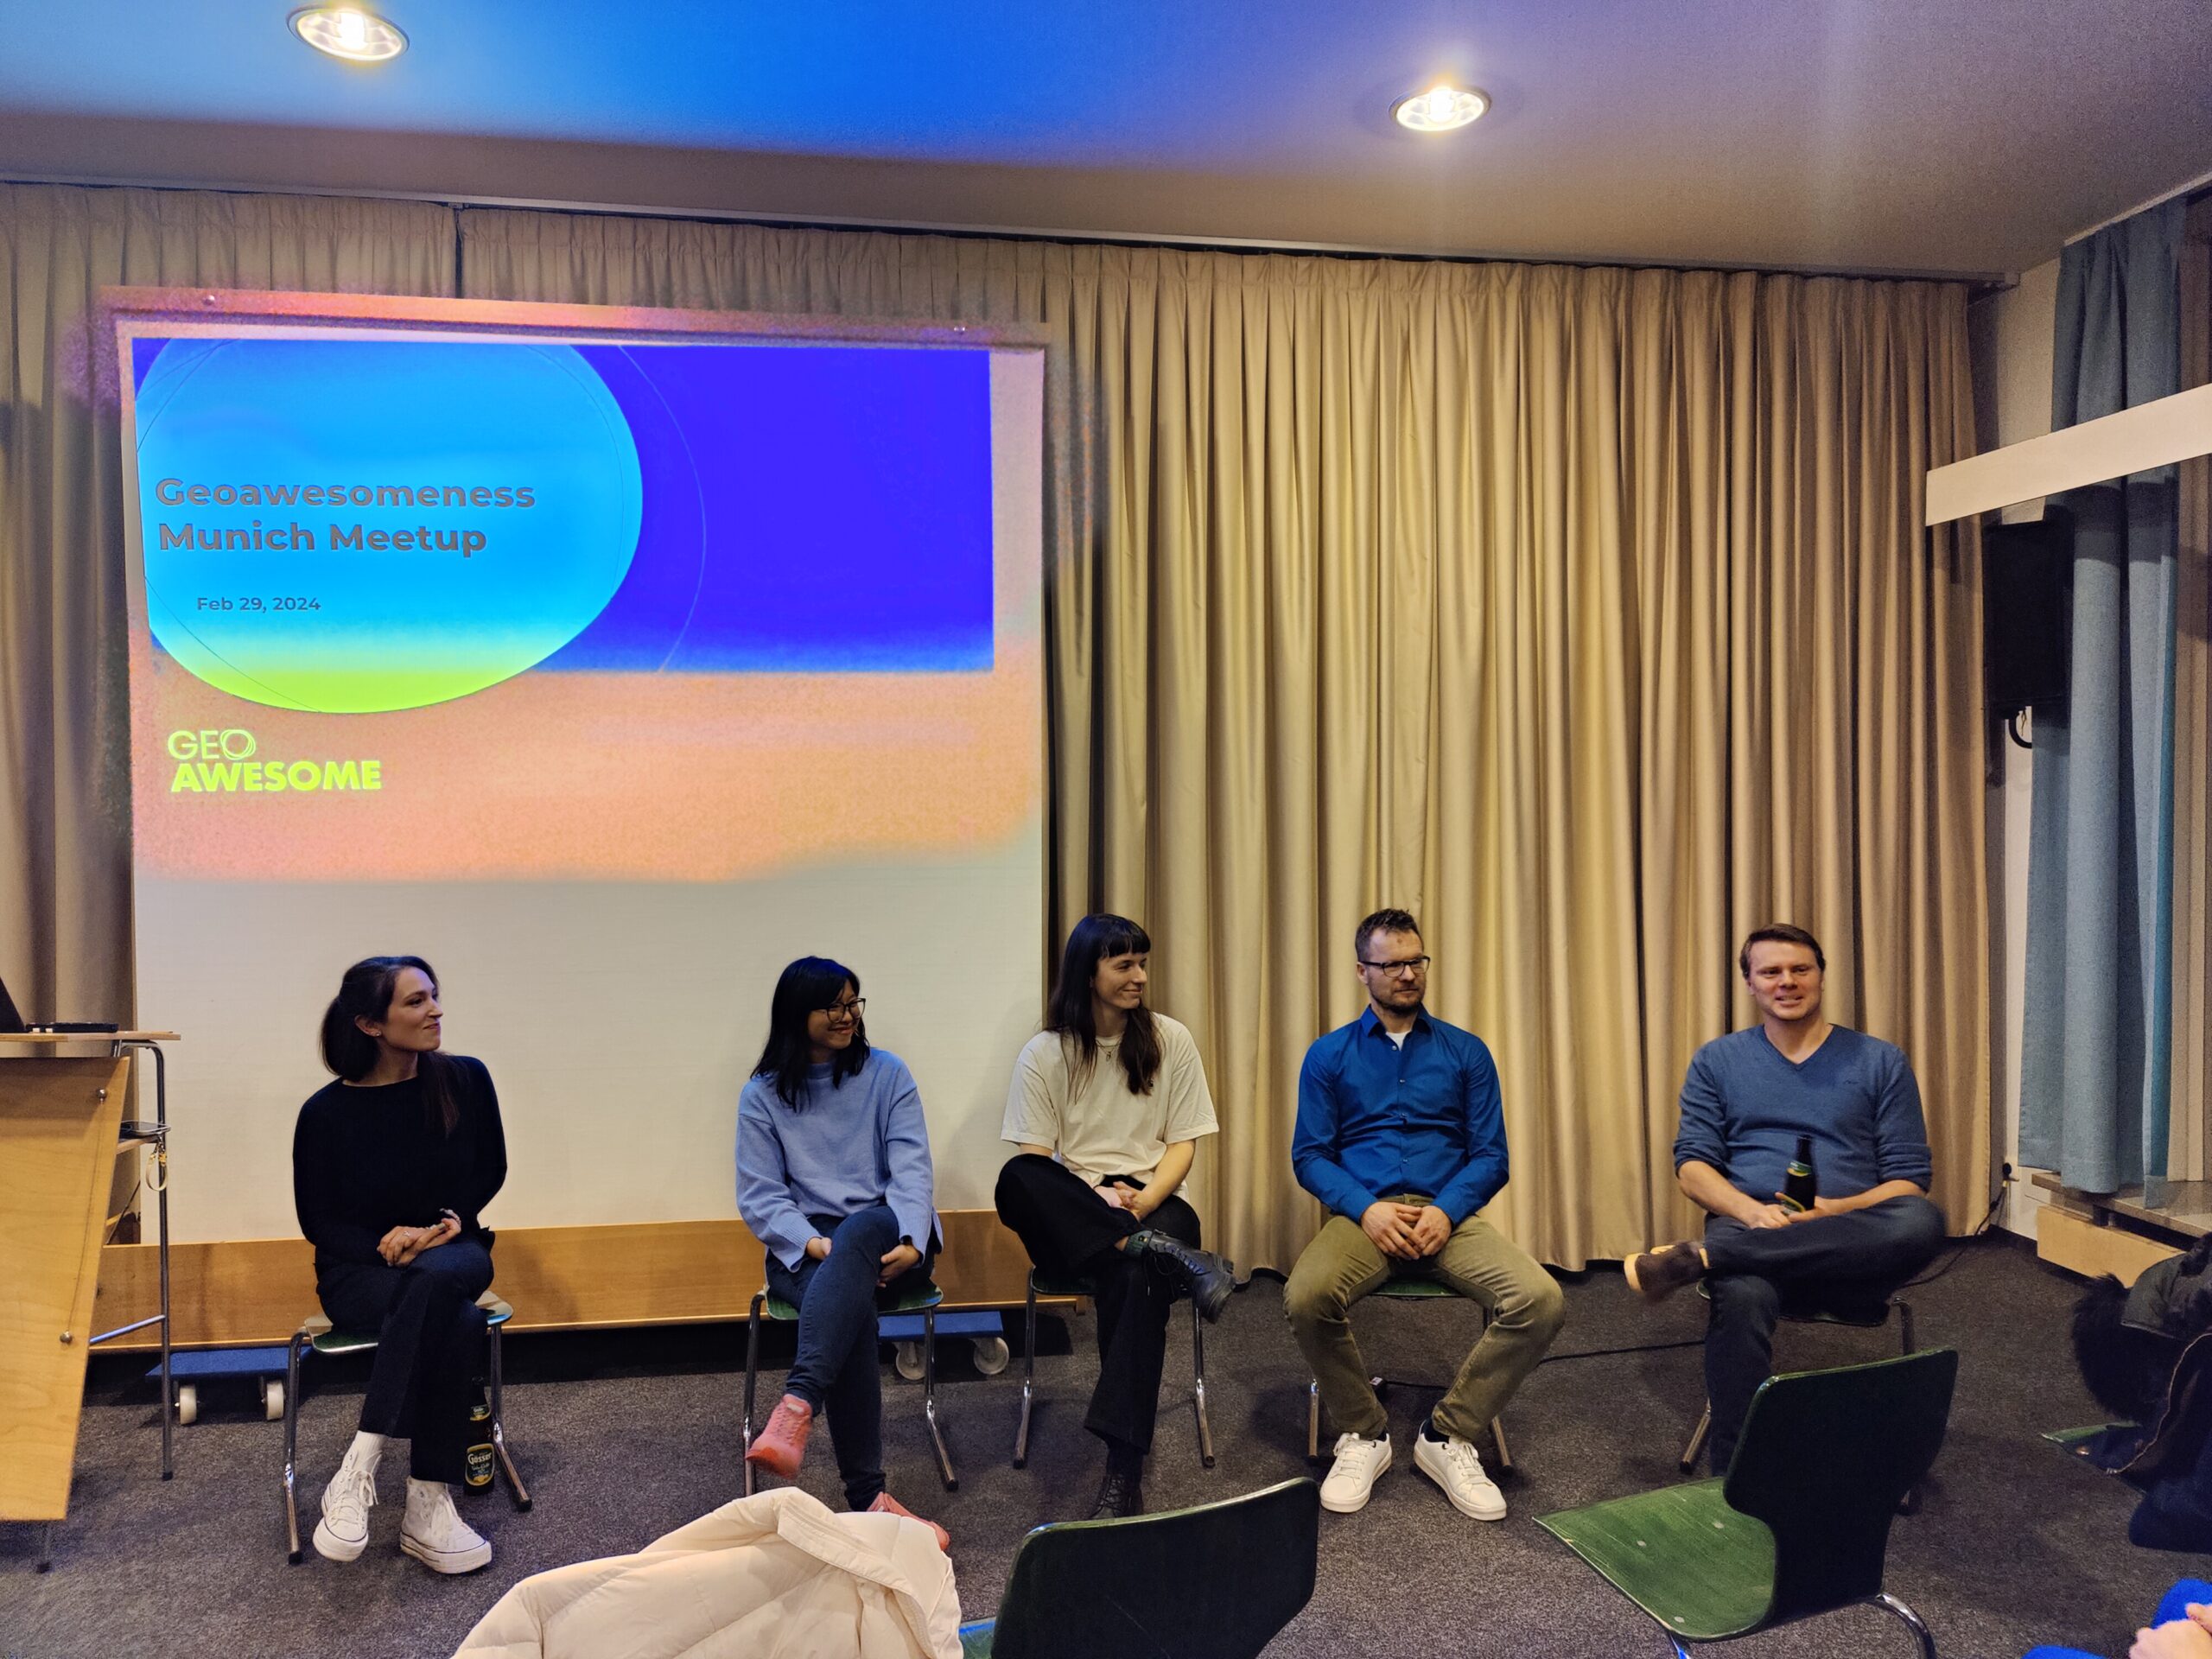
Which event pops up twice a year? The Geoawesomeness Munich Meetup!
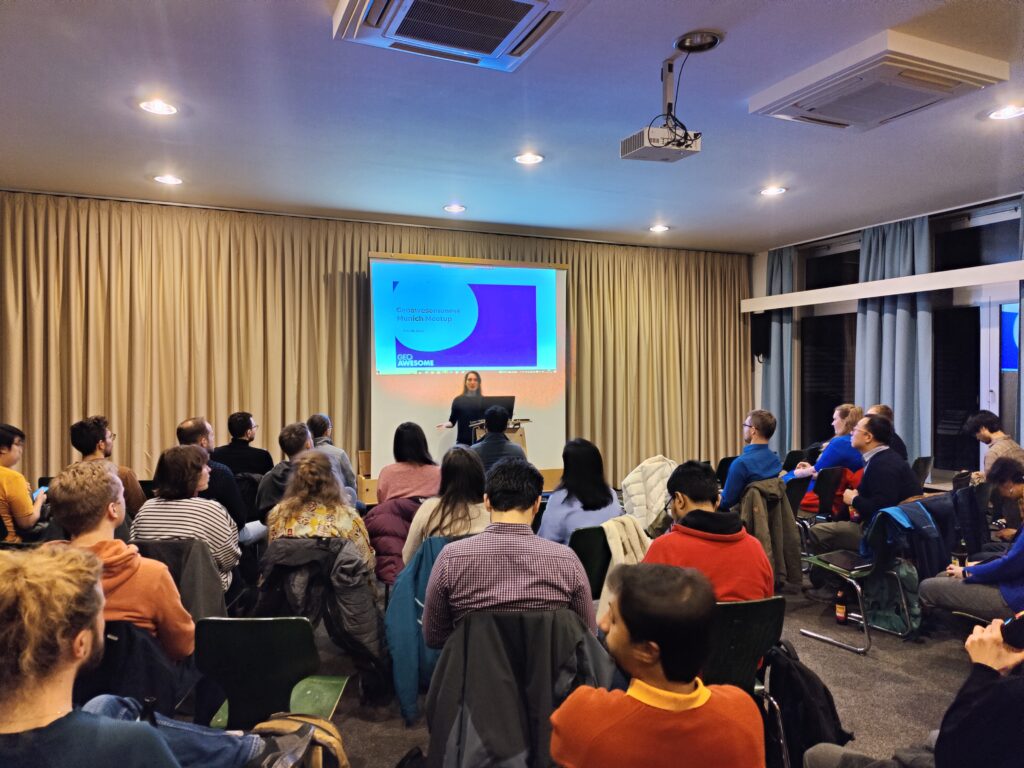
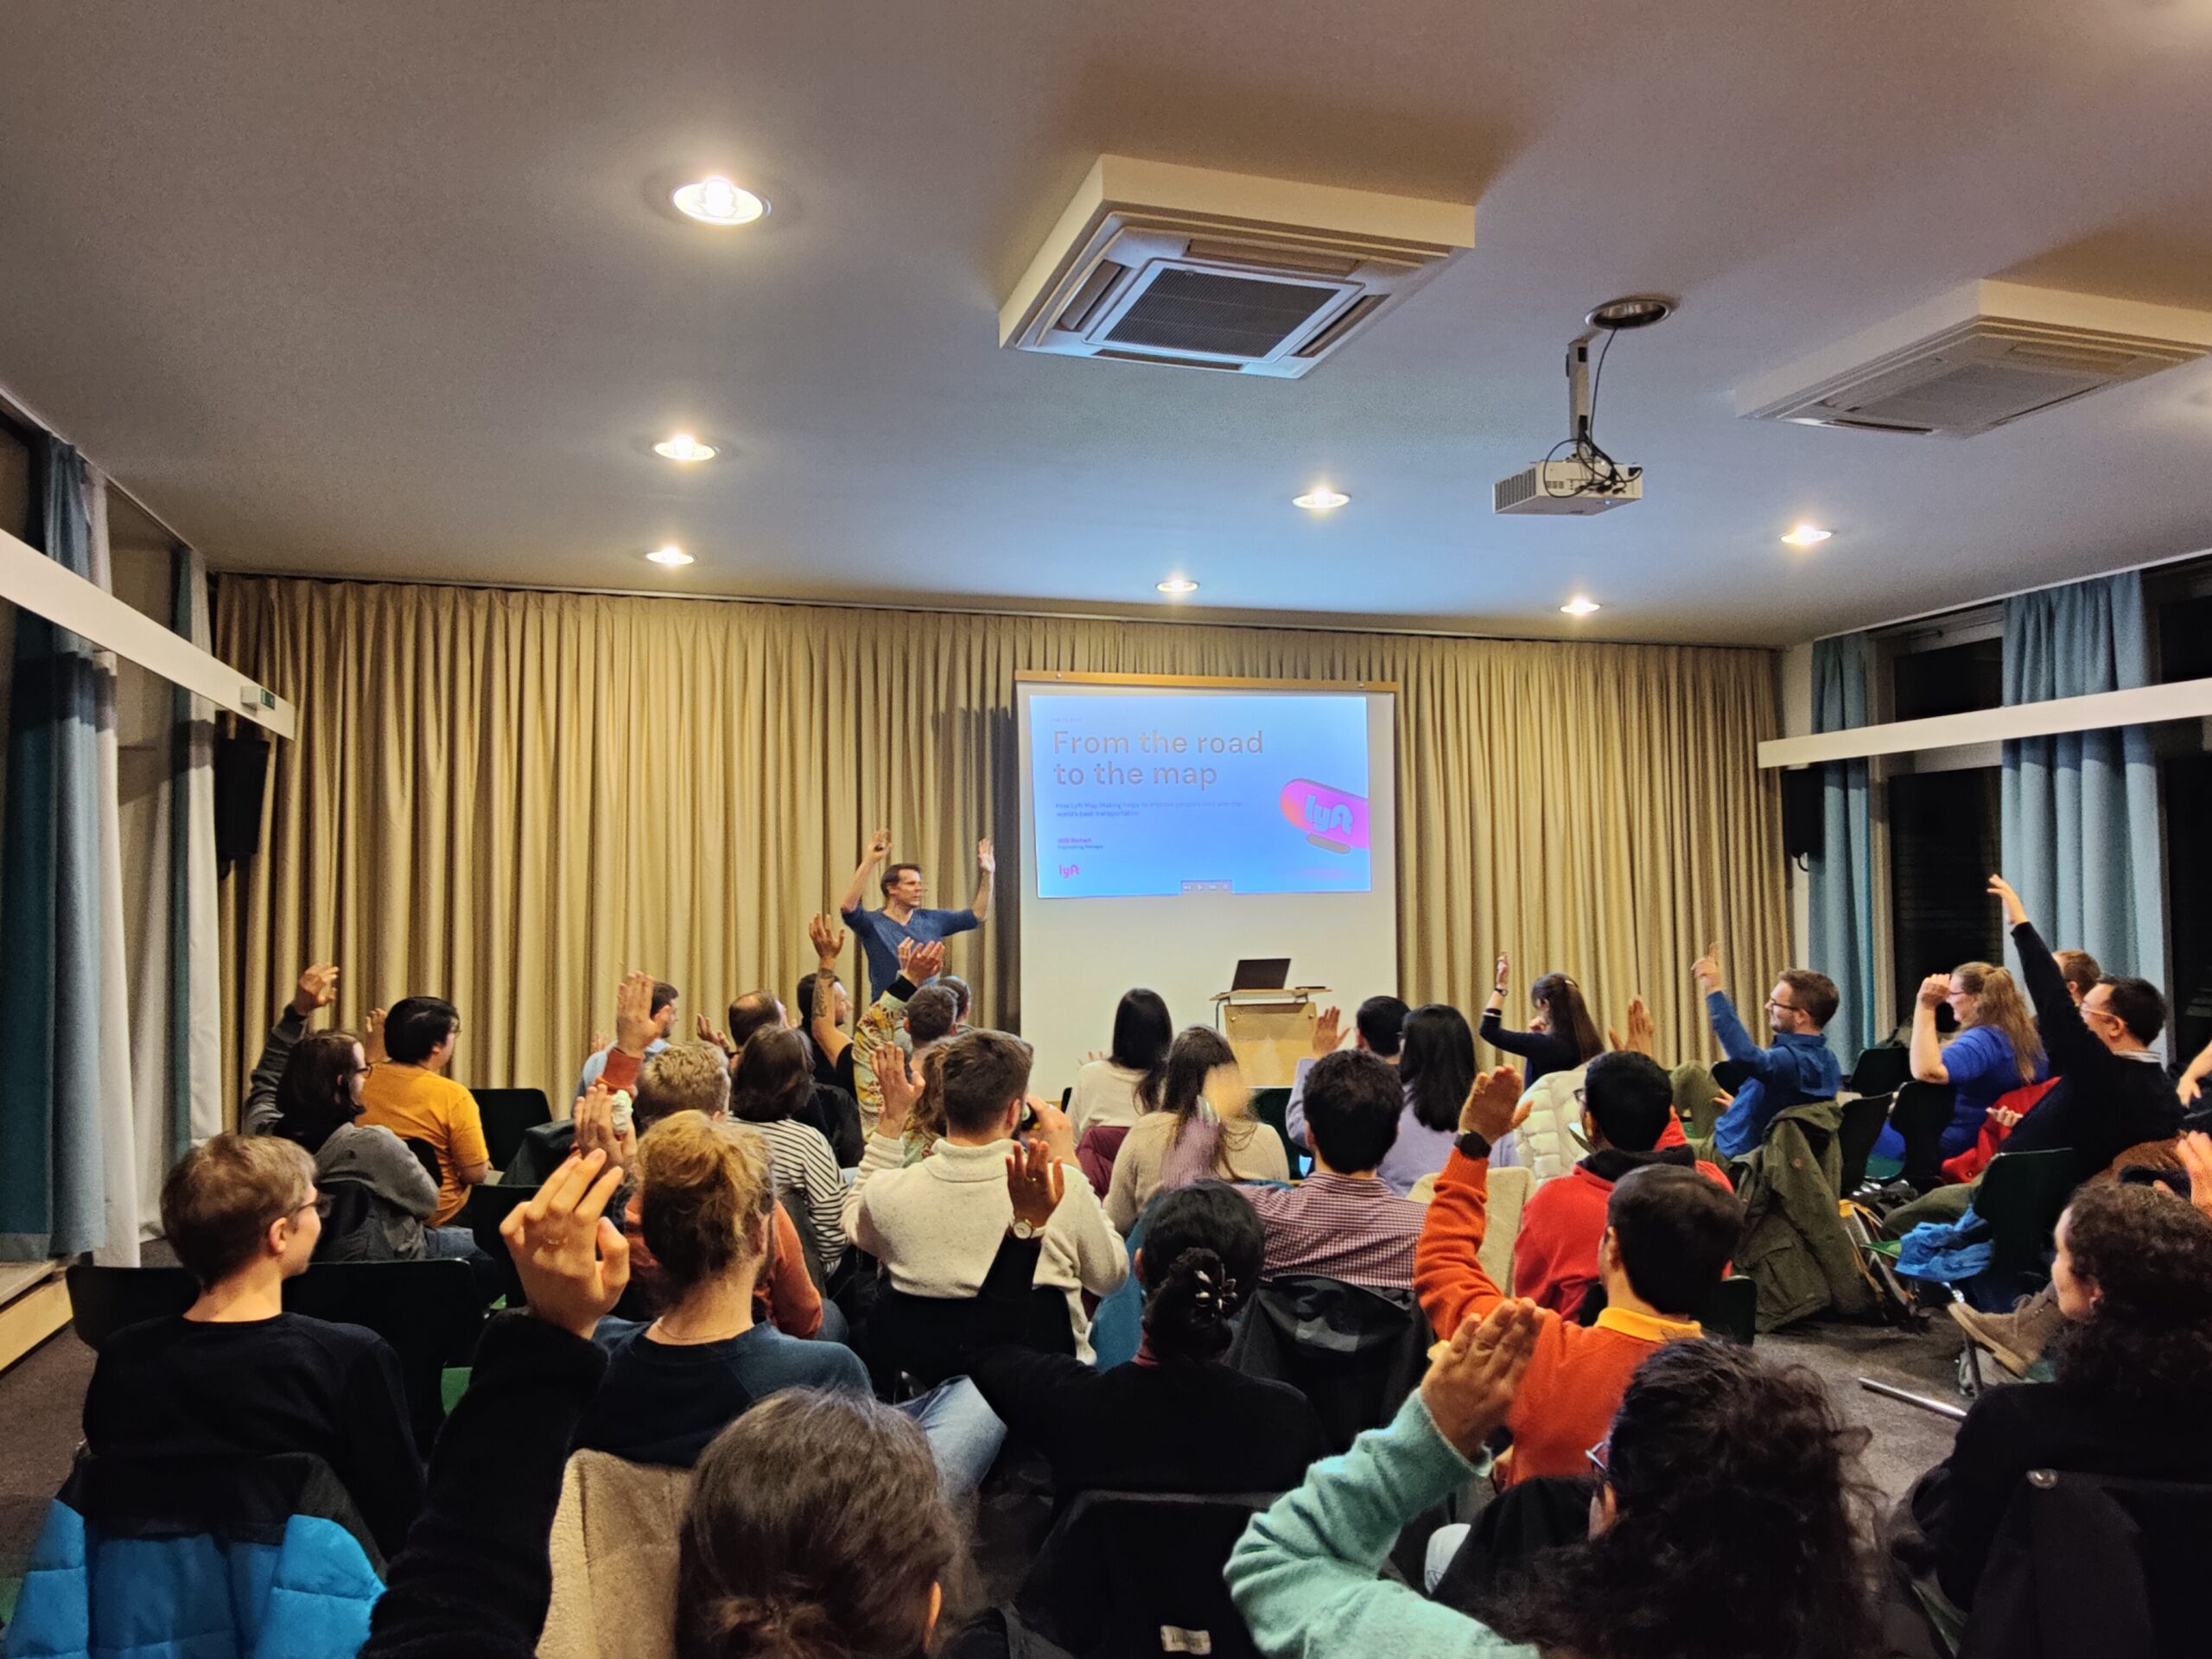
In 2024, The Geoawesomeness Munich community got together for their first meetup on that extra day, February 29. The event brought together around 65 passionate geospatial lovers, 18 cheesy pizzas, and 6 packs of cool drinks.
The evening kicked off with an introduction by our host Sara. We had a wonderful lineup of speakers, all gurus from the geospatial world, sharing knowledge and sparking conversations.
EOMAP: Can you find the plastic in satellite imagery? We can!
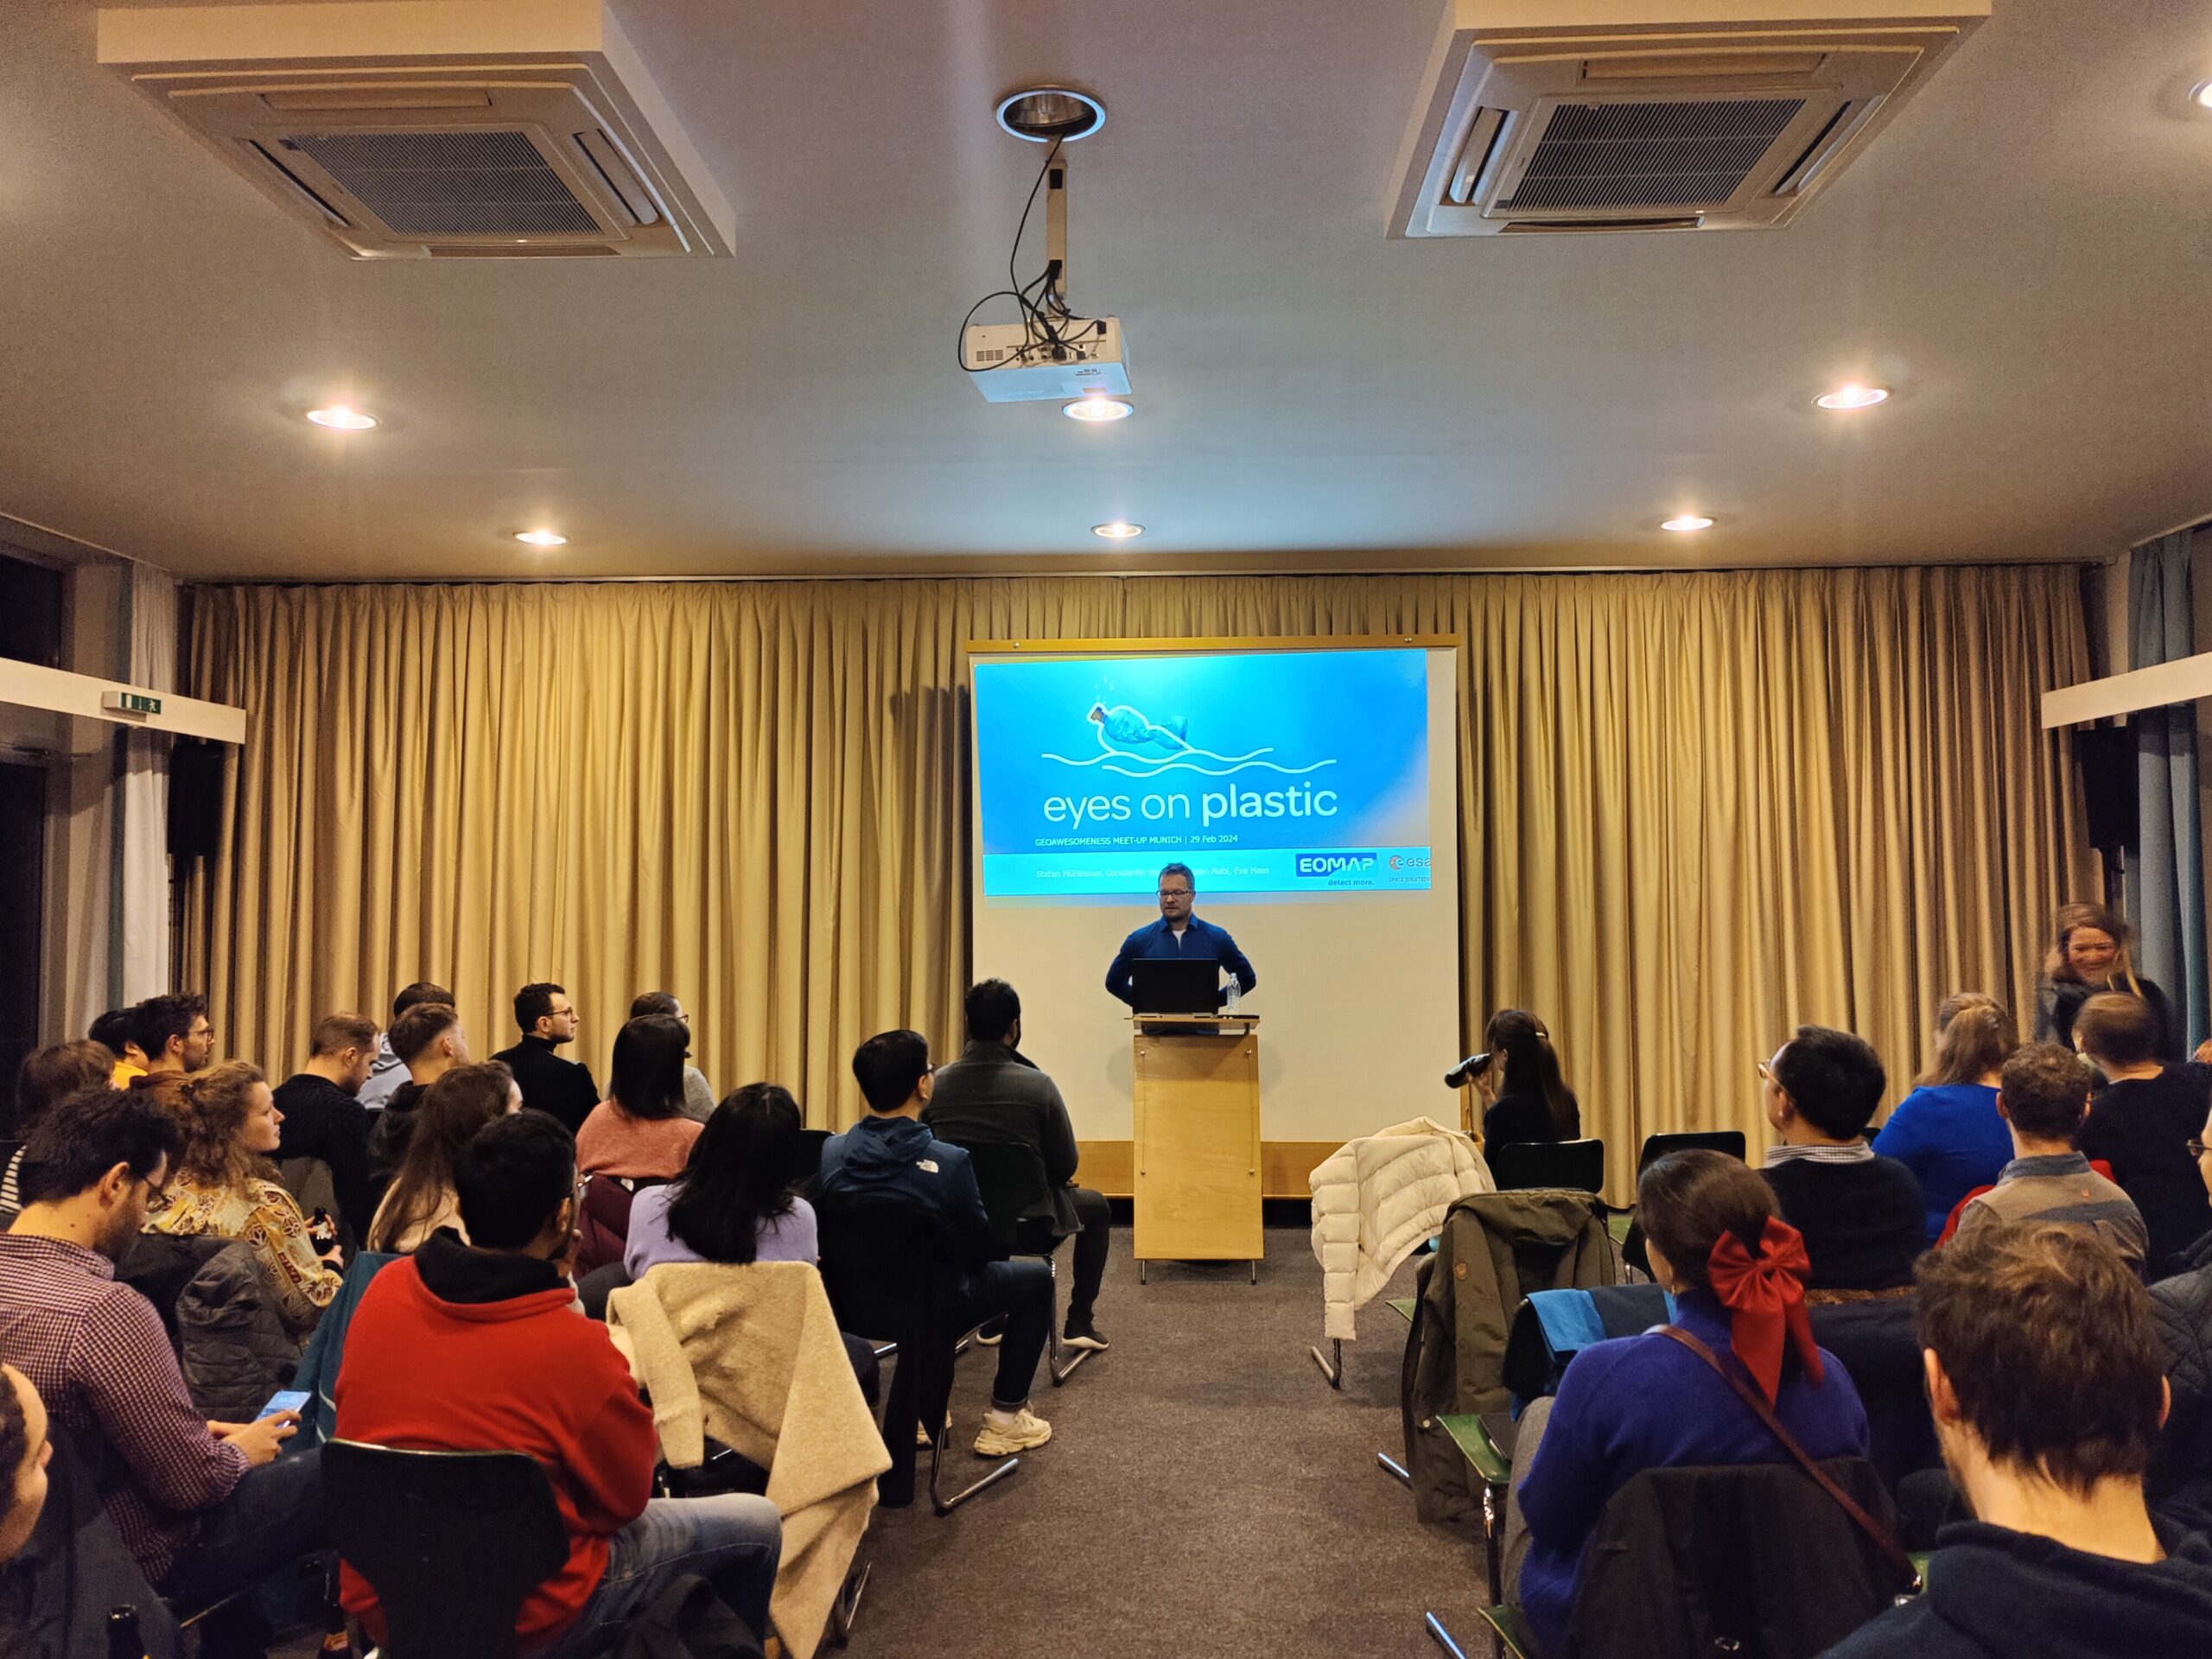
Our first speaker is Stefan Mühlbauer, Project & Product Manager at EOMAP. Stefan introduced the company EOMAP’s ambitions to revolutionize the detection and monitoring of plastic debris. The innovative initiative ‘Eyes on Plastic’ grabbed everyone’s attention immediately.
They’re using satellite data, artificial intelligence, and help from people everywhere to find where the plastic’s piling up, from rivers all the way to the sea. With their clever tools that blend satellite images and brainy algorithms, spotting plastic floating in the ocean is getting a whole lot clearer.
World Bank: User-friendly tools for heat hazard assessment
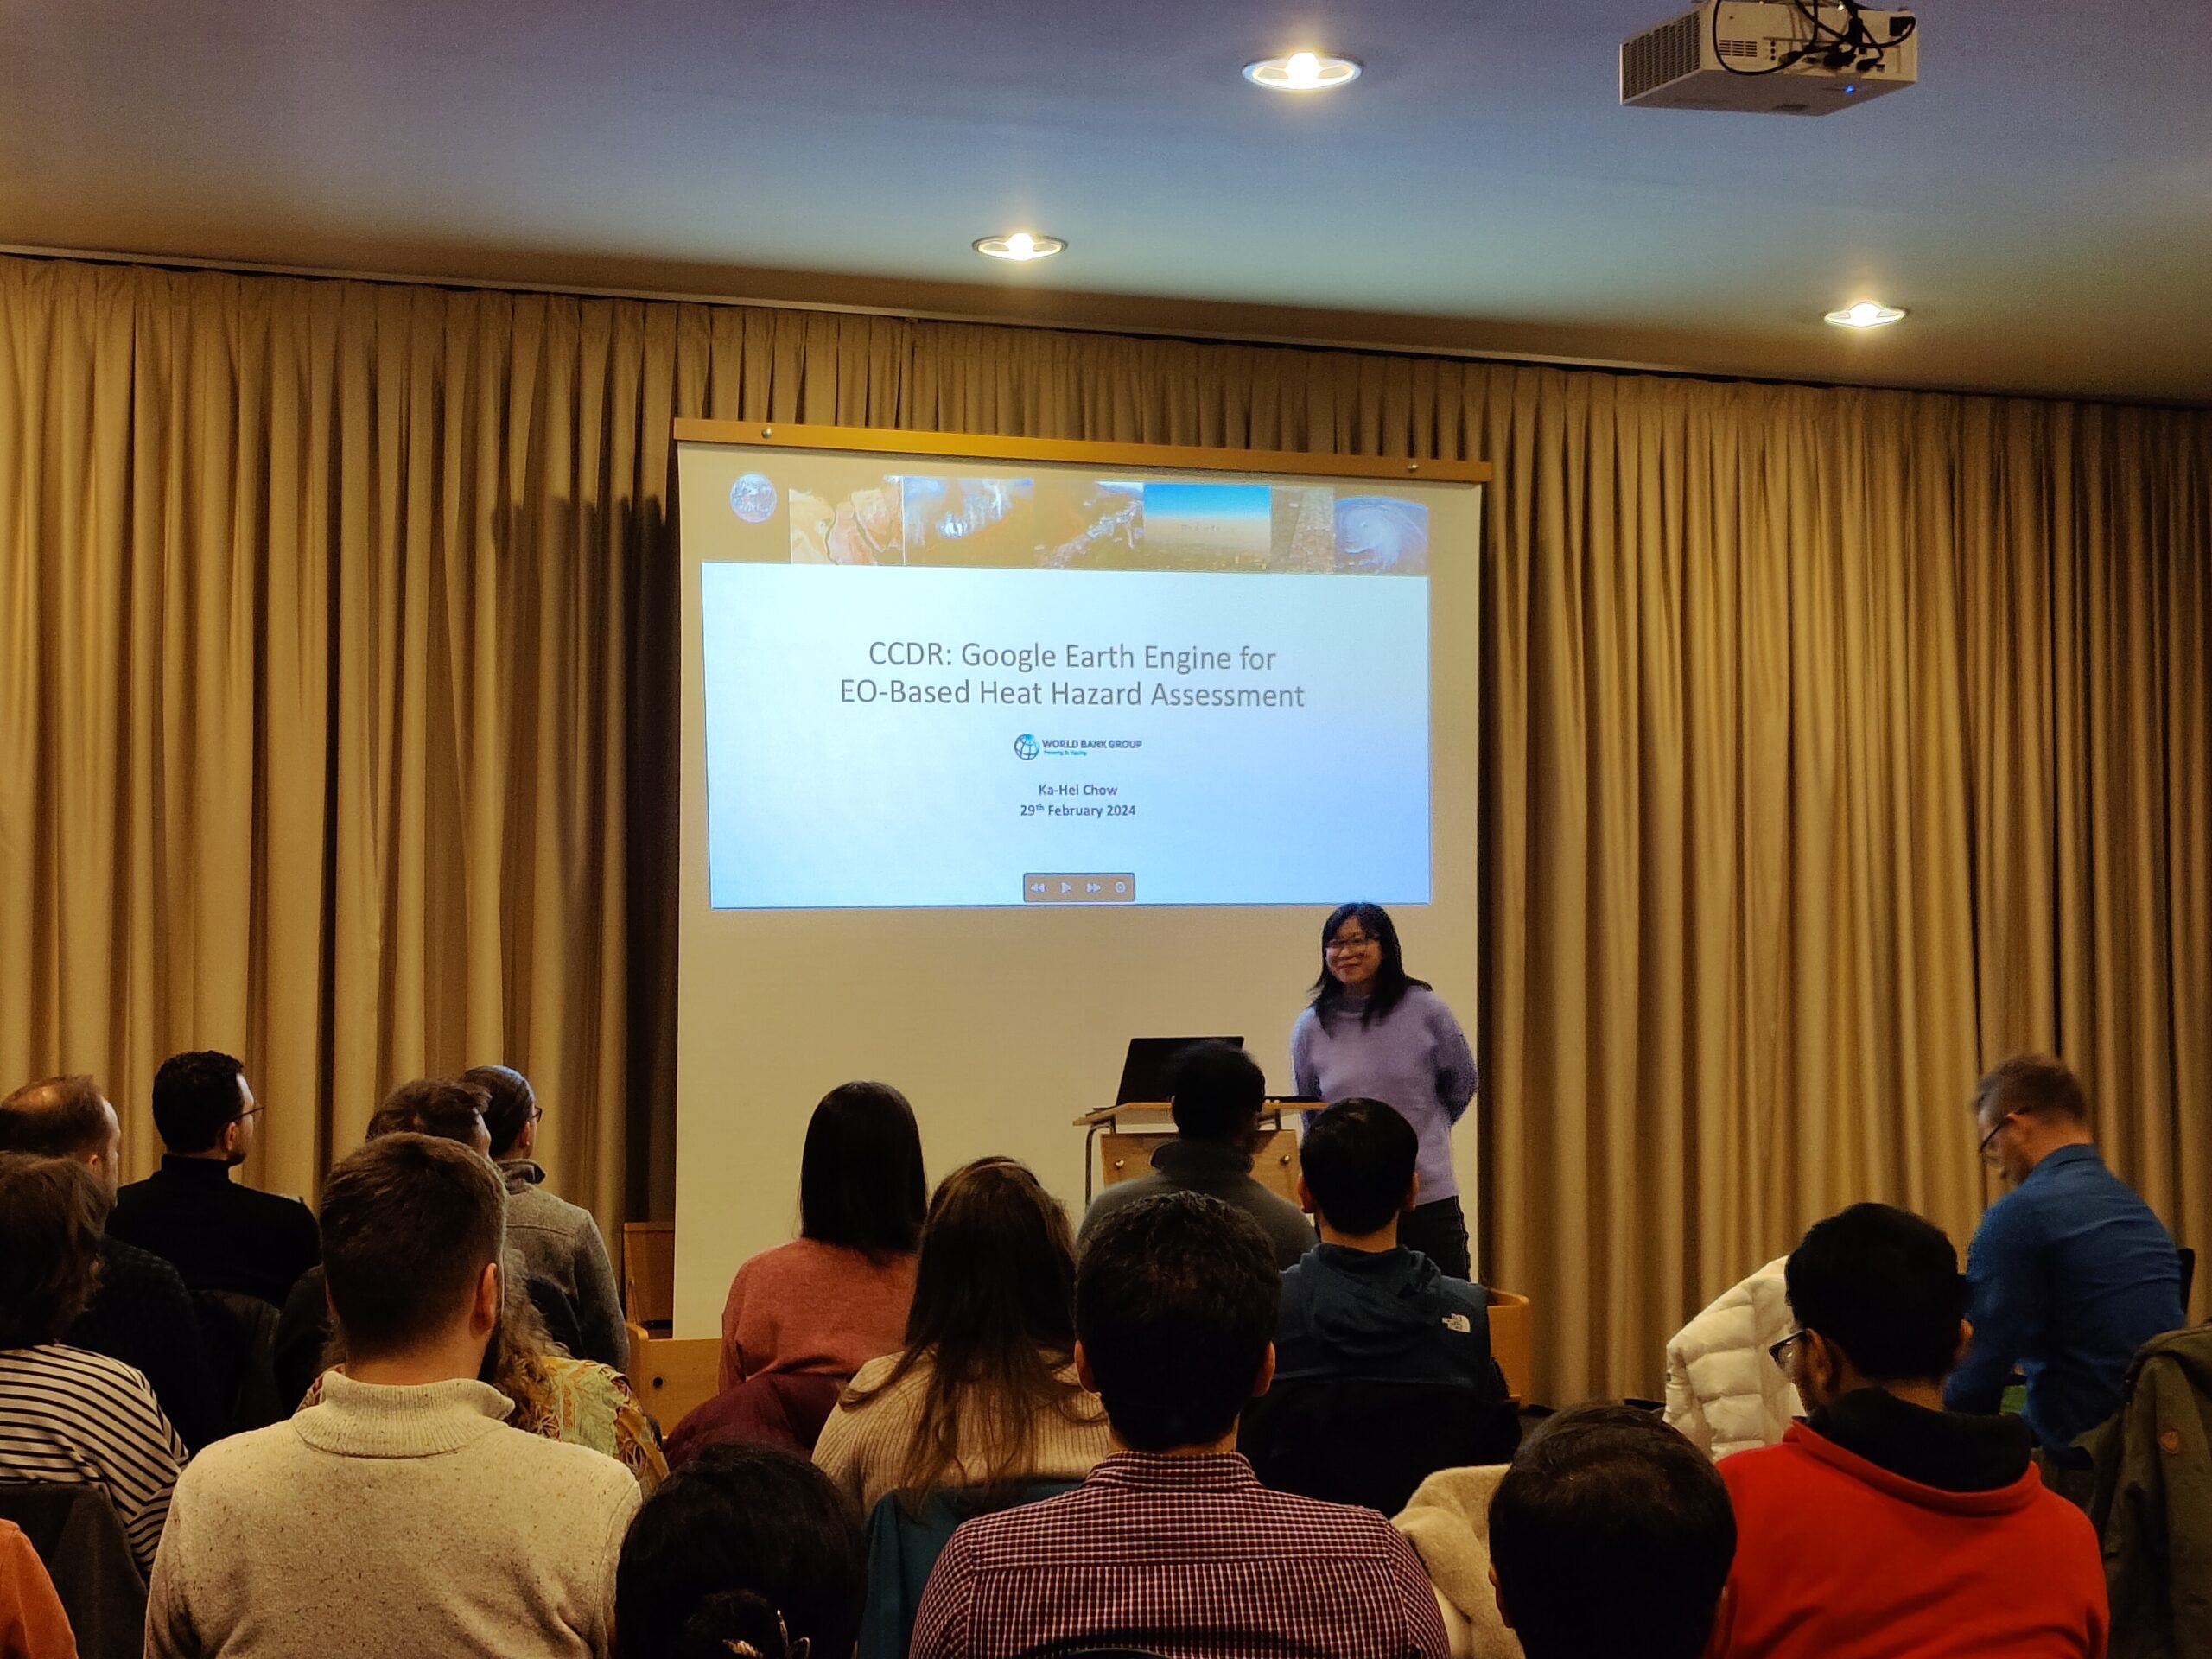
Ka-Hei Chow, the speaker from the World Bank, gave us a talk about the Google Earth Engine application in EO-Based Heat Hazard Assessment. She highlighted the Country Climate and Development Report (CCDR), which integrates climate risks into developmental planning. Ka-Hei emphasized the current challenges in data resolution and vulnerability analysis, pointing out the need for up-to-date, high-resolution data combined with demographic information to enhance the accuracy of hazard assessments.
The workshop also explored the development of user-friendly tools within the Google Earth Engine platform, which includes components such as a Data Download Tool, Data Analysis Tool, and Map Comparison Tool, to facilitate better decision-making and communication among non-technical users. These tools are designed to simplify the complexity of climate risk visualization, offering standardized, cloud-based solutions for district-level analysis, and enabling on-the-fly data processing for comprehensive project planning.
DLR ZKI: Here we are, before, during, and after the crisis
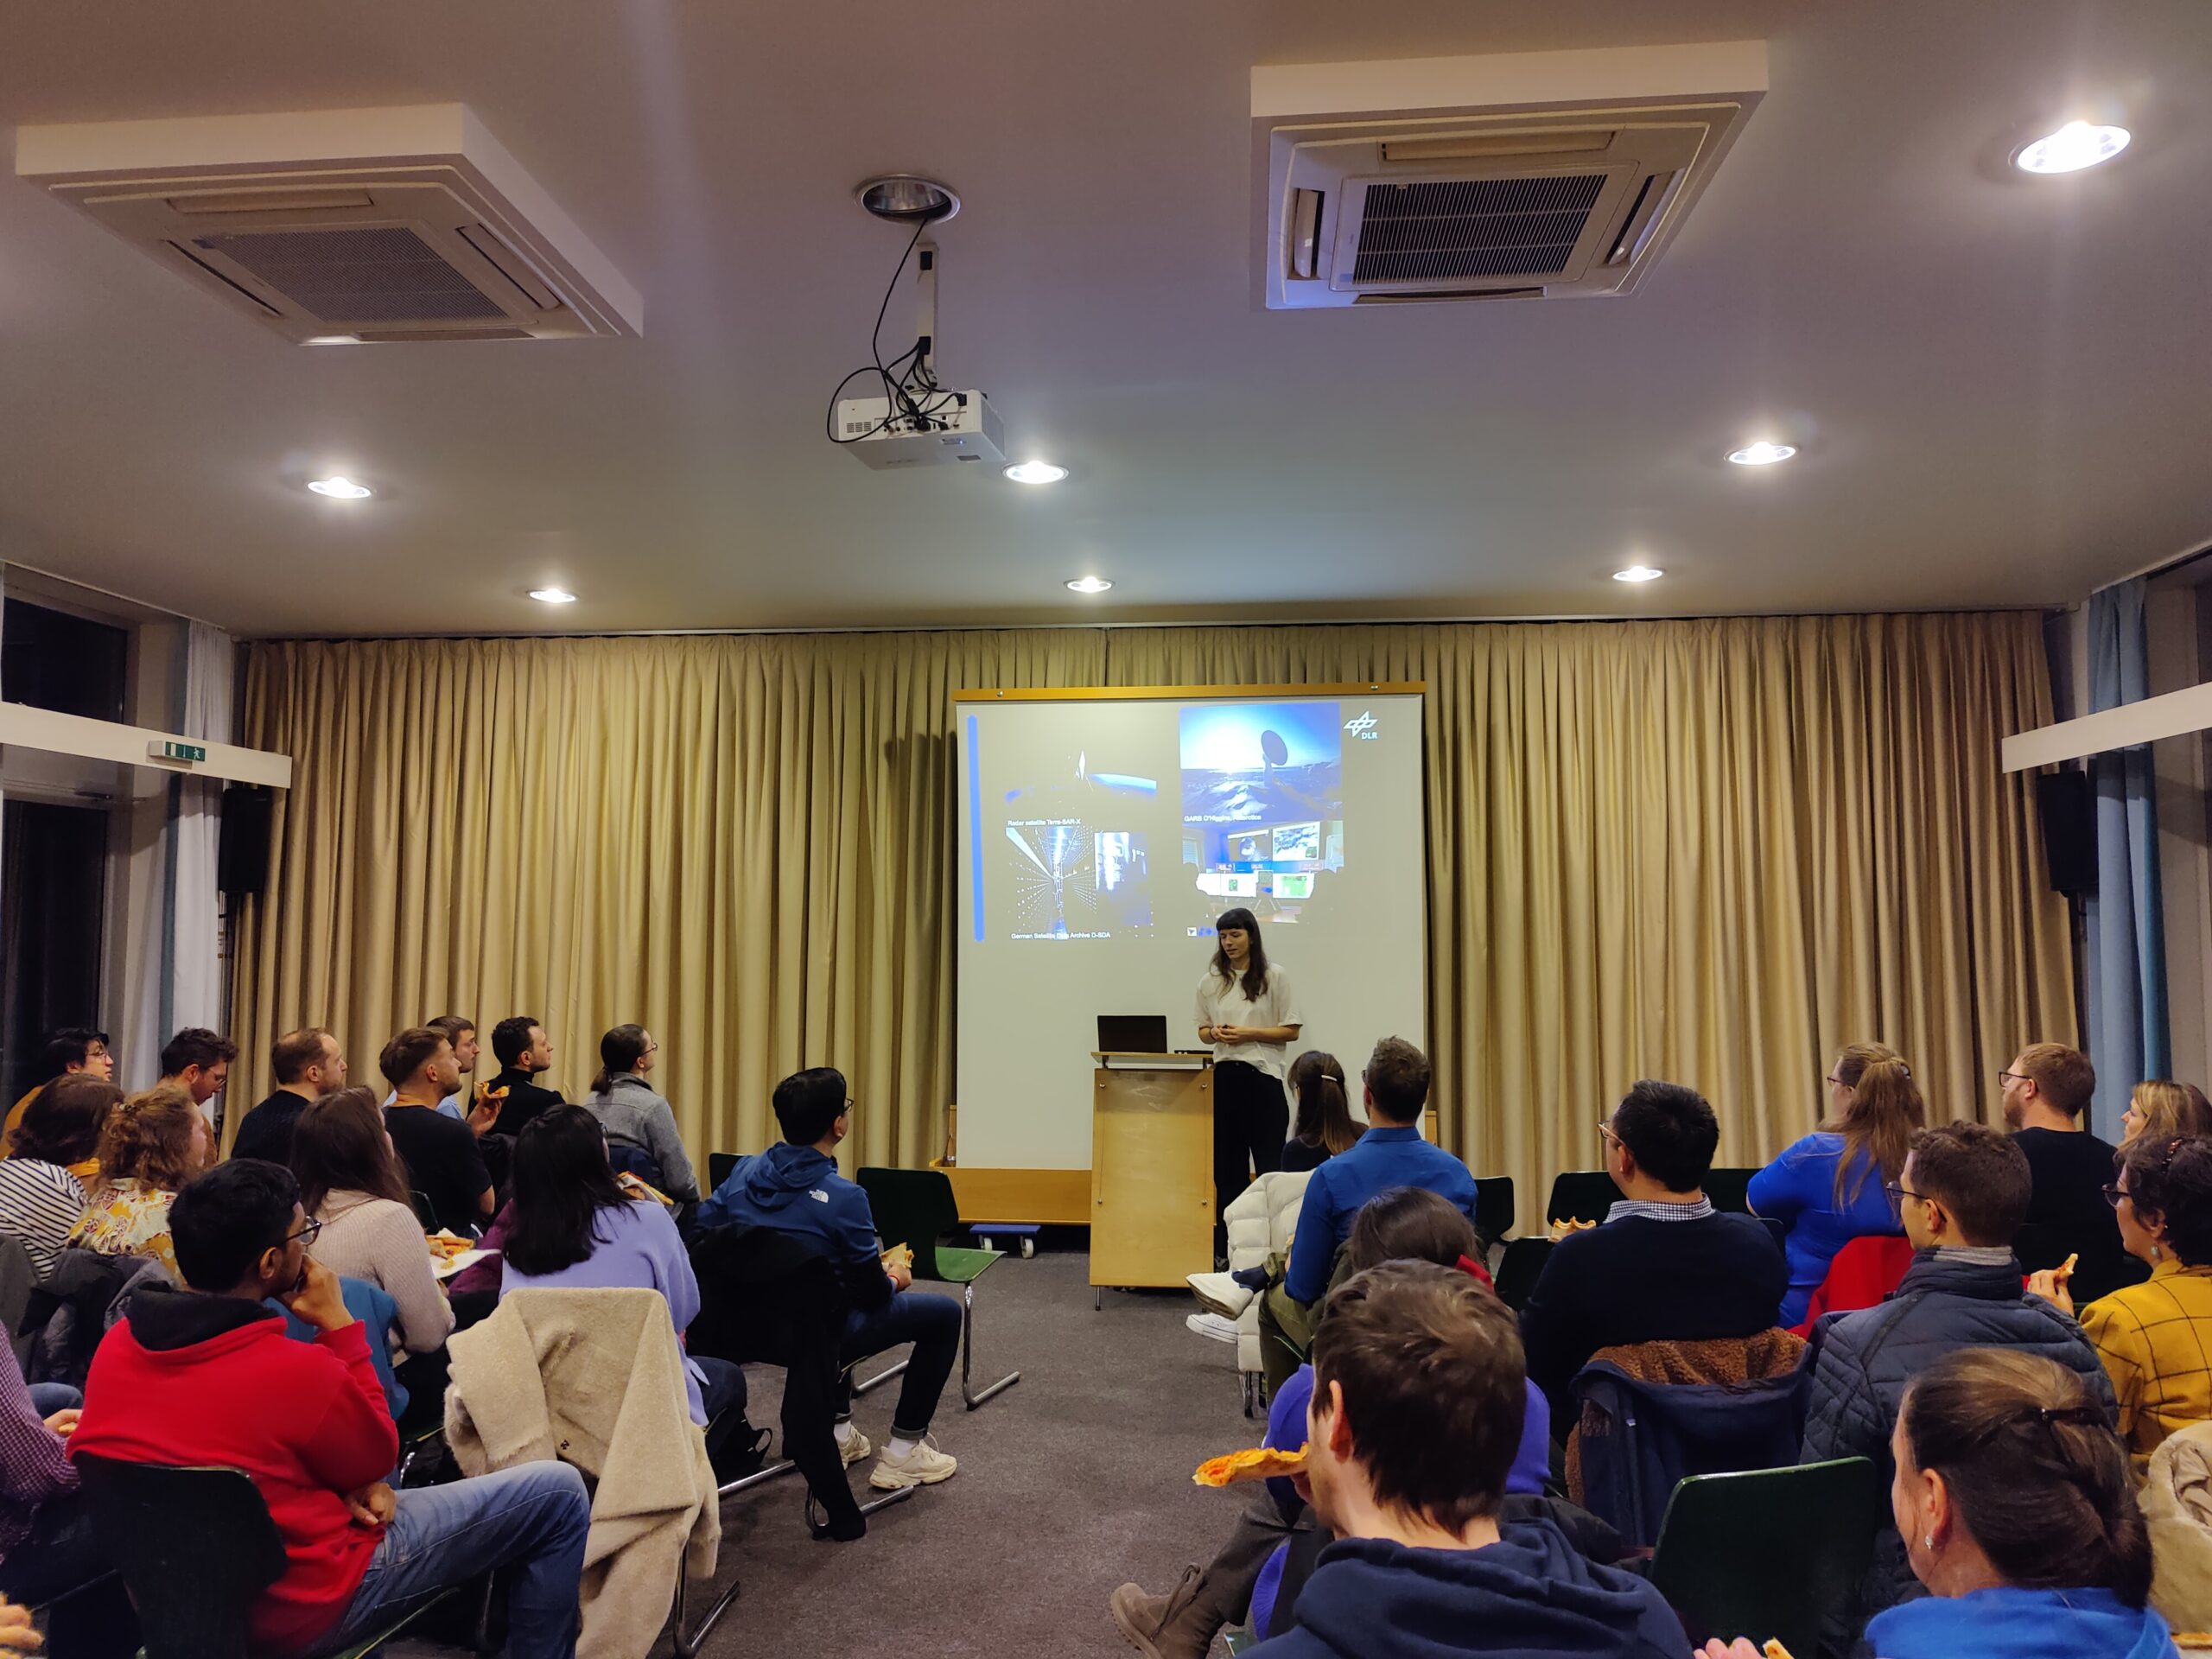
The presentation by Johanna Roll underscored ZKI’s extensive experience with over 700 activations, offering a window into their operations which span from preemptive crisis information to post-disaster analysis. ZKI, a branch of the German Aerospace Center (DLR), has developed a robust framework for utilizing remote sensing data, providing crucial insights before, during, and after crises. Celebrating two decades of pivotal contributions to crisis management, the Center for Satellite Based Crisis Information (ZKI) continues to be a beacon of innovation and support in times of need.
With advanced rapid mapping workflows and an improved system that incorporates 24/7 monitoring from various data sources, including social media, ZKI’s capabilities exemplify the fusion of technology and expertise. Their work in Germany’s flood assessment and the visualization of floodplains in Pakistan showcases their commitment to delivering precise and actionable information to governmental and civil bodies, strengthening resilience and aiding in efficient disaster response and recovery.
Lyft: How to deal with a new sign?
Another spotlight was on Willi Richert, the engineer manager from ride-sharing giant Lyft. Before sharing, he asked three questions about, whether everyone knows OSM. Not surprised, everyone knows it.
First, Willi introduced their three challenge: driver coming time, cost, and arrival time. These three challenges can only be solved by a sophisticated map.
Willi detailed the sophisticated process they employ to ensure accurate and reliable maps. He have us an exciting and easily understood case: How to update the map when there is a new no-go sign? Willi introduced how they do it in Lyft. This technological synergy aims not only to improve the ride-hailing experience but also to establish a robust framework for rapid response in times of crisis.
After the engaging panel discussion, audience eagerly bombarded the speakers with fascinating questions.
The meetup kicked off at 7pm and wrapped up at 9pm, followed by some socializing over drinks. Geoawesomeness meetups offer plenty of time for learning, networking, and sharing exciting project ideas.
A big thanks to UP42! To find out more about our supporter, visit https://up42.com.
We also want to give a shoutout to our amazing team members, Muthu and Aleks. Keep an eye out for updates on our next awesome get-together and join our lively Munich Geoawesomeness Community!
Until next time,
Your Munich Geoawesomeness Team
Abhi, Florian, Sara, Nianhua, Chris, and Karen

#Events

Next article

During times of disaster, it’s crucial to gain an understanding of what, who and how people and buildings on the ground are affected. Whether in a human-made or natural disaster, urban damage assessment of critical infrastructure is key to helping those in need and beginning the efforts to rebuild.
Using satellite imagery, Synthetic aperture radar (SAR)-based monitoring can be done to pinpoint buildings that have been damaged or destroyed.
What is SAR?
SAR is a remote sensing technique in which radar microwave signals are actively transmitted from a radar sensor mounted on a moving platform (such as satellites, airplanes, etc) to Earth. These signals illuminate the target area, and information is gathered by analyzing the reflections of the microwave pulses’ echoes. The scattering of the reflected signal unveils intricate details about the structure of Earth’s objects and is employed to measure detailed topographical information in the target area.
As the surface becomes smoother, the return signal moves away from the satellite, making urban areas, which strongly reflect radar signals, appear bright in the image, while calm water, which scatters signals away, appears dark.
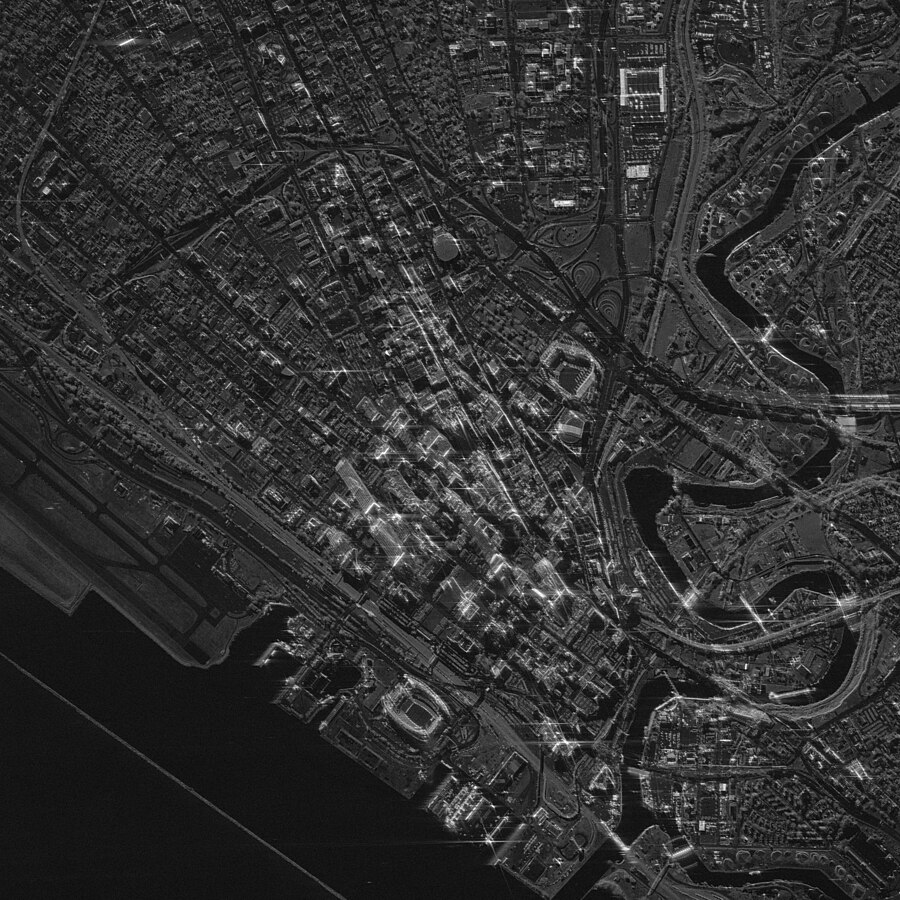
25cm high-resolution synthetic aperture radar image of downtown Cleveland, Ohio. (Credit: Umbra)
Damage assessment using SAR data
SAR remote sensing can be used to assess areas of the world—especially useful for responding to both natural disasters and anthropogenic influence.
Before and after SAR data can spot damaged land and buildings thanks to its large coverage, quick response, non-contact and weather-independence. This is a safe way to gain an understanding of the type of event, the scope and severity, as well as determine the extent of potential loss.
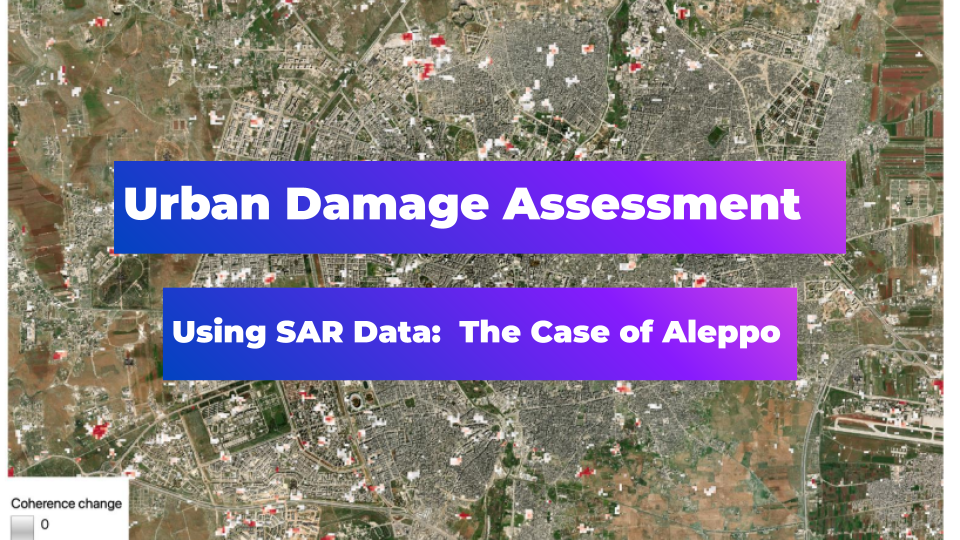
Choosing the field of study: Aleppo
To understand the way in which we can use SAR data to assess urban damage, let’s look at an area that has experienced substantial changes in its urban network during a certain period of time.
Aleppo covers about 70 square miles roughly twice the size of Paris. The 2011 civil war in Aleppo devastated the city and according to some estimates, in 2016 alone, approximately 36,000 buildings were damaged or destroyed.
First, let’s look at specific urban areas for damage assessment, focusing on those impacted between April 17 and April 29, 2016. This timeframe is significant because, during this period, the conflict in Aleppo escalated significantly.
We’ll take a closer look at assessing the damage soon, but first let’s dive deeper into SAR and how it works.
Why SAR?
Since Carl A. Wiley pioneered SAR technology in 1951, its uses have expanded significantly, making it an essential tool for monitoring crop harvesting, urban development, snow conditions (wet, dry, snow-free areas) and evaluating vegetation damage due to wildfires.
Unlike traditional Earth observation sensors, which rely on external energy sources like solar radiation to capture meaningful images, SAR sensors operate independently by actively emitting microwaves. This independence allows them to operate effectively during the day or night and penetrate through clouds and various covers.
As mentioned, SAR data is a valuable tool to increase situational awareness, especially in critical areas.
Evaluating the changes in Aleppo with SAR data is a real-life application of its humanitarian use in order to assess damage in urban settings due to conflicts or natural disasters.
This use is employed by a range of entities focused on observing the effects of similar events. NASA runs a training course focused on the topic named ARSET – Humanitarian Applications Using NASA Earth Observations | NASA Applied Sciences. In it, learners find out how to monitor urban damage using satellite imagery and the humanitarian applications of this.
Assessing damage through InSAR techniques
One of the most well-known methods used to analyze SAR images for damage assessment is a technique called InSAR. InSAR uses the phase information provided by the SAR image, to measure the range between the sensor and the target by counting the number of wave cycles travels before returning to the satellite sensor.
Conducting at least two observations of the same target enables the use of the range information, along with additional details about the radar sensor’s location, to measure changes in the land surface and consequently identify altered areas. Moreover, InSAR helps us figure out how scattered things are in that area.
One of the challenges in damage assessment is the confusion caused by changes that aren’t related to actual structural damage. A significant factor contributing to this confusion is geometric distortion, which arises from the difference in side-looking viewpoints between two radar images from the same satellite. This difference can make things look a bit stretched or squashed in radar pictures, disrupting how well the images match each other.
When mapping damage on Earth’s surface using radar images, minimizing the difference between viewpoints caused by different satellite locations helps obtain clearer and more accurate results. It’s like taking pictures from nearly the same spot, which enables a better comparison to detect what’s changed and figure out the real damage.
How to assess urban damage using SAR data
There are various data providers to access SAR data from. These range from both free and paid and are available on a variety of platforms.
In this article, we’ve used free Sentinel-1 satellite data for urban damage assessment. This project was developed by the European Space Agency (ESA) and launched in 2014.
In the effort to assess and map damage in Aleppo, the assumption was made that damage leads to changes in the scattering profiles of city features and disrupts the temporal stability of the image.
To carry out this damage assessment and to detect this decrease in coherence, one “reference” and one “event” coherence image must be created. This involves using three SAR images to form two InSAR pairs: one pair for the pre-event period between April 5 and 17 and another pair for the event period between April 17 and 29.
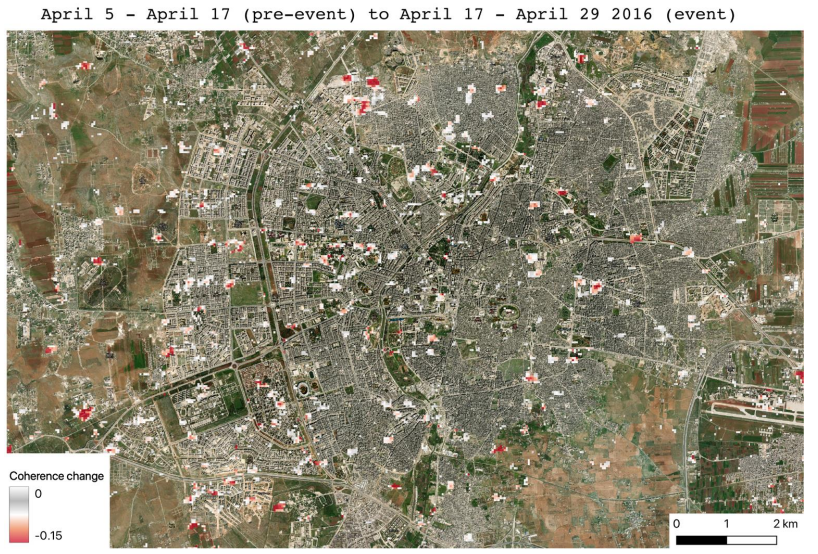
From the first pair of images, regions with low pre-event coherence indicate confusion due to factors like geometric distortion. For the event period pair, areas with either equal or increased coherence are masked out, implying that the observed features in those specific regions have maintained consistent or unchanged scattering characteristics over time.
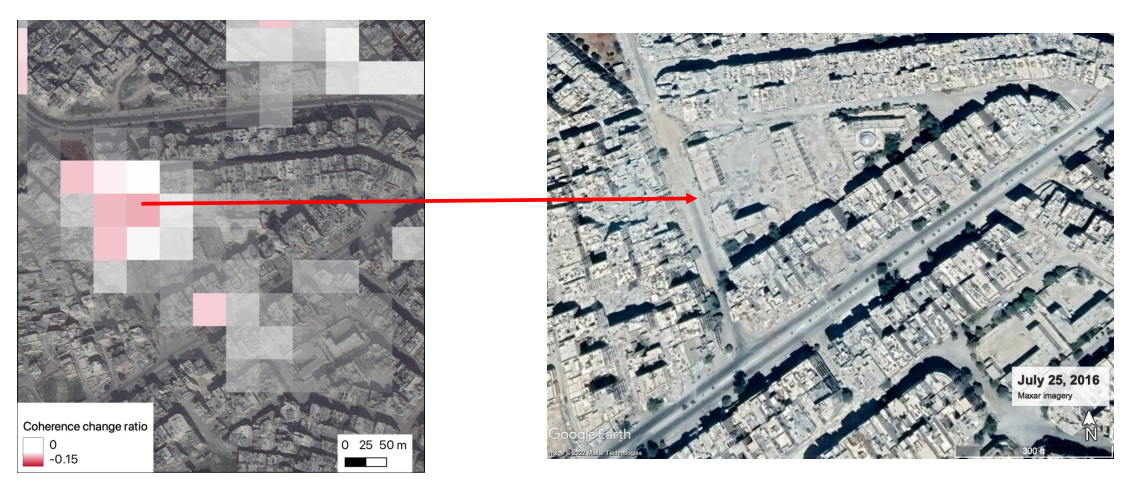
Once these masks are applied to the event image, a map indicating damage proxies is generated, revealing points of damage. Every red point on the map represents a damaged area, and as the coherence decreases, the extent of the damage increases. This map can be visualized using any of Esri’s products, such as ArcGIS, or Google products like Google Earth.
These coherence anomalies or damage points serve as guides for optical image analysis using Earth Observation (EO) satellite data, enabling the observation of damage on the ground.
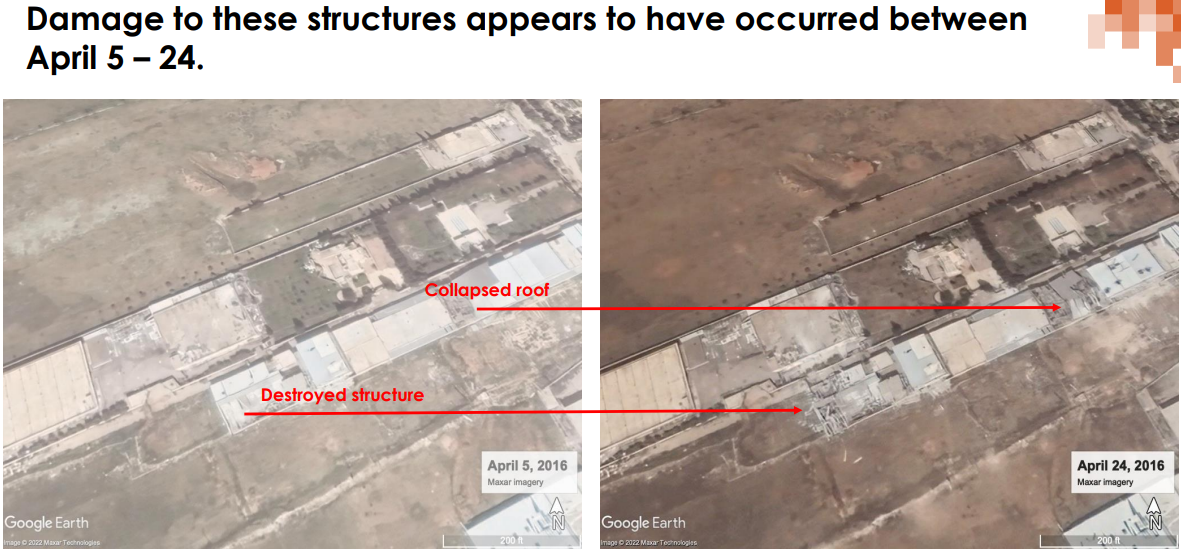
(Figure 3) Credit: NASA
(Figure 4) Credit: NASA
As you can see from the images above, damage to the structures appears to have occurred between 5-24 April 2016.
SAR data analysis is crucial for monitoring such urban damage, providing essential insights for damage assessment.
In addition, it enables informed decision-making and strategic planning for the redevelopment of affected areas. As a valuable tool in post-disaster reconstruction efforts, SAR imagery offers a baseline to assess the extent of damage and then monitor progress during the reconstruction phase.
The future of SAR
Today, particularly amid the ongoing conflict in Gaza, numerous media and human rights organizations rely on SAR analysis as a method of monitoring and covering disasters. This has been crucial in creating many reports that deepen our understanding of what’s going on the ground and the devastating impacts this has on both communities and the environment.
In the past, SAR technology and data were predominantly the domain of governments or entities with substantial resources. However, in today’s world, many organizations and even enthusiasts are actively working with SAR to create new insights, benefiting from the reduction in costs and the ease of analyzing SAR data.
According to a recent report from Consegic Business Intelligence, the utility of SAR technology is only at the beginning stages, with the market projected to grow by 11.8 percent between 2023 and 2030.
Moreover, the demand for SAR imagery is rising in sectors such as agriculture, forestry, oil and gas, and environmental monitoring. These applications are not only limited to monitoring and assessing crises and environmental hazards but also, before a disaster occurs, SAR data can provide early warnings, such as volcano alerts.
This availability of SAR imagery and analysis facilitates improved fact-checking and damage assessment while highlighting its potential to foster collaboration and support during times of need.
Did you like this article? Sign up to our newsletter!