
Deforestation and forest degradation take the second place in terms of greenhouse gas emissions after the burning of fossil fuels. Together with peat land fires they accounted for around 15% of global anthropogenic emissions of carbon dioxide between 1997 and 2006 and thus are a key driver of global climate change.
What is forest degradation?
Forest degradation is a qualitative change of forest structure as a result of anthropogenic or natural disturbances. The main anthropogenic driver in (sub)tropical countries is unsustainable logging caused by an expansion of timber demand due to economic and population growth. Other meaningful contributors are burning, disease or insect infestations, shifting cultivation, fuelwood extraction and the defragmentation of intact woody landscapes through deforestation.
The faces of degradation are manifold: it may present a small-scale textual change of the canopy structure or height, subtle disruptions, but can also end up in almost deforested areas with numerous patches of bare soil. Forest degradation always entails a loss in carbon structure, which can sour up to 75% depending on the location, type of forest, the intensity and extent of degradation. Apart from the decrease of above-ground-biomass, forest degradation is often a precursor to further forest loss, for instance when logging areas expand and finally end up in deforestation.
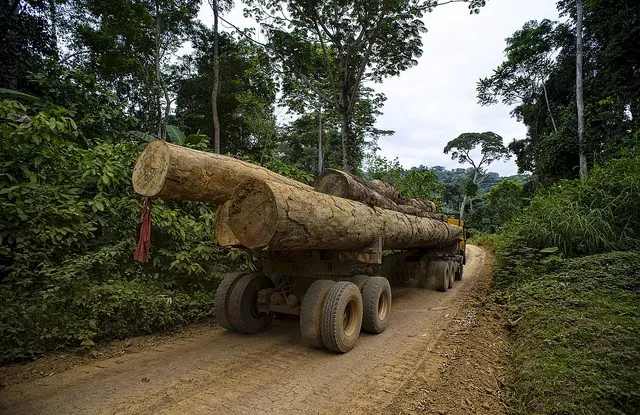
Logging is an important driver of forest degradation. Source: Forest news
Mapping the issue
Deforestation has been a successful application domain of earth observation data for many years leading to numerous studies, map products and initiatives. In contrast, the mapping of forest degradation is more challenging and still in early stages owing to the complexity of the concept: It becomes manifested in a often subtle change in forest canopy structure that is more difficult to detect and quantify than its complete removal. Earth observation has the potential to capture those forms of degradation that have a measurable effect on the canopy structure such as a change in spectral response and fractions or the formation of canopy gaps. Degradation processes which occur under the canopy of forests such as fuelwood extraction and understorey grazing are not detectible by remote sensing altogether.
The methods developed and tested rely on multi-resolution optical, synthetic aperture radar (SAR) or LiDAR data. Each sensor type has strengths and deficiencies. The combination of data from different sensor types can help to overcome shortcomings from a single source. Forest degradation has different effects in satellite imagery dependent on location and forest type. Thus, its detection requires rather a regional approach than a single monitoring strategy. The different degradation types determine the remote sensing method that will (need to be developed and) bring most success to capture it.
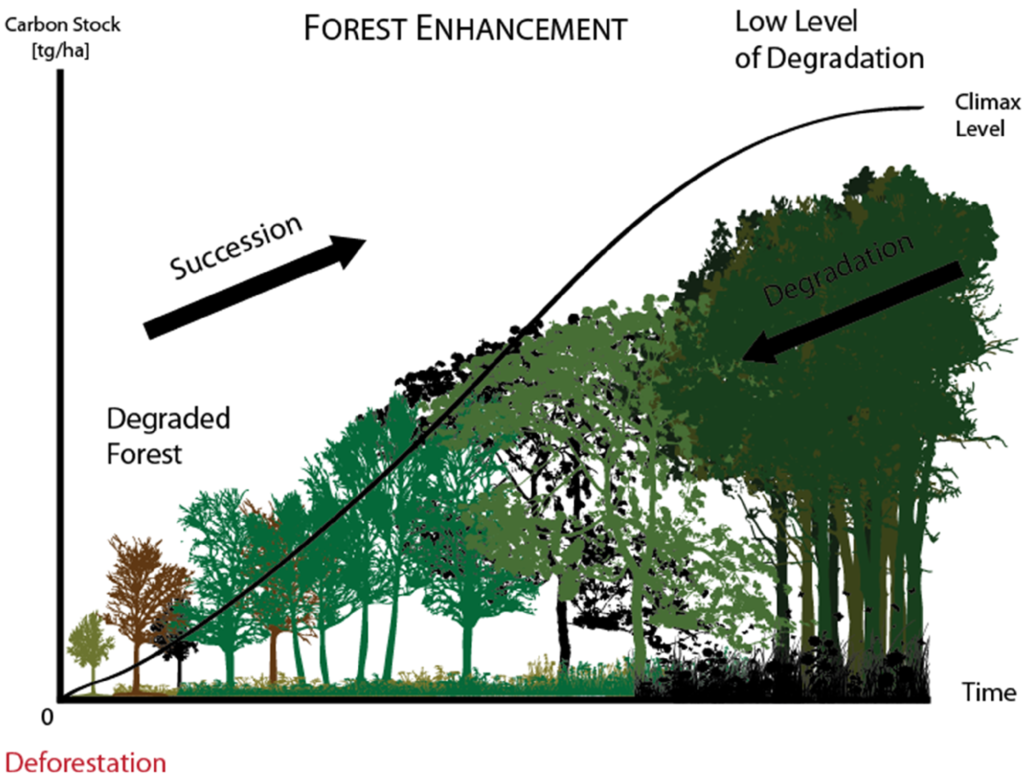
Figure of different forest stages. (Source)
Suitable remote sensing data for mapping, monitoring and quantifying forest degradation by sensor type
OPTICAL DATA
- Optical sensors capture forest disturbances through their manifestation as change in spectral fractions and responses of the canopy
- Degraded forest pixels contain fractions of vegetation, dead wood, soil and shade. The fractions can be isolated, for instance by Spectral Mixture Analysis (SMA), to classify the degree and extent of degradation. SMA measures the loss of vegetation either by a decrease of the green spectral component or an increase of non-photosynthetic vegetation. It supports degradation analysis caused by logging activities or fires. The DETER-B system of the National Institute for Space Research Brazil (INPE) is one of few national operational systems to detect forest degradation using SMA. It uses data from MODIS, CBERS and IRS (it’s former version DEGRAD used Landsat and CBERS data and ran until 2016).
- The keyword “change” (of spectral fractions etc.) indicates that data with different time stamps may be useful for analysing degradation. The idea behind is that each pixel tells its own story expressed by its spectral reflectance over time. Change detection can capture subtle alterations in forest cover and condition and tends to be more reliable when the signal is observed over a longer time period. Seasonality is a challenge that time series approaches need to address: the spectral reflectance of a pixel may naturally change throughout time, e.g. a growing season, without being affected by a disturbance.
- One example for a time series approach is the LandTrendr algorithm, originally developed for a multi-band time series of Landsat imagery. It observes spectral changes of a pixel over a longer period, ideally for multiple years, and breaks its spectral bands (also indices can be used) into linear segments. The resulting spectral trajectories over time make changes in the course of time (seasonality) and the variability of change evident. – When disturbances occur, a pixel’s value will be presented by a short steeply sloped line segment.
- Visual interpretation as a method for capturing forest degradation concentrates on areas of high disturbance intensity. The quality of results depends on the spatial resolution of the input data and can become very precise when analysinv VHR imagery. However, it suffers from the limitations of time, labour and user bias and becomes challenging when the degradation intensity is low.
- Beyond the spectral bands of sensors, indices can be beneficial for mapping degradation caused by fires, defoliation and mortality events (induced by insects, diseases, climate damage, etc.). Examples are the Normalized Burn Ratio (NBR) from Landsat, the Normalized Difference Vegetation Index (NDVI), woodiness indices and others
- The data come from following satellites (not exclusively): Landsat, Sentinel-2, CBERS, IRS, RapidEye, MODIS, SPOT, Pléiades, Quickbird/WorldView/GeoEye
SAR DATA
- SAR data complement optical measurements allowing for observations in cloudy situations, which is highly relevant in tropical areas, where forest degradation plays an important role
- SAR sensors are capable of measuring complete or partial removal of tree cover due to timber extraction (selective logging), clearings, roads and log decks. The degradation can be extracted in two ways: first radar intensity images reveal the change by the occurrence of new shadow areas (change in radar intensity/color), second the backscattered signal shows different characteristics owing to a modified forest canopy: a large canopy present in time1 will result in a different backscatter in the same location if it is removed in time2
- The usage of radar data requires to work with a time series to detect the degradation as a change in backscatter or image composition
- The detectability increases with tree size – the removal of a large tree with a big canopy through selective logging is better detectable than the removal of a small tree irrespective of sensor resolution
- The implementation of a spatio-temporal filter to reduce speckle and precipitation effects decreases detection errors
- Interferometry enables to generate canopy heights. The combination of digital elevation models exhibiting terrain and canopy height facilitates the detection of changes in forest structure/height and to finally estimate the above-ground-biomass (AGB)
- The L-band SAR backscatter (~23cm wave length) has a direct response to large timer structures (trunks). It allows for the identification of deforestation, forest change and forest regeneration
- P-band radars (~100 cm wave length) have the capability to create a vision of the surface beneath the forest canopy. They permit the generation of a digital terrain model and are currently only carried on airplanes. The biomass mission of ESA will launch the first space-borne P-band radar satellite in 2023
- The data come from following satellites: TerraSAR-X/TanDEM-X, AILOS Palsar, Sentinel-1, JERS, COSMO-SkyMed
LiDAR DATA
- LiDAR data draw a 3-dimensional image of the distribution of vegetation and allow to detect changes in tree height and volume. LiDAR captures roads and surface structures that are beneath the forest canopy. Its estimates of tree heights are of high accuracy
- GEDI: The Global Ecosystem Dynamics Investigation is a self-contained laser altimeter installed at the International Space Station (ISS) in 2018. It makes precise measurements of the forest canopy height, canopy vertical structure and the surface elevation beneath. Thus it facilitates the characterization of carbon and water cycle processes, habitat degradations, glacier monitoring and the generation of digital elevation models. GEDI is an initiative of the University of Maryland in collaboration with NASA Goddard Space Flight Center
Summary
Several methods have been developed and tested to capture areas of forest disturbance. The difficulty is the choice for an adequate method since degradation and forest type influence the signal backscatter in satellite imagery. The combination of methods and especially sensor types improves results. The capacity of detecting forest degradation relates to the intensity of disturbance – greater intensity is easier to detect. Also the characteristics of the data such as the spatial and temporal resolution of the satellite images influence the analysis of forest disturbances: higher spatial and temporal resolution images generally allow the detection of smaller scale disturbance. This usually implies limited study area and higher cost.
Initiatives related to forest degradation
- Global Forest Watch from the World Resource Institute:
- Atlas of Forest Landscape Restoration Opportunities
- Global Forest Watch Map (deforestation and forest degradation)
- Terrabrasillis from INPE has a Deforestation Map, Degradation Map (DETER-B project, described above) and Vegetation Map from Amazonia and the cerrado landscapes. The methodology of DETER is explained here.
- The EOMonDis project (Earth Observation Services for Monitoring Dynamic Forest Disturbances) has a forest disturbance and degradation product
- The EO4SD forest management initiative from ESA has a Tree COver Density and Tree Cover Change product
- The open-source resources for Forest Measurement, Reporting and Verification (MRV) is a knowledge platform that delivers resources to support countries and other users to operationalize their forest MRV processes. It has a section about methodologies related to forest degradation mapping (CODED).
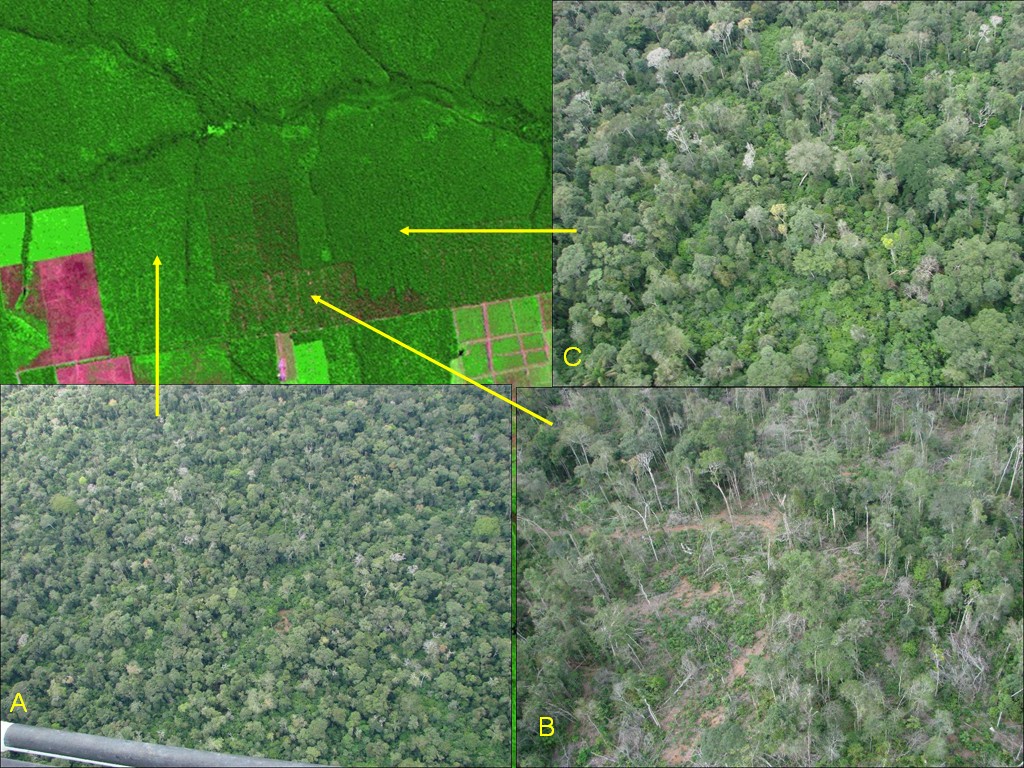
The figure presents different stages of forest degradation due to selective logging in the Amazon forest and shows them on a satellite image: A exhibits an area of moderate degradation due to logging including areas of regeneration after past logging events. B shows an area of high degradation with numerous expoosed bare soil patches. C presents an area of low disturbance (Source: INPE)
Sources

#Environment


Next article
Climate change mapping, disaster management, urban planning, land use, and many more are the applications where space data, if appropriately exploited, can play an important part in increasing the applicability of geospatial technologies. The major expansion and development of geospatial technologies brings quite an interesting correlation between the areas where this expansion is predicted, e.g. construction, engineering, ecology, and precision agriculture, and the use of space data. As such, it is essential for potential entrepreneurs of this industry to learn how to navigate the business world through space.
The EUSPA Space Academy, a portal open to aspiring entrepreneurs and start-ups in all kinds of fields, offers a unique chance to explore the potential of space data and learn how to structure, design, and launch a successful business. The learning platform proposes an interactive and easy-to-use interface with options for live and offline sessions.


The space industry has never been more accessible than now. More and more entrepreneurs are taking this opportunity to combine their business with space data to eventually access a larger market and provide added value and the most efficient solutions to their customers. The EUSPA Space Academy provides all support for geospatial experts looking for a programme where space meets business.
All communications, press, or content enquiries can be directed to: hello@euspaspaceacademy.eu