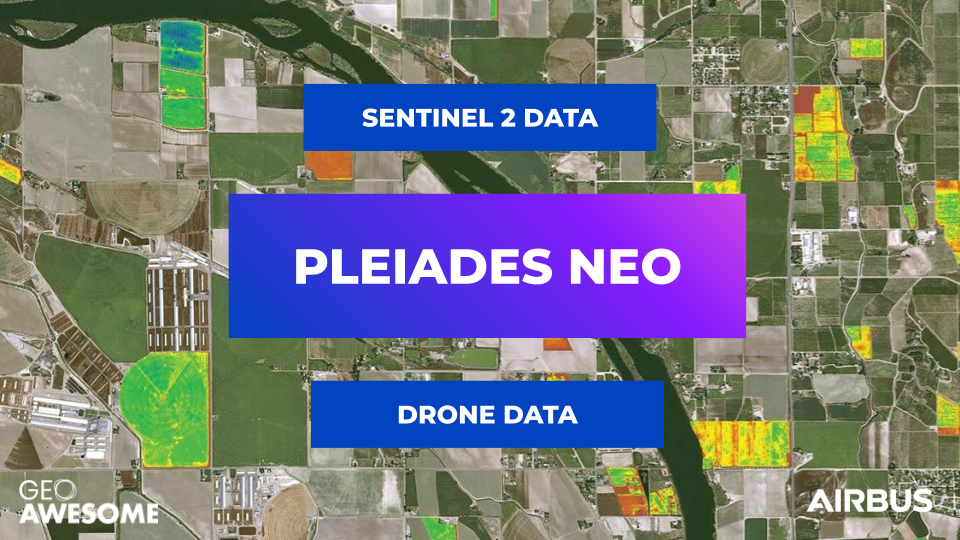
The new 30cm Pléiades Neo constellation offers, the precision agriculture sector, data that bridges the gap between drones and open-source satellite imagery

Precision agriculture has been one of the big buzzwords in the world of agri-tech. It is also one of the most important applications for imagery data from both satellites and drones, which are a critical component of the precision agriculture process. Multispectral imagery data can be combined with other data (such as crop type, terrain models, soil type etc.), to calculate so-called ‘prescription maps’. Farmers use these maps to analyse the situation on the ground to make informed land management decisions. To trigger specific actions such as variable-rate spraying, the maps can be uploaded to automated farming equipment.
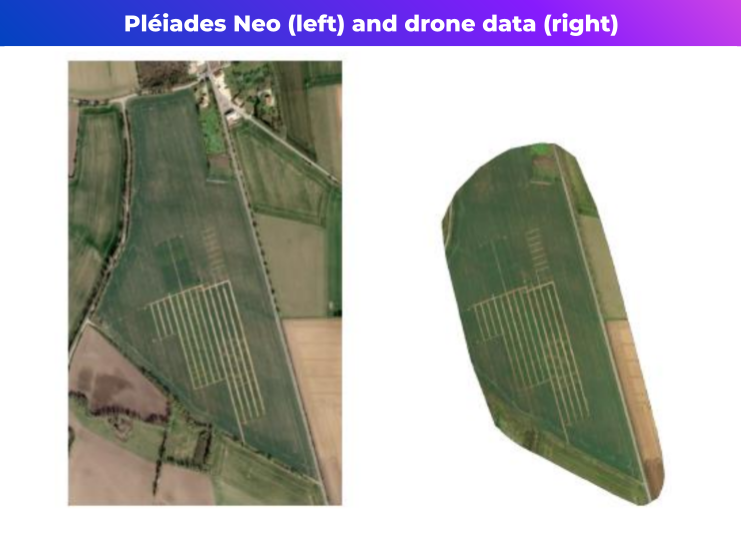
Typically, prescription maps are based on satellite data, which can be complemented with drone or airborne data for individual fields where cloud coverage makes satellite data unusable—particularly relevant at the peak of the growing season, when the time window to make the right decision may be as short as 1–2 weeks.
The new Pléiades Neo constellation from Airbus is filling the gap between satellite data from open-source constellations such as Sentinel 2 and drone data.
Temporal and spatial resolution
Pléiades Neo offers 30cm native resolution and after launching the complete constellation later this year, it will be able to revisit any location around the world several times a day.
Large crops, (cereals, rapeseed, corn etc.), are mostly monitored by satellites such as Sentinel, which offers a much lower resolution compared to Pléiades Neo, but a larger swath. This covers more fields over a given location in a single pass.
Pléiades Neo, despite offering a smaller swath compared to Sentinel, with four satellites in orbit, Pléiades Neo satellites can cover large areas within a single day and at much higher resolution. The level of detail obtained may be a little excessive for current precision agriculture equipment, but what it does do is provide very valuable information when it comes to monitoring crop growth to prevent potential diseases – 30cm resolution imagery enables you to see a much clearer picture, meaning early detection is possible.
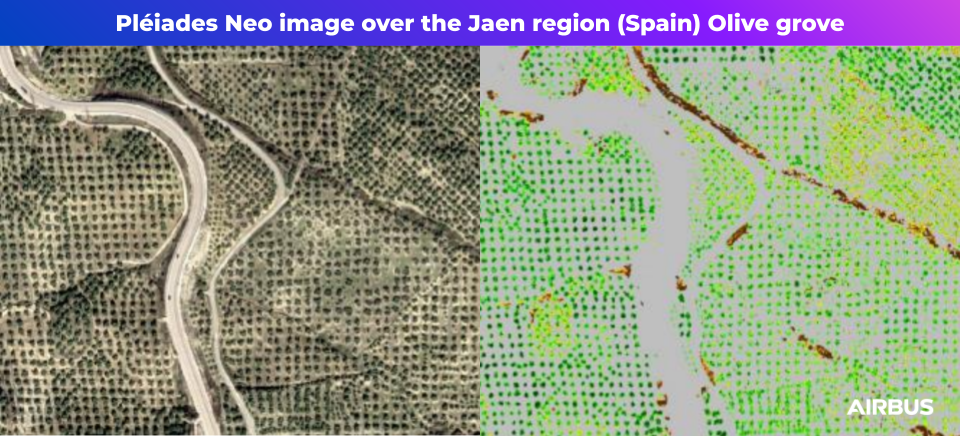
This high-resolution data also plays an important role for specific use cases, such as high-value crops like vineyards and olive orchards for example. Across Europe, such plantations are now facing increasing challenges of drought, so farmers need to use water resources in a far more efficient way. 30cm resolution is important in specifically identifying the condition of each separate tree in order to make an informed decision about how to treat it.
Another use case is in crop trials performed by technical institutes in the context of research and development activities. Such institutes have objectives to continuously improve systems of crop management, to develop advanced decision-making criteria and to benchmark new cultivation methods. Every year, they perform numerous tests in frameworks of micro-plots planted in open fields.
One more instance where higher resolution is useful is in locations where fields are narrower than 10m, which there are many of, particularly in central Europe. When the field is 5-7m wide (and, as an example, 2km long) the error rate for a 10m pixel size is significant.
Spectral resolution
In precision agriculture, spatial resolution is very often less important than spectral resolution. Spectral bands allow us to see and measure things not visible to the human eye. The most popular measure coming out of various spectral bands is ‘normalised difference vegetation index’ (NDVI), which is based on red, plus the infrared bands – easy to measure for the majority of satellite or drone multispectral sensors. But in practice, NDVI is just scratching the surface of the possibilities that come with adding additional spectral bands, such as the new Pléiades Neo ‘Red Edge’ band, or visible, near-infrared and shortwave infrared in Sentinel 2, among others.
NDVI will not work well with developed crops. To create a full model of the canopy reflectance, you need to use different indices, such as Leaf Area Index, ‘normalised difference red-edge index’ (NDRI), or ‘modified soil-adjusted vegetation index’ (MSAVI), depending on crop type, growth stage and the purpose of the analysis. Using the Red-Edge band from Pléiades Neo satellites, allows better chlorophyll content measurement and as a therefore a more precise estimation of the Leaf Area index values on crops, at plain development. Indeed, the Red-Edge band helps to pinpoint subtle stress in crops in advance compared to traditional indices, as it corresponds to the region of electromagnetic spectrum where the reflectance of green vegetation changes rapidly.
The role of spectral bands goes beyond vegetation indices. Spectral bands are of no interest to farmers of course, but they do care about the quality of agronomic information derived from that data. Satellite sensors need to pass through the atmosphere and then adjusted for the atmospheric distortions. Therefore having a set of bands helps to characterise vegetation as well as enabling the best and most accurate data correction. This is why the ‘Deep Blue’ band is very important in helping Pléiades Neo obtain the most accurate data: it significantly aids the atmospheric corrections.
Satellite vs. drone data
In fact, the accuracy and reliability of the data related to radiometric corrections is the biggest challenge for drone sensors. Satellite data typically uses a large number of bands, with a very stable sensor and radiometry procedure for regular calibration, providing trusted results. By contrast, the calibration of a multispectral drone sensor is not an easy task.
To obtain reliable drone data, the sensor calibration has to be in line with the specific weather and light conditions (e.g., cloud coverage and time of day). If calibration is made for clear skies, a single cloud passing by will influence the result. There are techniques to manage this, but it adds a certain level of uncertainty and has a significant impact on the prescription map produced from of this drone data.
Conclusions
Pléiades Neo offers a unique combination of both spectral bands and high spatial resolution, smartly completing lower resolution satellite constellations, such as Sentinel, ensuring precision and timeliness of the information. Moreover, it can substitute drones or aerial data, especially over larger areas, as it is much more economically viable. With its very high spatial resolution, excellent spectral parameters and more frequent revisits increasing the chances of cloud-free data, it is an excellent asset.
Did you like the article? Read more and subscribe to our monthly newsletter!

#Data source

Next article

Collaboration in Earth Observation – NASA and ESA

Editor’s note: This article was written as part of EO Hub – a journalistic collaboration between UP42 and Geoawesomeness. Created for policymakers, decision makers, geospatial experts and enthusiasts alike, EO Hub is a key resource for anyone trying to understand how Earth observation is transforming our world. Read more about EO Hub here.
At some point in time, most of us in the geospatial industry have used Earth Observation technology and remote imagery to track changes on the Earth’s surface. Common applications include environmental monitoring, meteorology, and cartography. Some of you may have used it in the past and been fascinated by it but do not actively use it now. Others actively use Earth Observation in your day-to-day work or research.
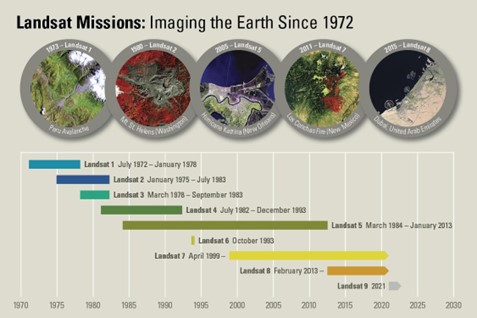
If you are a part of the industry, you must have come across two Earth Observation programs: Landsat and Sentinel. The Landsat program, operated by the National Aeronautics and Space Administration (NASA), has been continuously imaging the surface of our planet since 1972. What turned the industry upside down was a bold move to open up the entire archive of the program to the general public in 2008. Back then, it felt incredible that all this data was not kept under lock and key anymore. It was one of the major triggers that influenced the beginning of the new space economy.
If you’d like to hear about the origins of the 2008 policy change by someone who was instrumental in securing it’s execution, check out this podcast by Minds Behind Maps: Barbara Ryan – How Landsat Became Free & Open – MBM #21.
It also paved the way for the European Space Agency (ESA), which launched its Sentinel program back in 2014. The most widely known and used open-source dataset is procured by the Sentinel-2 satellite constellation, which comprises two polar-orbiting satellites with 10m spatial resolution. However, these are only two satellites in a family of many others.
NASA, ESA, Landsat, Sentinel, and the Power of Collaboration
Both Landsat and Sentinel datasets are similar in nature, but have enough differences to complement each other given the right circumstances. They are also both available to the geospatial community via various platforms and marketplaces such as UP42 among others.
Interestingly, the fact that these two programs complement each other is by design rather than by accident. In fact, NASA and ESA are closely collaborating on a number of efforts and initiatives that enhance Earth Observation and benefit humanity. These efforts are a great example of how we are better when we work together and share information than when we isolate and keep the power of data to ourselves.
Collaborative Effort #1 – Harmonized Landsat Sentinel-2 Dataset
Landsat-8 provides new data every 7 days and Sentinel-2 provides new data every 5 days. When harmonized together, the overlap between the datasets allows new data every 2-3 days at 30m resolution. Not only that, but the result of the harmonized dataset is also a more complete product.
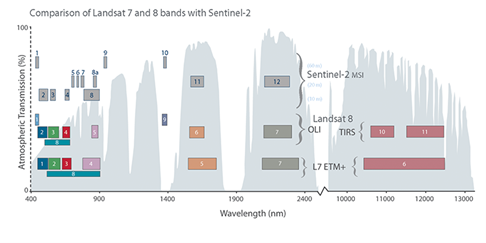
For example, each dataset consists of bands of the radiometric spectrum that capture a range of wavelengths. There is a significant overlap in the two datasets. When harmonized together, the overlap allows for better atmospheric correction and presents more accurate data.
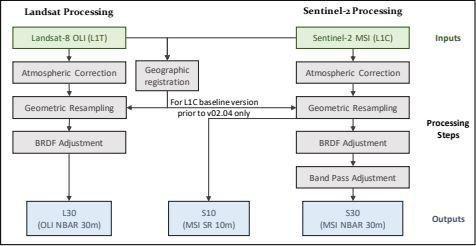
For the purposes of the Harmonized Landsat Sentinel-2 Dataset, the products are gridded to the same resolution and Military Grid Reference System (MGRS) tiling which allows for stackable time series analysis. For a more academic overview of the dataset, see this link.
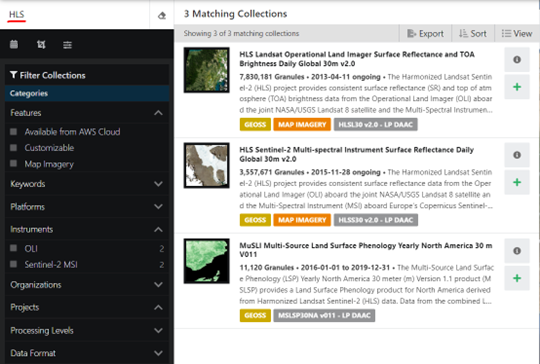
This collaborative effort provides updated data on a more frequent basis, the combined product is more accurate, and it is freely available to all via NASA’a EarthData website. Government agencies, private entities, academia, and the general public all benefit from this.
This dataset is ongoing. With the launch of Landsat 9 on September 27, 2021 and the launch of Sentinel-6 on November 21, 2021, more of these types of opportunities present themselves. With enough visibility and support from the community, we can communicate how valuable this is to us.
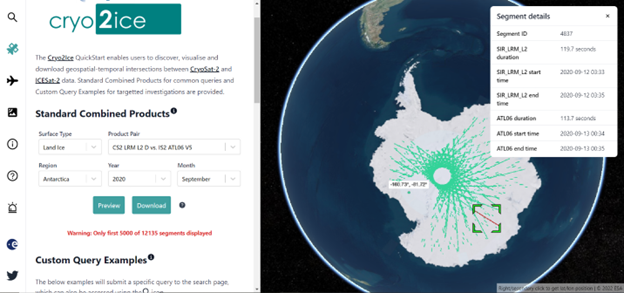
Collaborative Effort #2 – Cryo2Ice Campaign
Although a shorter mission, the CryoSat-2/IceSat-2 Resonance Campaign, dubbed #CRYO2ICE, is another impactful representation of the collaborative effort between ESA and NASA. CRY2ICE was a 2-week mission that occurred between 16-31 July 2020. The goal was to temporarily synchronize the orbits of NASA’s ICESat-2 and ESA’s CryoSat-2 satellites to gather radar and LiDAR measurements of the same ice at the same time. The CryoSat-2 and ICESat-2 satellites passed over coincident polar areas at approximately the same time over 19 orbits that occurred roughly every 31 hours.
This provided scientists with a more accurate measurement of sea ice thickness measurements and ice-sheet elevation time series than had been done before. Tommaso Parrinell, Cryosat Mission Manager, commented: “The scientific benefits such a small orbit change for CryoSat will bring are impressive. By using the combined data from CryoSat-2’s radar and ICESat-2’s laser instruments, for the first time, we will be able to reduce inaccuracies in sea ice thickness and land ice measurements. It will enable us to map snow at the poles and could help us, among other aspects, to measure sea ice in summer and improve climate models.”
Fascinating on a technical level, the synchronization was accomplished by increasing the ESA CryoSat-2’s semi-major axis by 887 meters through a series of 14 maneuvers.
This effort required collaboration between several entities. I’d like to list them below to demonstrate how many people are involved in efforts like this:
-
- CryoSat’s Mission Management based in ESA’s Centre for Earth Observation (ESRIN) in Italy
- CroSat’s Ground Operations team based in ESA’s Center for Earth Observation (ESRIN) in Italy
- The Flight Control Team (FCT) located at ESA’s European Space Operations Center (ESOC) in Germany
- The Flight Dynamics Team (FD) located at ESA’s European Space Operations Center (ESOC) in Germany
- The Space Debris Office (SDO) located at ESA’s European Space Operations Center (ESOC) in Germany
- NASA
Collaborative Effort #3 – Sentinel-6 effort
On November 21, 2020, the Sentinel-6 Michael Freilich satellite launched from Vandenburg Air Force Base in California. This effort is part of a strategic partnership between NASA and ESA to observe earth and its changing environment. The primary goal is to measure the height of the ocean to better understand how Earth’s climate is changing. A secondary goal will be to measure the temperature and humidity of the troposphere, the atmospheric layer in which we live.
Five years after the launch of the Sentinel-6 Michael Freilich satellite, an identical satellite called the Jason CS is set to launch and provide observations up to 2030.
An effort such as this only comes to fruition with the combined forces of several entities. NASA and ESA are not the only ones involved. Other organizations that are actively involved or supporting the mission are the National Oceanic and Atmospheric Administration (NOAA), the European Organization for the Exploitation of Meteorological Satellites (Eumetsat), the European Commission, and France’s Space Agency, the Centre National d’Etudes Spatiales.
The Sentinel-6 and subsequent launch of the Jason CS satellites are set to provide measurements until 2030. Some notable technological improvements provided by the Sentinel-6 satellite are the inclusion of synthetic aperture radar into the altimetry reference mission time series and an advanced microwave radiometer provided by NASA. These will yield high-resolution along-track measurements and more accurate sea-surface height measurements, respectively.
Visions of a Unified Future in Earth Observation
The collaboration of NASA and ESA represents a great moment in history that will define how we as humans approach each other and the future moving forward. Not only can launches happen more frequently and successfully, but this also demonstrates the world coming together as a more unified whole. The cooperation between such high-profile organizations incorporates a new level of transparency to tackle the difficult issues of our day such as climate change.
A bit of healthy competition is good, but collaboration can be just as powerful, if not more. When different minds come together, remarkable things can happen. The ability to get a fresh dataset every 2-3 days with the Harmonized Landsat Sentinel-2 data and more accurately measure sea ice thickness with CRY2OICE are notable examples of these impacts.
Today, we have many stories of space technology making a positive impact on the lives of all of us. What are your thoughts on the collaborative efforts with Earth Observation technology? NASA and ESA are just a highlight, but there are many more organizations and collaborative space programs out there. Can reaching the stars bring us closer together? Please share your comments below.
Did you like the article? Read more and subscribe to our monthly newsletter!