How satellite data is used to monitor flooding from space

Editor’s note: This article was written as part of EO Hub – a journalistic collaboration between UP42 and Geoawesomeness. Created for policymakers, decision-makers, geospatial experts and enthusiasts alike, EO Hub is a key resource for anyone trying to understand how Earth observation is transforming our world. Read more about EO Hub here.
2021 was a year of many extreme natural hazard events. The Emergency Events Database (EM-DAT) recorded as many as 432, far exceeding the annual average of 357 catastrophic events recorded between 2001 and 2020. Floods dominated these events, with 223 incidents. This compares with an annual average of 163 between 2001 and 2020. During the monsoon season, India experienced a series of deadly floods that claimed 1,282 lives. July brought extreme flooding on many continents. In Nuristan, Afghanistan, floods caused 260 deaths, and in Henan, China, floods killed 352 people and affected 14.5 million. The cost of flood repairs amounted to $16.5 billion. Central Europe also suffered, experiencing a number of floods and landslides. Flooding Western Germany caused over $40 billion in damages, making it the country’s second-most expensive natural disaster, after the 1962 Hamburg flood.
The percentage of the population exposed to flooding has increased globally by 24% since the turn of the century, according to a study published in Nature. This is 10 times more than scientists previously estimated. The situation is due to both increased flooding and population migration, meaning there has been a population increase in flood-prone regions by as many as 86 million people. In addition, extreme hydrological events are predicted to become more numerous and damaging due to a warming climate. Climate change could cause river floods to become larger or more frequent in some places, and become smaller and less frequent in others. As warmer temperatures cause more water to evaporate from the land and oceans, changes in the amount and frequency of heavy precipitation can affect the size and frequency of river floods. Changes in stream flow, the timing of snow melt, and the amount of snowpack that accumulates in winter can also affect flood patterns.
The increasing frequency and magnitude of floods is a huge threat to the normal living conditions of many people. Large floods can destroy farmers’ crops, damage homes, roads and other infrastructure, and injure and displace people. Regular flooding helps maintain the nutrient balance of soils in floodplains, but larger or more frequent floods can disrupt ecosystems by degrading water quality, displacing aquatic life and increasing soil erosion. By inundating water treatment systems with sediment and pollutants, and promoting the growth of harmful microorganisms, floods can directly affect the water supplies that communities depend on.
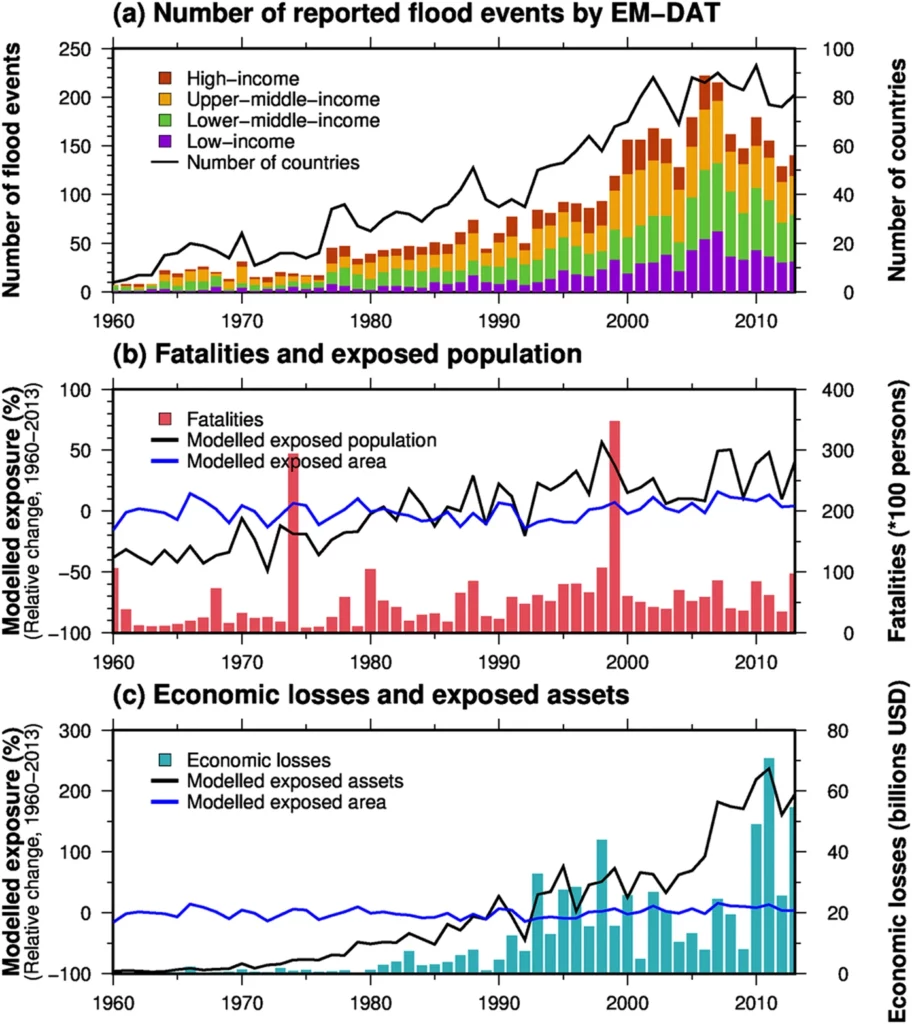
Global-scale river flood vulnerability in the last 50 years. Source: https://www.nature.com/articles/srep36021
The role of satellite data in flooding monitoring
Satellite data have proven in recent years to be a key aid in reducing the impact of flooding. These are extremely valuable, especially in developing countries that lack good surveillance systems. In addition, these countries are more vulnerable to flooding due to the lack of adequate infrastructure. However, due to the unpredictability of extreme weather events, flood monitoring, and therefore decision-making, is much more difficult. There are two ways that satellite technology supports these activities.
Preventive measures
Based on satellite imagery, it is possible to create predictive models to identify parts of cities that are prone to severe damage. This makes it possible to plan effective evacuation and thus reduce the impact of flooding, especially near low-lying coastal cities, lower parts of rivers, and areas around dams. Hazard levels can be used to create prioritized strategies and risk assessments, as well as predict economic losses. Additionally, in the long term, drainage systems can be established. This will ensure that the most flood-prone areas are prioritized, and will enable flood risk mitigation.
Damage assessment
Rapid assessment of damage after a flood event is crucial for disaster management to coordinate first responders and other response activities, and to enable rapid rebuilding of damaged infrastructure. The use of EO data makes it much easier to determine the extent of flooding over large areas, and does not require field work, which would be very time- and labor-intensive. In addition, the areas most affected by flooding are often inaccessible, and the only way to obtain information about them is through aerial or satellite imagery. The use of satellite data also makes it possible to accurately analyze the phenomenon over time, not only locally, but also over large areas.
Accurate flood mapping requires both multi-year and current high-resolution data to assess the flood risk of specific areas. Currently, the Earth can be monitored many times each day via satellite data, and therefore provides the best support in the fight against the elements. Platforms such as UP42 have all the data needed to assess risks and counter extreme events. The information is also easily accessible.
Data overview
Optical data
Earth-observing satellites are able to capture images at different spatial scales and during different orbital periods, making each satellite sensor and dataset unique. This enables weather phenomena to be captured from multiple perspectives. Optical satellite data is the fastest source of information and provides an easy-to-interpret and measure picture of a flood event. This provides an unprecedented means of situational awareness, as flooding events can cover huge areas.
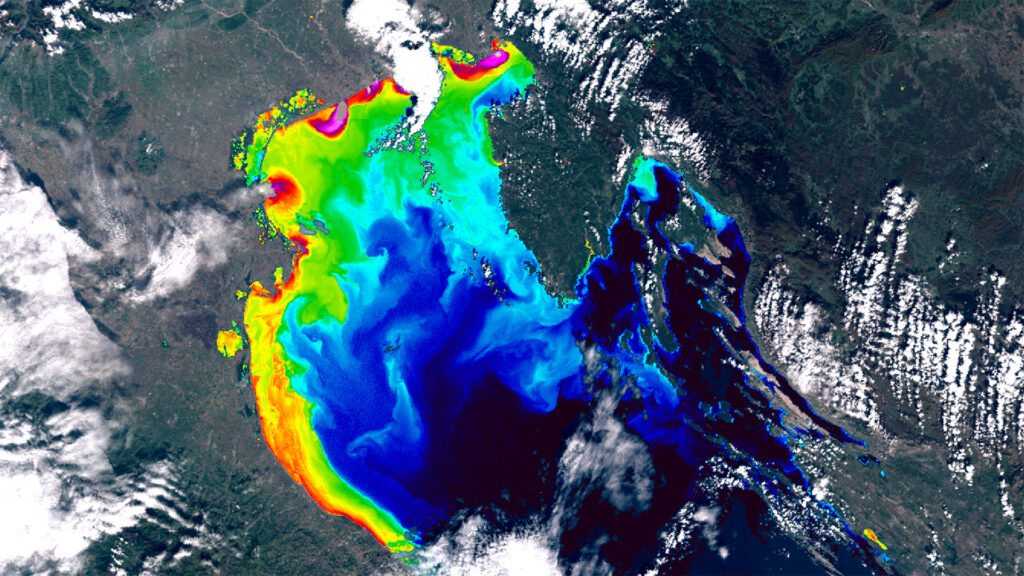
The following satellite image taken by EOMAP during water quality monitoring shows the extent of flooding in the Adriatic Sea in 2018. Copernicus Sentinel-2 and Sentinel-3 satellite data were used for the monitoring. In addition, baseline satellite images (left image) were used to study water turbidity levels using the EO EOMAP processing system (right image).
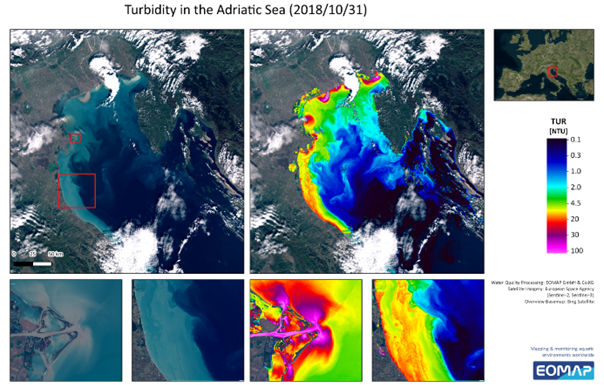
Assessment of water pollution based on optical data. Source: EOMAP
Hyperspectral and multispectral data
Optical sensors capture visible blue, green and red wavelengths, as well as emissivity data through infrared wavelengths. It is the latter two wavelengths that are commonly used in surface monitoring studies, including mapping vegetation phenology, surface water, snow melt and drought monitoring. Infrared wavelengths are crucial for water studies due to their high absorption over water, and relative ease of identification next to dry land. Hyperspectral and multispectral data enable the use of useful indicators in flood interpretation. The Normalized Difference Water Index (NDWI) makes it easier to distinguish between flooded and dry areas. The method combines infrared and visible light observation. The photo below shows NASA Sea Level Change’s use of the index.
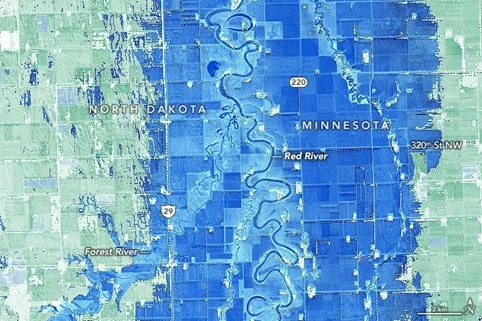
Use of NDWI index. Source: NASA Sea Level Change
The team was established in 2014 to improve understanding of relative regional sea level changes at different time scales. Data analysis and climate tools are freely available on NASA’s website (https://sealevel.nasa.gov/) to visualize data related to global water level changes due to ongoing climate change. With these tools, you can better understand the situation and the processes that contribute to it.
SAR
Radar imaging is an effective technique for obtaining real-time early warning information about emergency situations. Due to the frequent co-occurrence of floods, along with cloud cover, this type of data is much more effective than optical data for hour-by-hour monitoring. “Finding potential floods is a huge problem,” said Charles Blanchet, Vice President of Solutions at ICEYE. To solve this problem, ICEYE creates flood alert data and makes it available to clients, along with flood hazard data. This unparalleled dataset allows insurers to mobilize resources quickly. To achieve this, the company uses data from its constellation of Synthetic Aperture Radar (SAR) satellites to enable detailed observations of flood events around the world. Based on radar data, as well as data provided by other companies, such as weather data, digital elevation data, building footprints, and analytical technologies such as machine learning, ICEYE generates flood hazard data within 24 hours of a flood peak.
Algorithms
There are a growing number of advanced algorithms on the market to automatically detect flood events. Forecasting techniques using AI and machine learning algorithms are effective due to their ability to use data from various sources, and to classify weather events as flood or non-flood. In addition, having access to enormous amounts of high-quality data enables the algorithms to have the potential capability to predict floods before they occur. The advantages of such a solution are many, but among the most important are:
- much faster generation of flood forecasts and warnings than the traditional method;
- it uses actual observed data, making no assumptions;
- the method is self-improving with data and time.
The algorithms can be easily accessed via platforms such as UP42, which already use workflows for flood monitoring.
An example of this algorithm is Flood Submergence Estimation, which uses Sentinel 1 GRD to isolate submergence. It relies on the fact that the block takes two Sentinel-1 GRD(SAR) images (pre-event and post-event) of AOI, and maps the submerged areas. The output of the block is a binary image, where white pixels indicate flooded areas.
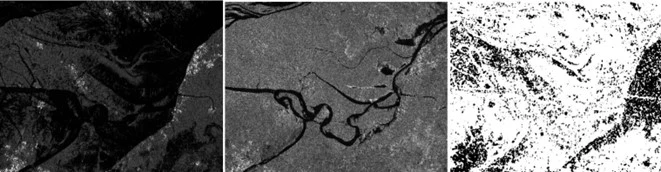
Flood submergence estimation. Source: https://up42.com/marketplace/blocks/processing/flood-mapping
Conclusions
Satellite data is a key aid in predicting floods, and enables fast damage assessment and monitoring to detect changes to help understand emerging issues. “Satellite remote sensing is an efficient and cost-effective tool to assess a variety of physical and biological parameters in aquatic ecosystems over small-scaled and large areas and plays a very strategic role in maritime surveillance. Its ability to provide a detailed overview of the area is important in conducting on-going assessments and monitoring the extent of damage,” said Hendrik Bernert, EO Data Analyst at EOMAP.
Did you like the article? Read more and subscribe to our monthly newsletter!

#Data source
Next article
Detecting Bilge Dumping pollution at Sea with Satellite Data

Editor’s note: This article was written as part of EO Hub – a journalistic collaboration between UP42 and Geoawesomeness. Created for policymakers, decision makers, geospatial experts and enthusiasts alike, EO Hub is a key resource for anyone trying to understand how Earth observation is transforming our world. Read more about EO Hub here.
Of the most common crimes that are committed on the open seas (piracy, illegal fishing, oil spills, etc.), there is one that almost no one talks about – bilge dumping. It’s grown steadily in scale and seems to have been hiding in the shadows for many years now. However, that’s all about to change.
“Most people don’t realize that every day in multiple places in the ocean around the world, large commercial ships are getting away with dumping untreated oily bilge waste directly into the sea. But with the technology we have now, we’re changing that.”
This is a quote from John Amos, the founder of SkyTruth – a non-profit organization based in West Virginia. They are tackling the problem of bilge dumping head-on using satellite imagery and machine learning to identify and bring accountability to ships that engage in this practice. It’s a fascinating use of technology and one that can do a lot of good for our oceans.
What Is Bilge Dumping and Why Does It Matter?
To understand bilge dumping we must first look at what bilge water is. A bilge is the lowest part of a ship where dirty water collects. But it’s not exactly water. It’s a nasty concoction of any liquids that leak from the engines and the massive pipe infrastructure in the bottom of these ships. This can include oil, cleaning products, chemicals, and a variety of other things and they all collect in the bilge water itself.
As explained in a video from Deutsche Welle: “Bilge water is so toxic that it has been regulated for more than 50 years. It’s hellish drainage you really don’t want to dump into the ocean.” Yet that’s exactly what so many vessels do – they dump the bilge into the ocean regardless.
Marine regulations stipulate that ships are supposed to collect the bilge water and dispose of it safely at the next harbor, but unfortunately, that’s not what happens in a lot of cases. The sheer scale of this practice is a significant concern because the environmental impact is stark and long-lasting. The oil can suffocate and intoxicate fish and birds, forever harming the marine ecosystems that we should be working to protect. And it’s not only the current generation of animals, but there has also been research to show that bilge water can harm the fertility cycle which then impacts the animals that are yet to be born.
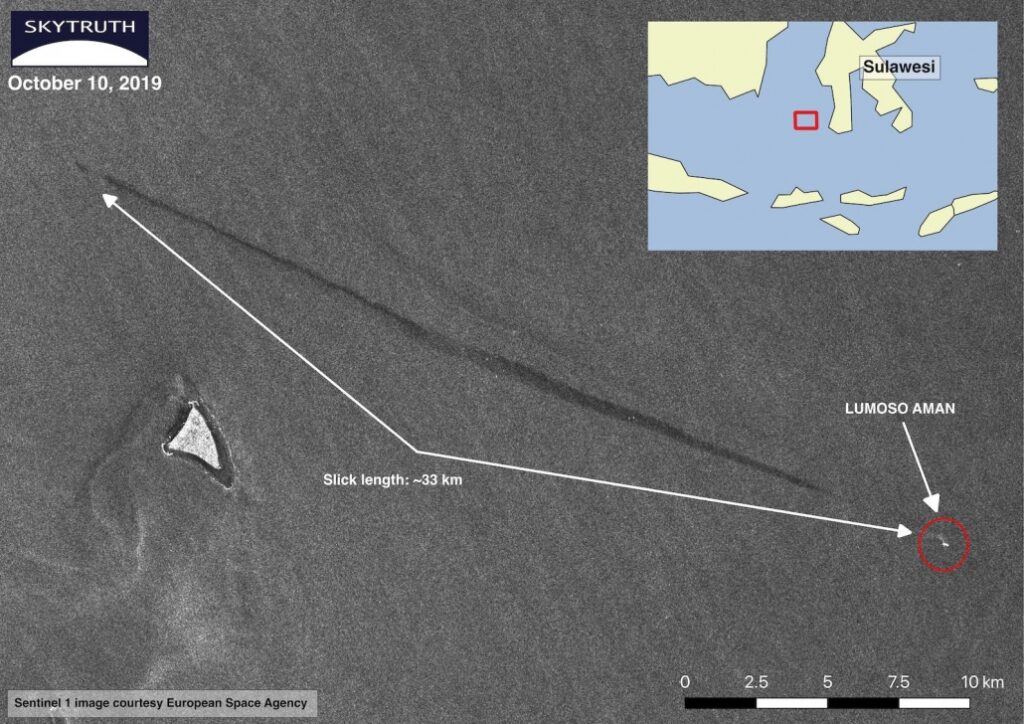
SkyTruth’s research shows that there are hundreds of these bilge dumping events happening every year, and the compounding effects can be disastrous for the long-term health of our oceans. These slicks average around 56km in length and are quite consistent across many of the major shipping lines around the world. This is certainly not an isolated problem and we’re already seeing the downstream environmental effects. The most obvious ones are the mysterious oil that has been showing up on beaches in Brazil, Singapore, Nigeria, and several other countries. But those are just the ones that are staring us in the face – which are likely to be only a small proportion of the damage being inflicted on ocean life. Serious action needs to be taken to shine a light on the problem and bring it into mainstream consciousness so that we can tackle it as a society and bring the perpetrators to justice.
What is the Solution?
Typically, these sorts of crimes are very difficult to get a handle on because it’s near-impossible to monitor the open ocean ecosystem with any level of efficiency or precision. But all that has changed with significant advances in satellite imagery.
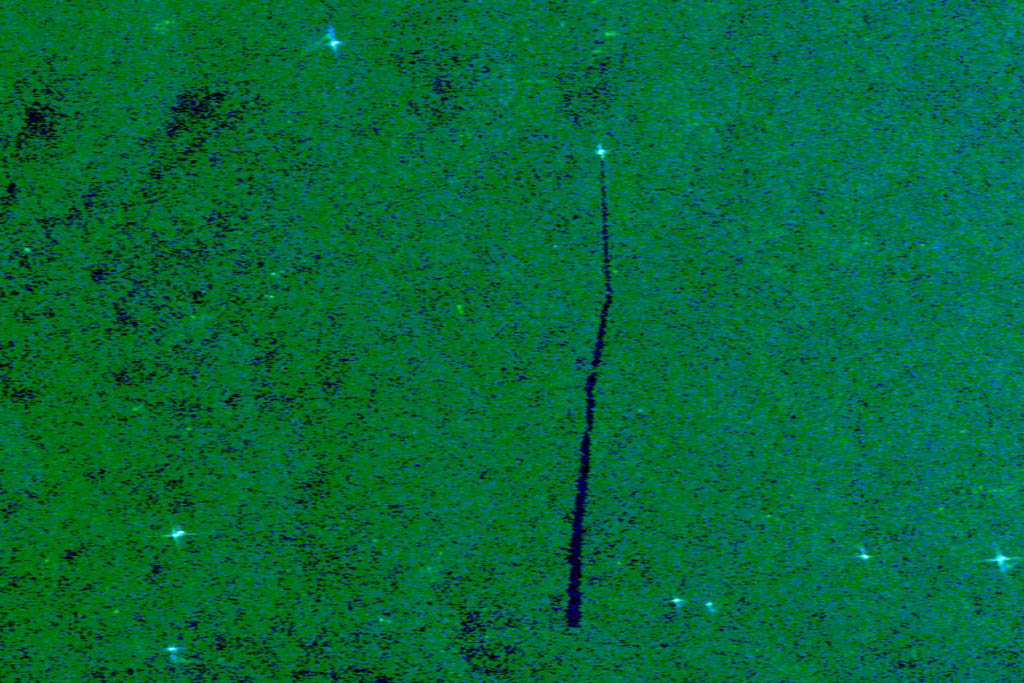
SkyTruth found a fascinating new method that would help them pick up the bilge dumping as it was happening and then match it to the specific vessel that was responsible. They started by analyzing Sentinel-1 radar data to detect the pollution and to measure the thickness of an oil slick and the exact coordinates of where it was. They did this by training a machine learning model to comb through thousands of images and look for instances of an oil slick.
Initially, there were plenty of false positives – things that looked like an oil slick, but were actually just a naturally occurring event – but with time, the algorithm has been improved significantly and is pretty accurate in finding the oil slicks that are not naturally occurring and therefore that are likely to have been caused by bilge dumping. The improvements in accuracy can also be credited to significant improvements in satellite imagery availability and resolution, which gives the machine learning models more pixels to work with.
They now had the slicks in their sights, but that alone was not enough. They had no way of proving which ship did the dumping. That was until Amos and his team discovered a crucial dataset that changed everything – AIS. He explains it best in a recent video:
“We’re using satellite images to detect these oily slicks in the ocean left by vessels, but we’re also using another satellite collected data called AIS – automatic identification system. And these are radio frequency broadcasts that many ships at sea send out frequently to identify who they are, where they’re going, and how fast they are moving. By correlating those signals that we collect from one set of satellites with the oil slicks that we see using another set of satellites – very often we can identify the vessel that is the polluter responsible for that oil slick.”
The AIS data is a regulatory requirement for ships so that collisions are avoided, but this use case allows us to tie exact coordinates and timing to ships – which are then compared to the slicks themselves. The ability to tie together these two disparate data sets is really what turned the entire process into one that had legs and could deliver the insights needed for law enforcement to start to get involved.
This process is at the core of SkyTruth’s Project Cerulean which has already made some important strides towards providing the sort of transparency and accountability that we need to put an end to bilge dumping. It’s an elegant solution that leverages the potential of satellite data and machine learning to shine light on the problem – thus giving us the data that we need to then pursue legal action against the companies who are doing the bilge dumping.
Conclusions
When you recognize what satellite imagery and machine learning can do in tandem for problems like this, it opens up a whole new realm of possibility for the practice of geospatial analysis. We can leverage tools and ideas like this to tackle some of the biggest problems our world faces in an efficient and highly precise way – just like SkyTruth is doing.
None of this would be possible, though without significant advances in data collection and utilization. All the satellite imagery and the AIS data can be sourced from a platform like UP42 which provides a wide array of data products in a scalable and affordable way. Their AIS offering in particular makes this work possible and is going a long way in helping geospatial professionals to do their best work. Users can order, task, and process their data through a single touchpoint, making the entire process that much more effective at scale.
This, combined with the right methodology, gives us a highly valuable set of information that helps law enforcement get to work. The industry needs to get behind efforts like this and push regulators and governments to take action to stop bilge dumping. If we can do that, then we might just find ourselves at an inflection point where we can stop this dangerous and irresponsible practice for good.
Did you like the article? Subscribe to our monthly newsletter: