From a sect of Jews to a world dominating religion with over 2 billion followers, the story of Christianity is fascinating. This animated map gives a geographic look at the past 2,000 years and shows how the religion was spread around the world, first by Jesus’s disciples, then by emperors, kings, and missionaries.
It is also interesting to see how all five of the biggest religions in the world: Hinduism, Buddhism, Christianity, Judaism, and Islam spread across our planet.
The video is a part of a larger Business Insider series. You can find all of these videos here.

#Ideas


Next article

Understanding and choosing the right map projection can be tricky. For GeoGeeks it is painful to see the unconscious overuse of Mercator. If you want to change something, start with yourself. These set of tools will let you master map projections, their characteristics, compare them and select the right one for your project.
1. The scale of Mercator projection distortions
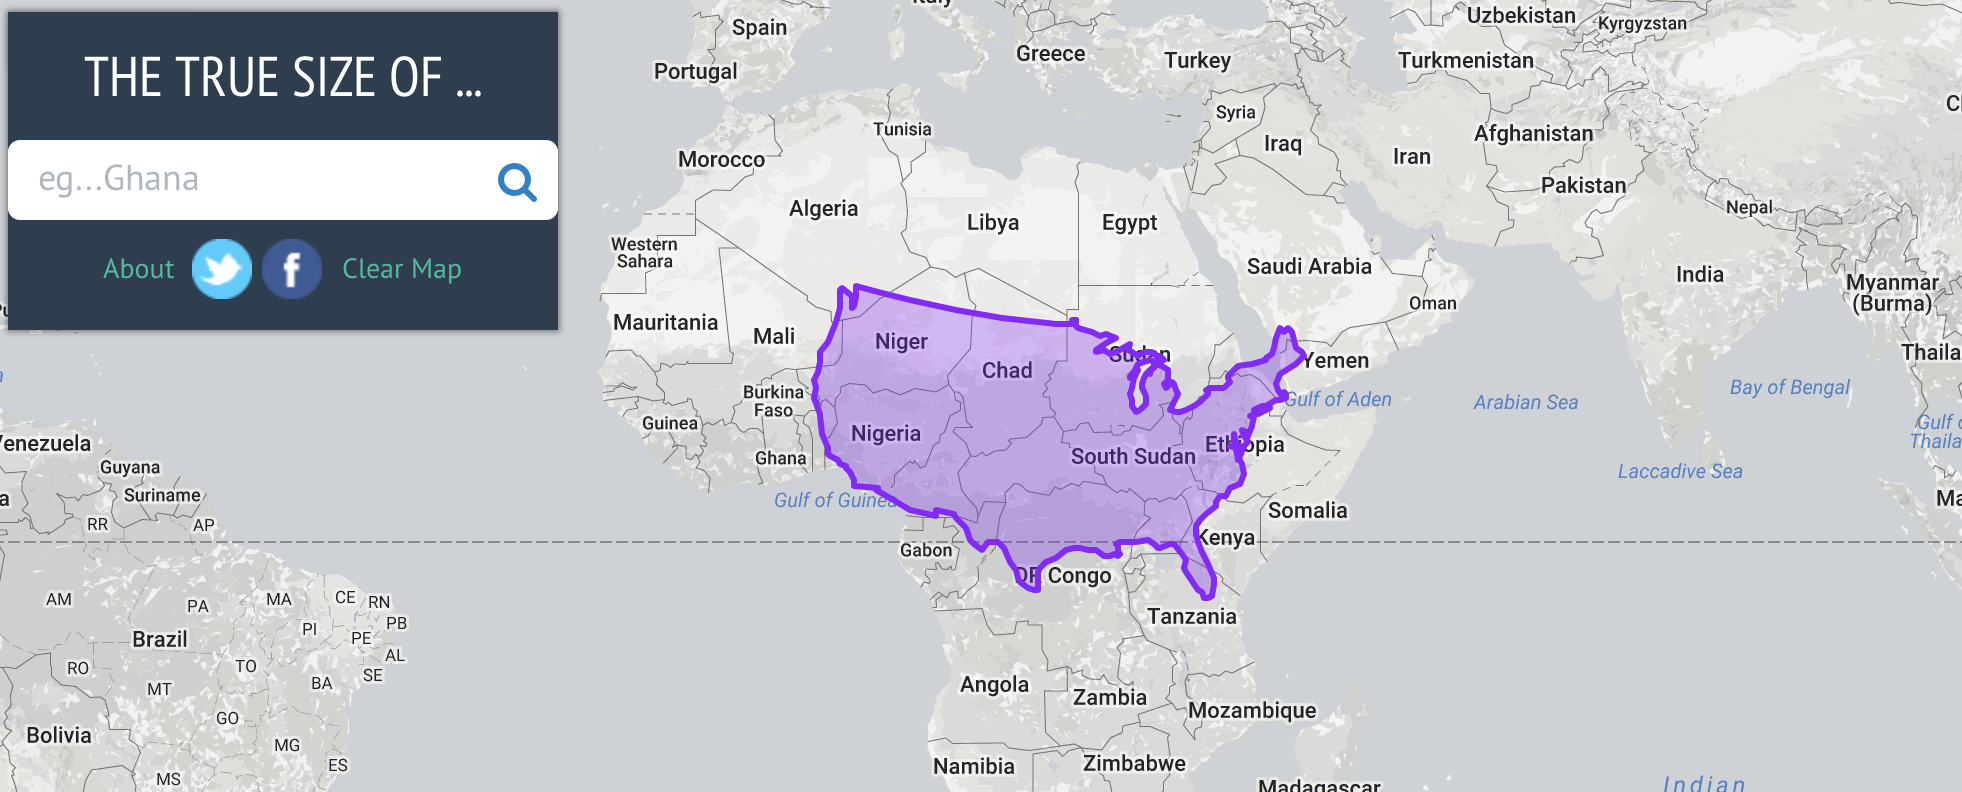
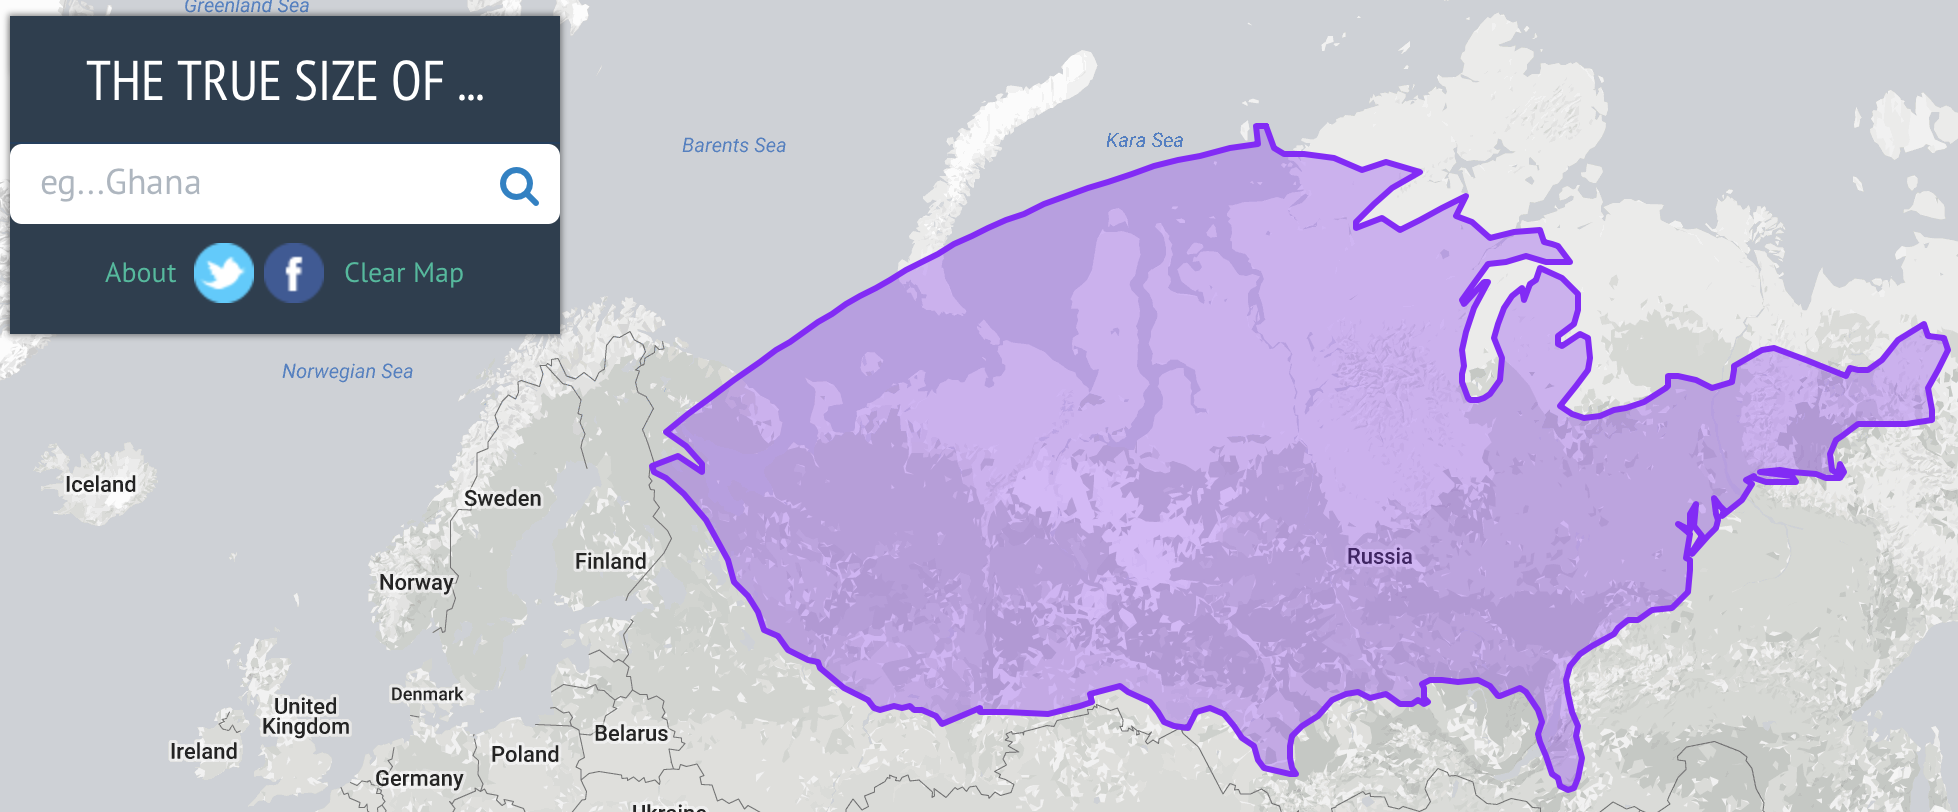
For starters, it’s important to fully get the scale of the problem related to the unconscious use of Mercator projection. This tool called The True Size lets you compare the size of countries by allowing you to move their shapes around a map. In the example below, you can see how the size and shape of the US changes when it’s near the equator and the pole.
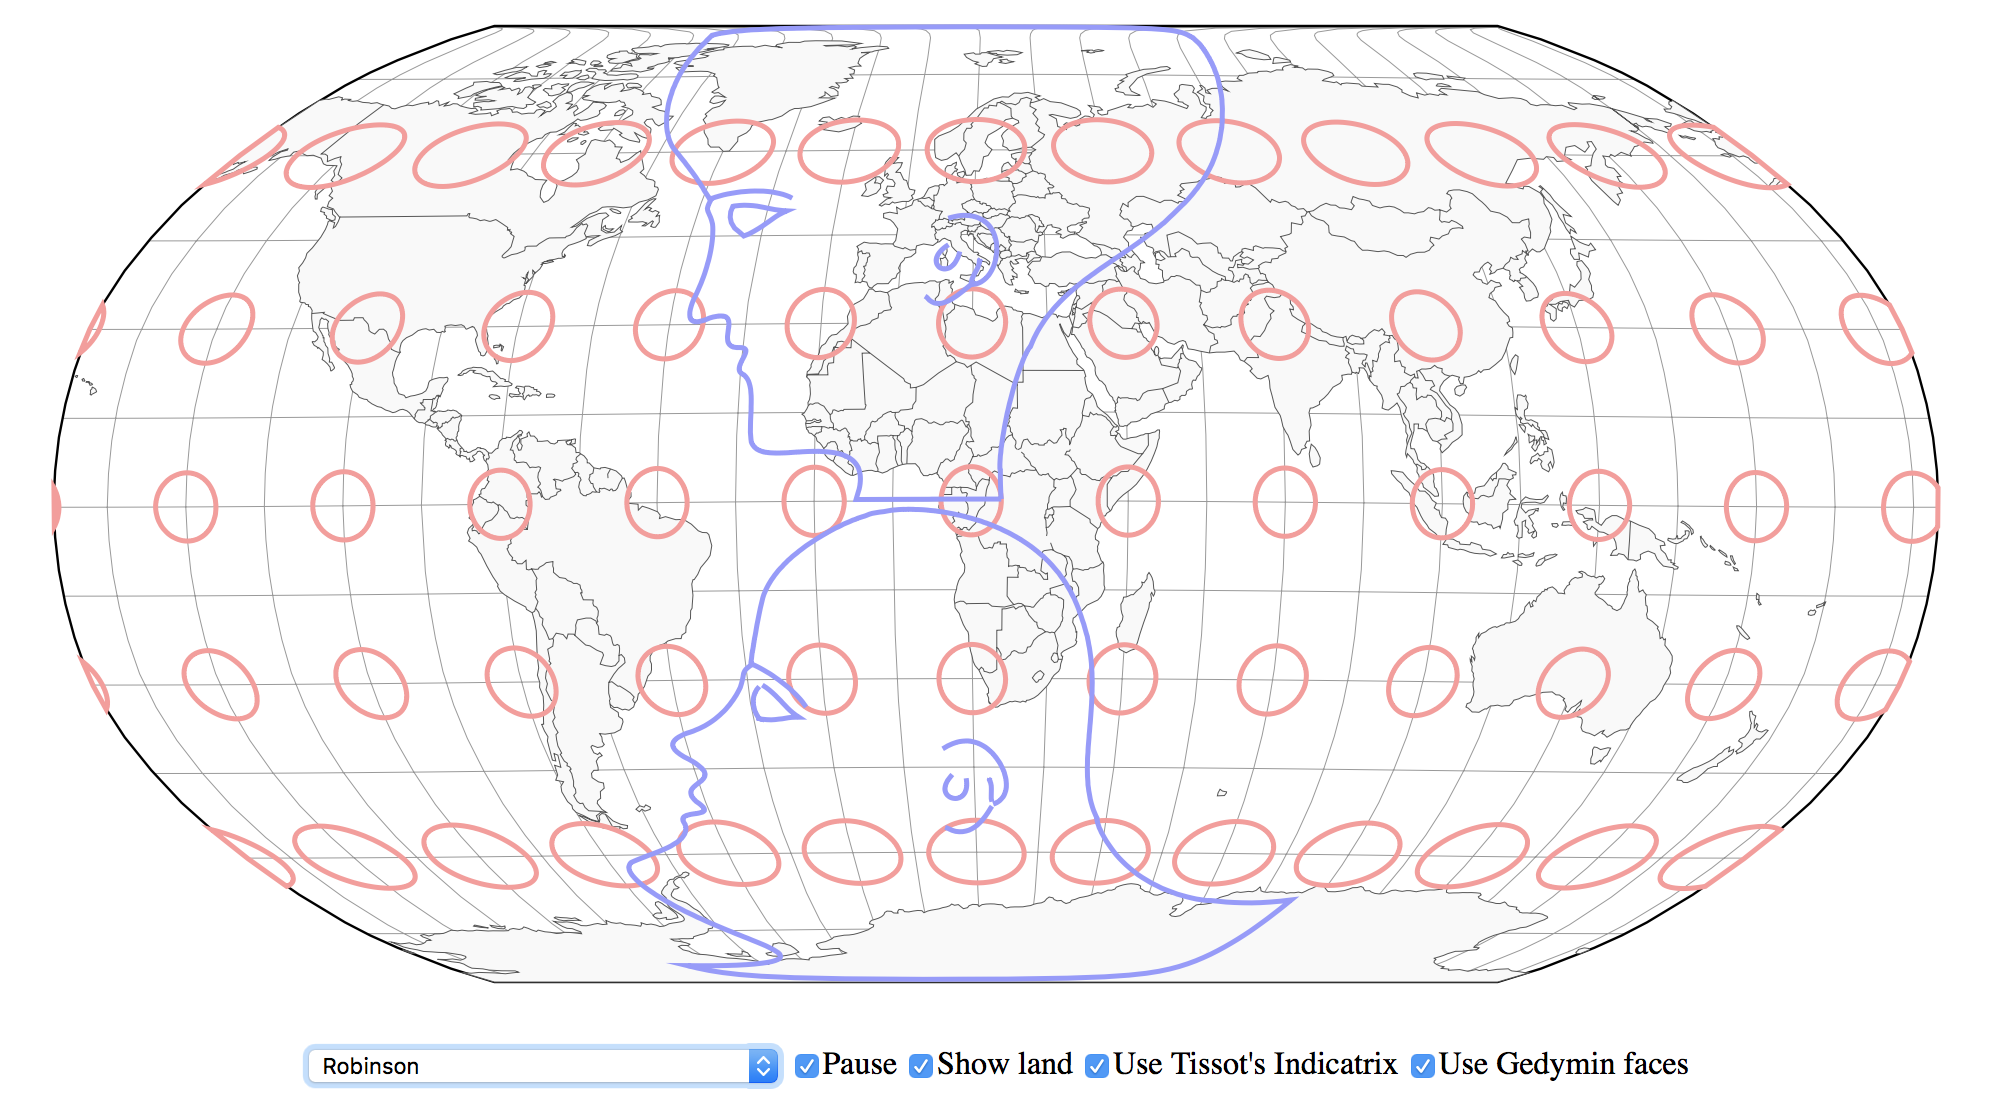
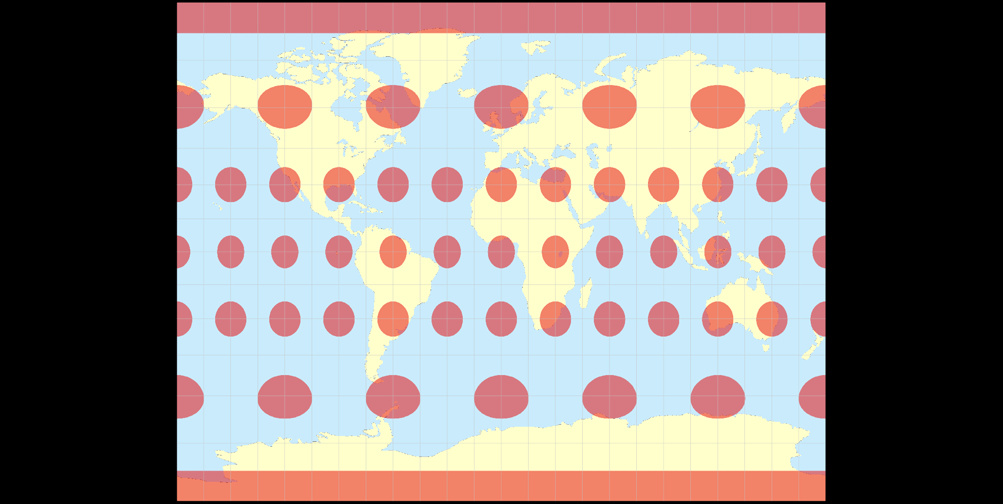
2. Understand distortions with Gedymin faces
My favorite image describing map projections comes from the book “Elements of map projection with applications to map and chart construction” written in 1921 by Charles H. Deetz. A similar concept has been further developed in 1950s by a Soviet cartographer named Gedymin who developed an even larger set of heads used to show in an easy to understand way, distortions caused by map projections.
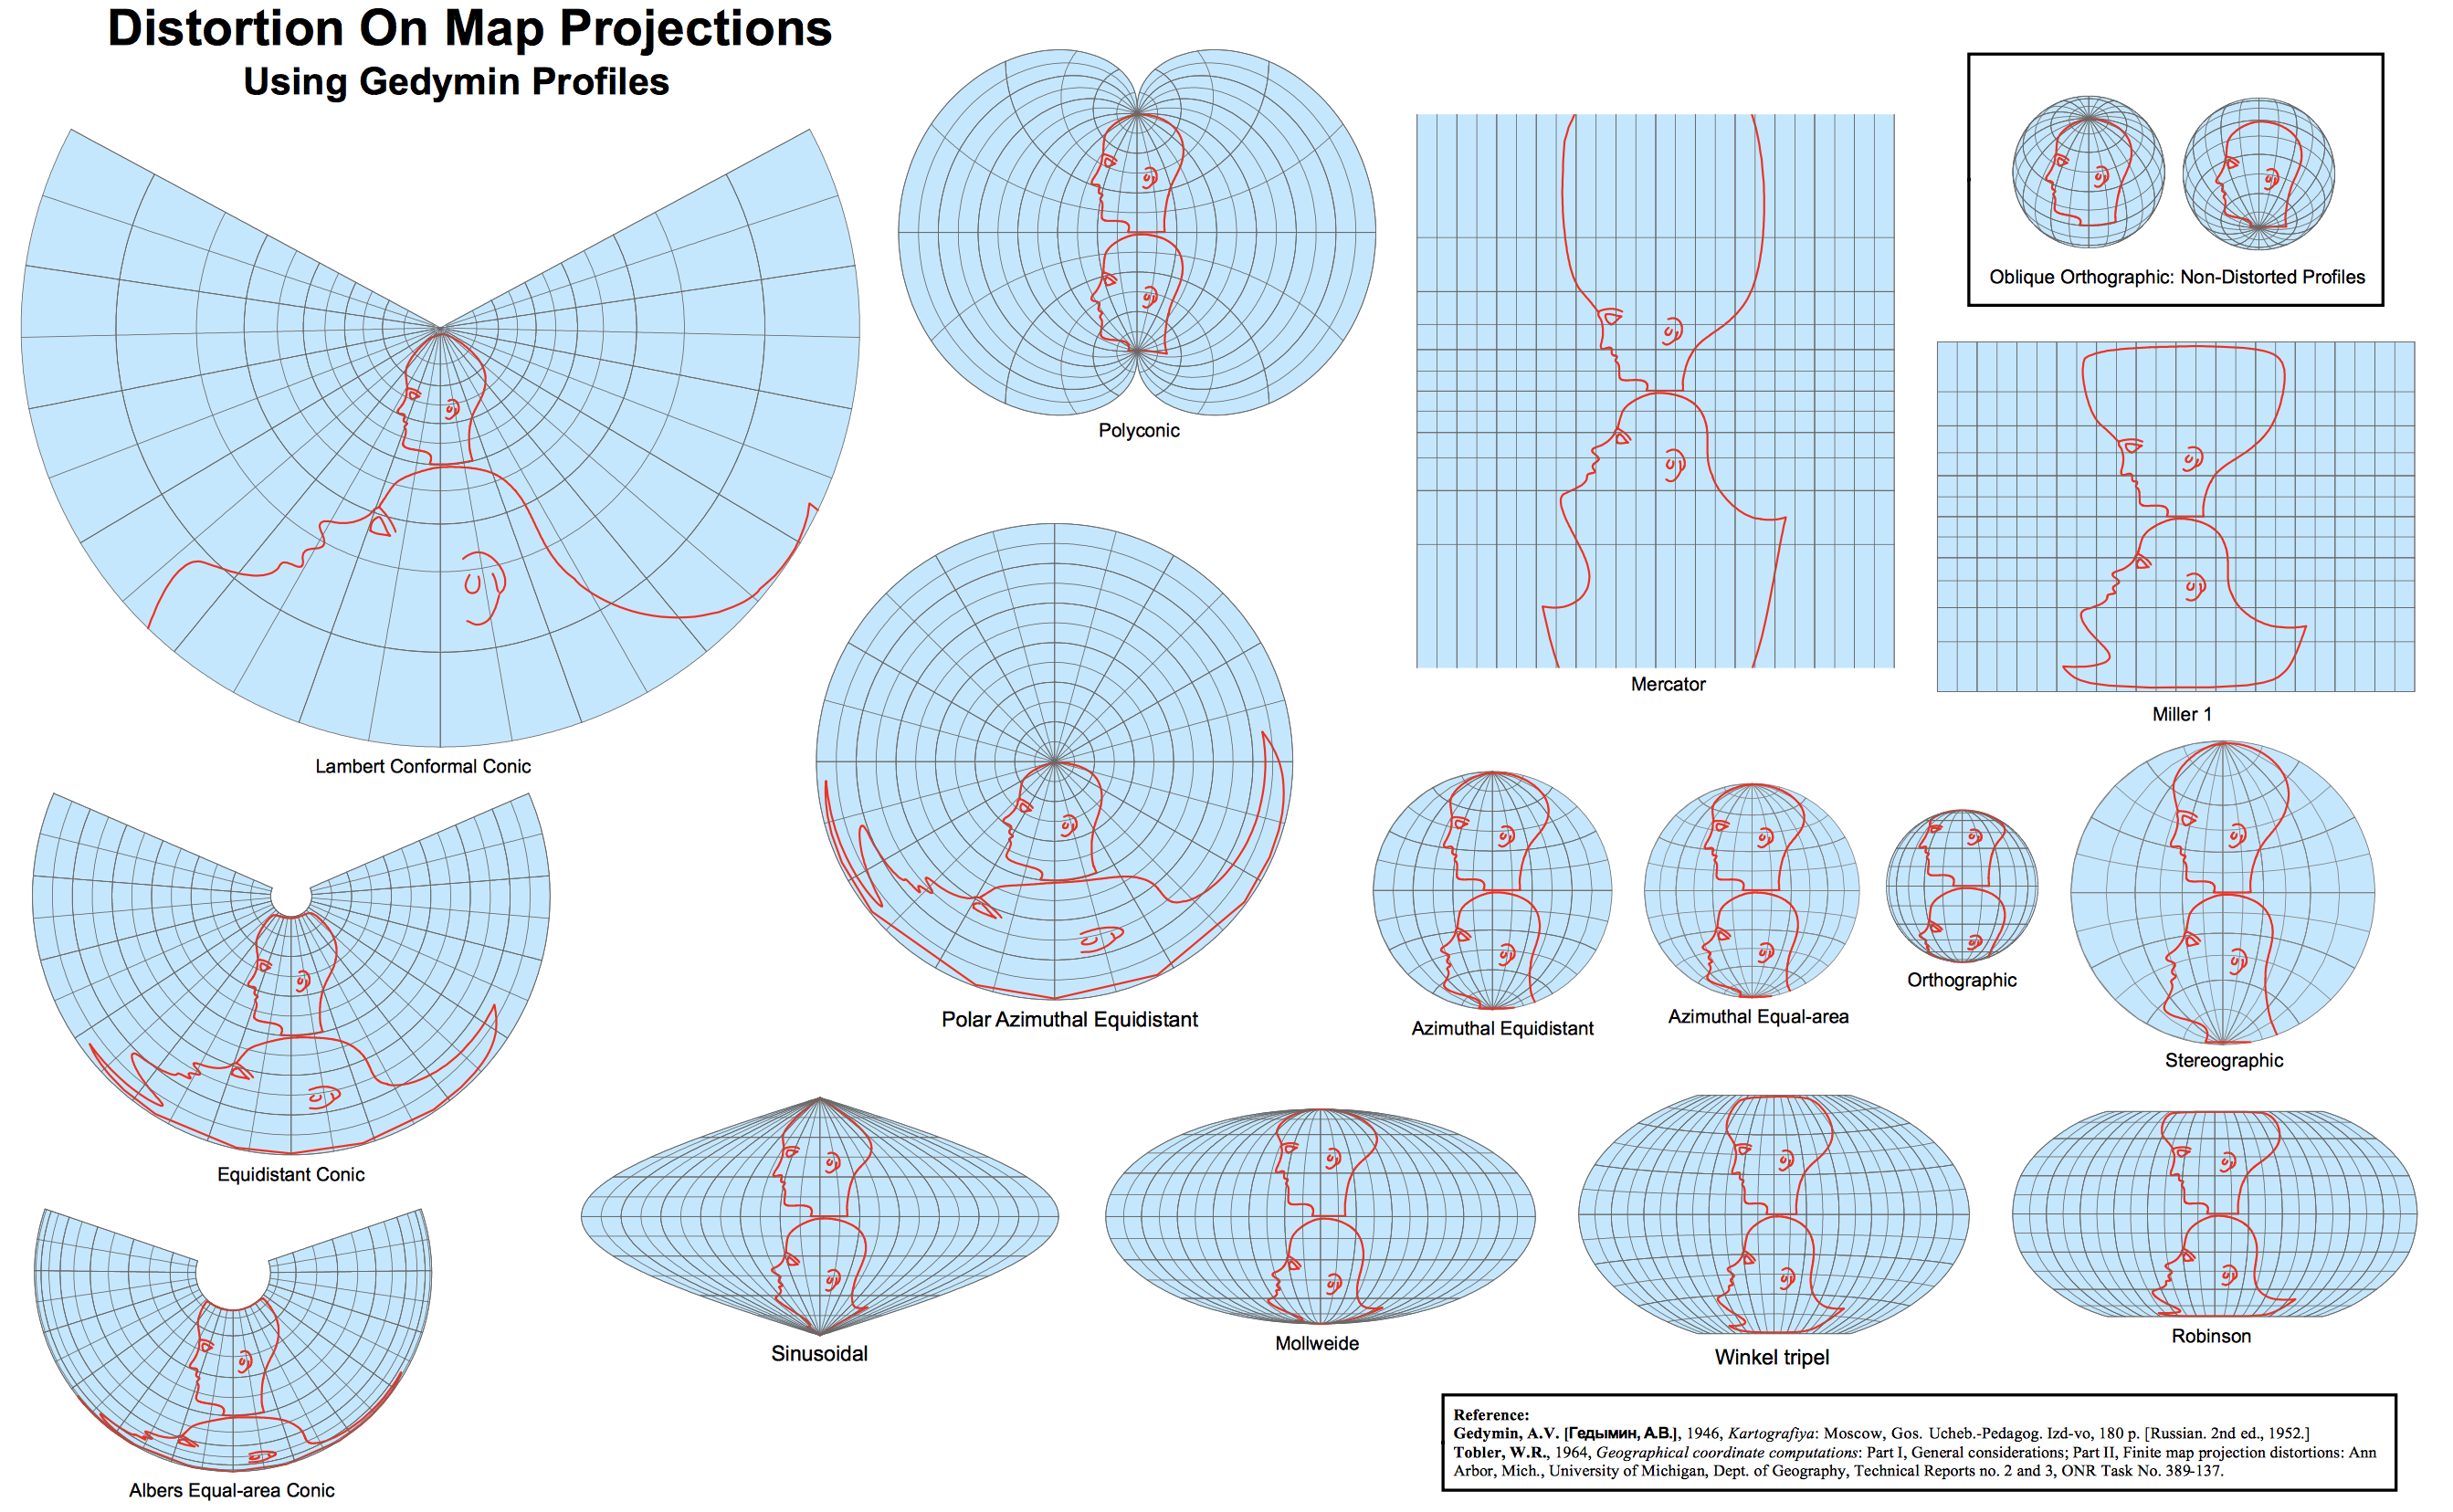
Ningchuan Xiao from the Ohio State University has applied this technique in this awesome tool where you can illustrate the distortions using both Tissot’s indicatrix and the Gedymin faces.
3. Analyze key characteristics of each major projection
Another great tool lets you understand details of some of the key projections out there. Each of the projections is described with name and a couple of parameters:
- Acc. 40° 150% – The Acceptance index is a numerical measure that summarizes overall projection distortion, in this case with a maximum angular distortion of 40° and areal distortion of up to 150%.
- Scale – The weighted mean error for overall scale distortion.
- Areal – The weighted mean error for areal distortion.
- Angular – The mean angular deformation index.
In other to get it, take a look at Mercator. You can easily say that it’s a conformal projection (preserving the angles) as angular deformation index is zero (while the scale and areal deformations are at the maximum).
4. Compare over 200 projections
This website is probably the biggest repository of map projection knowledge that you’ve ever seen. It features over 200 projections and allows you to easily compare them.
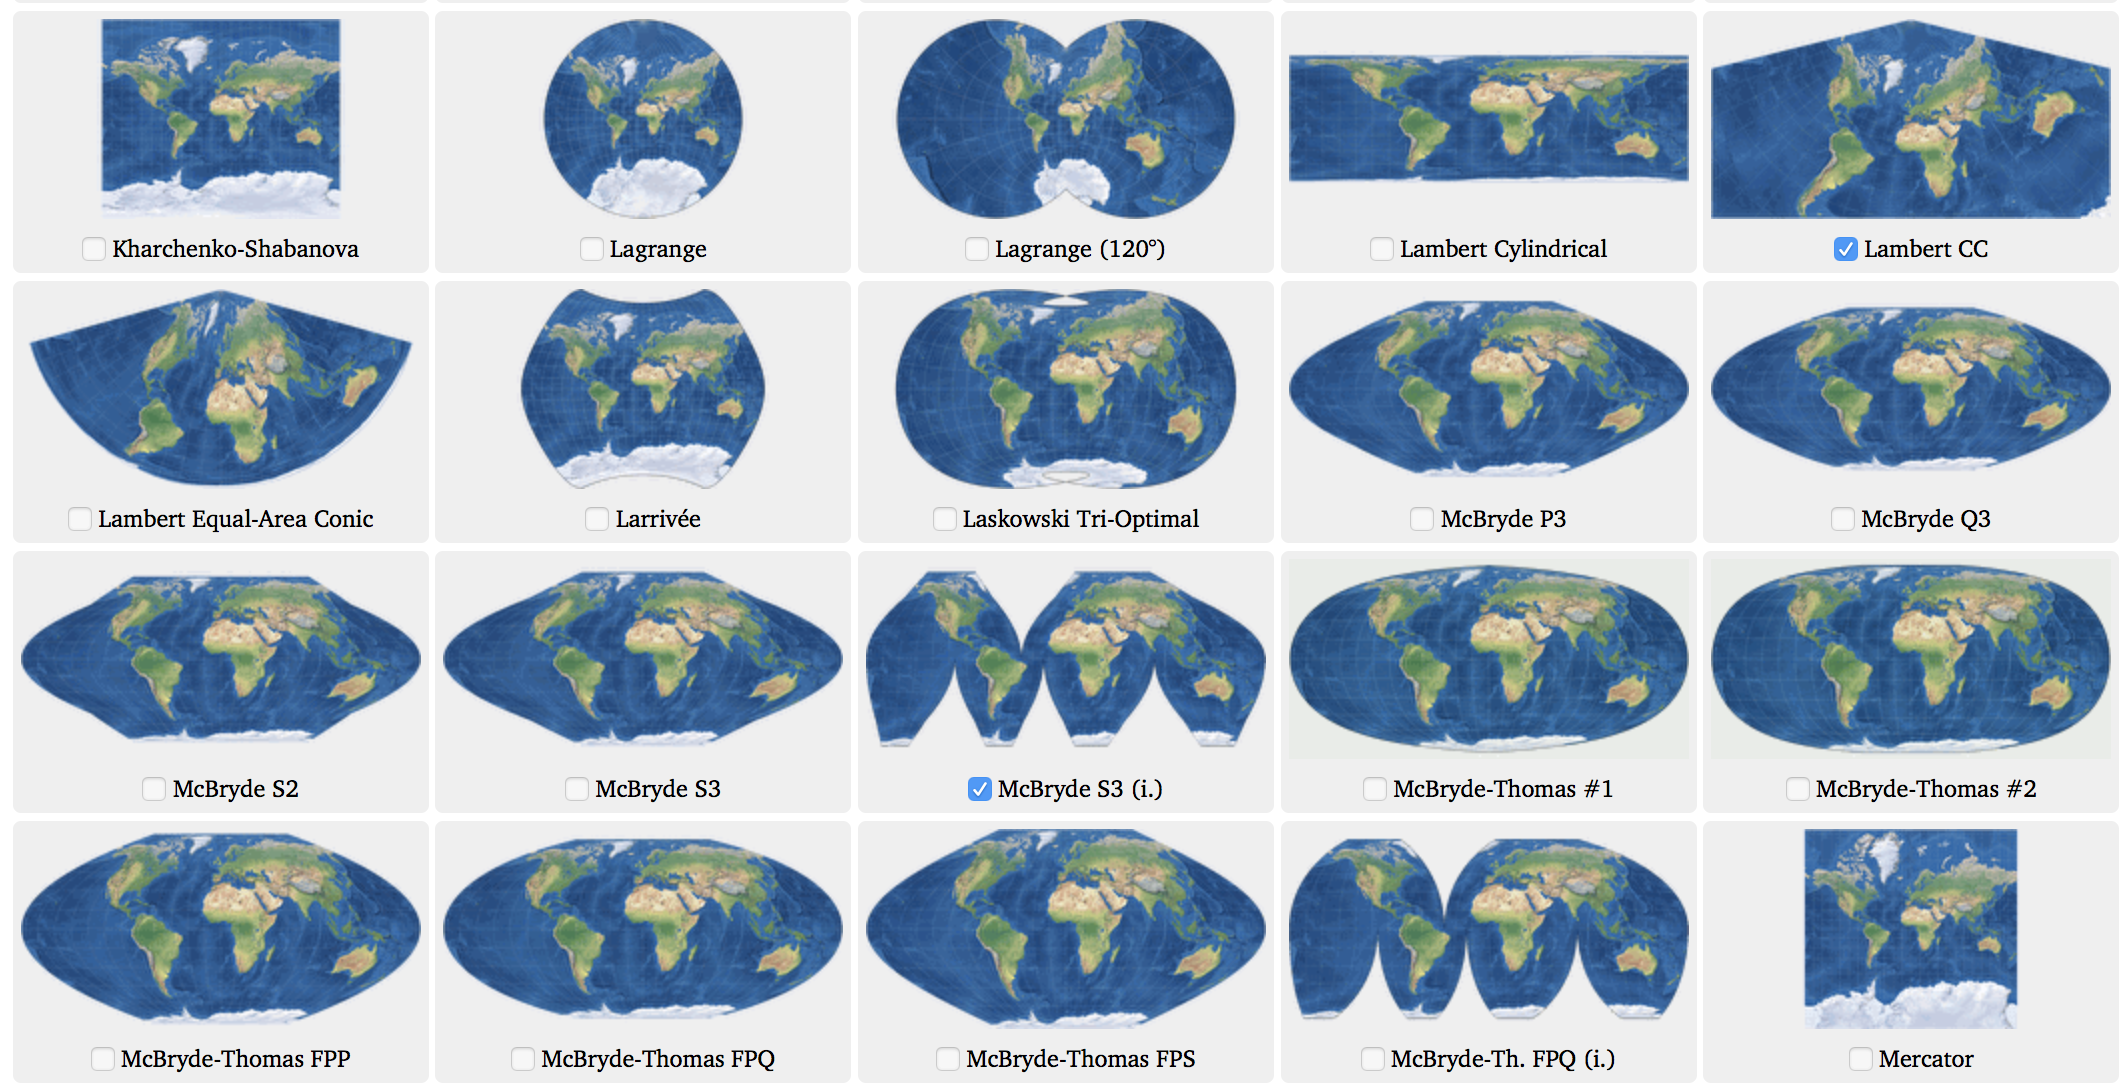
Once you select projections, you can overlay them:
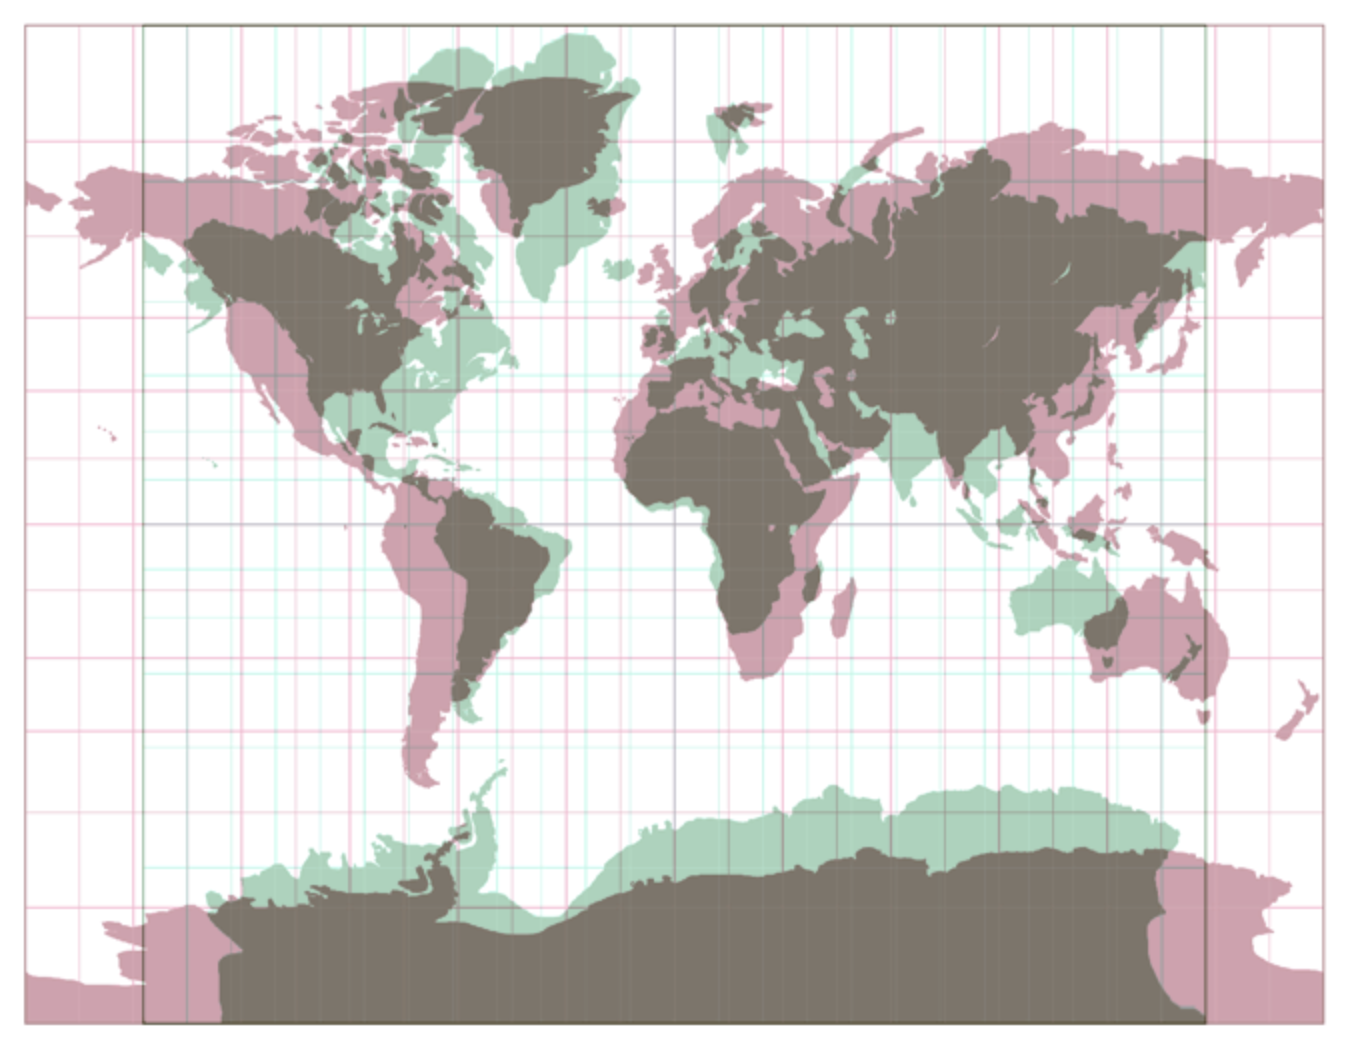
and compare their Tissot’s indicatrix distortions:

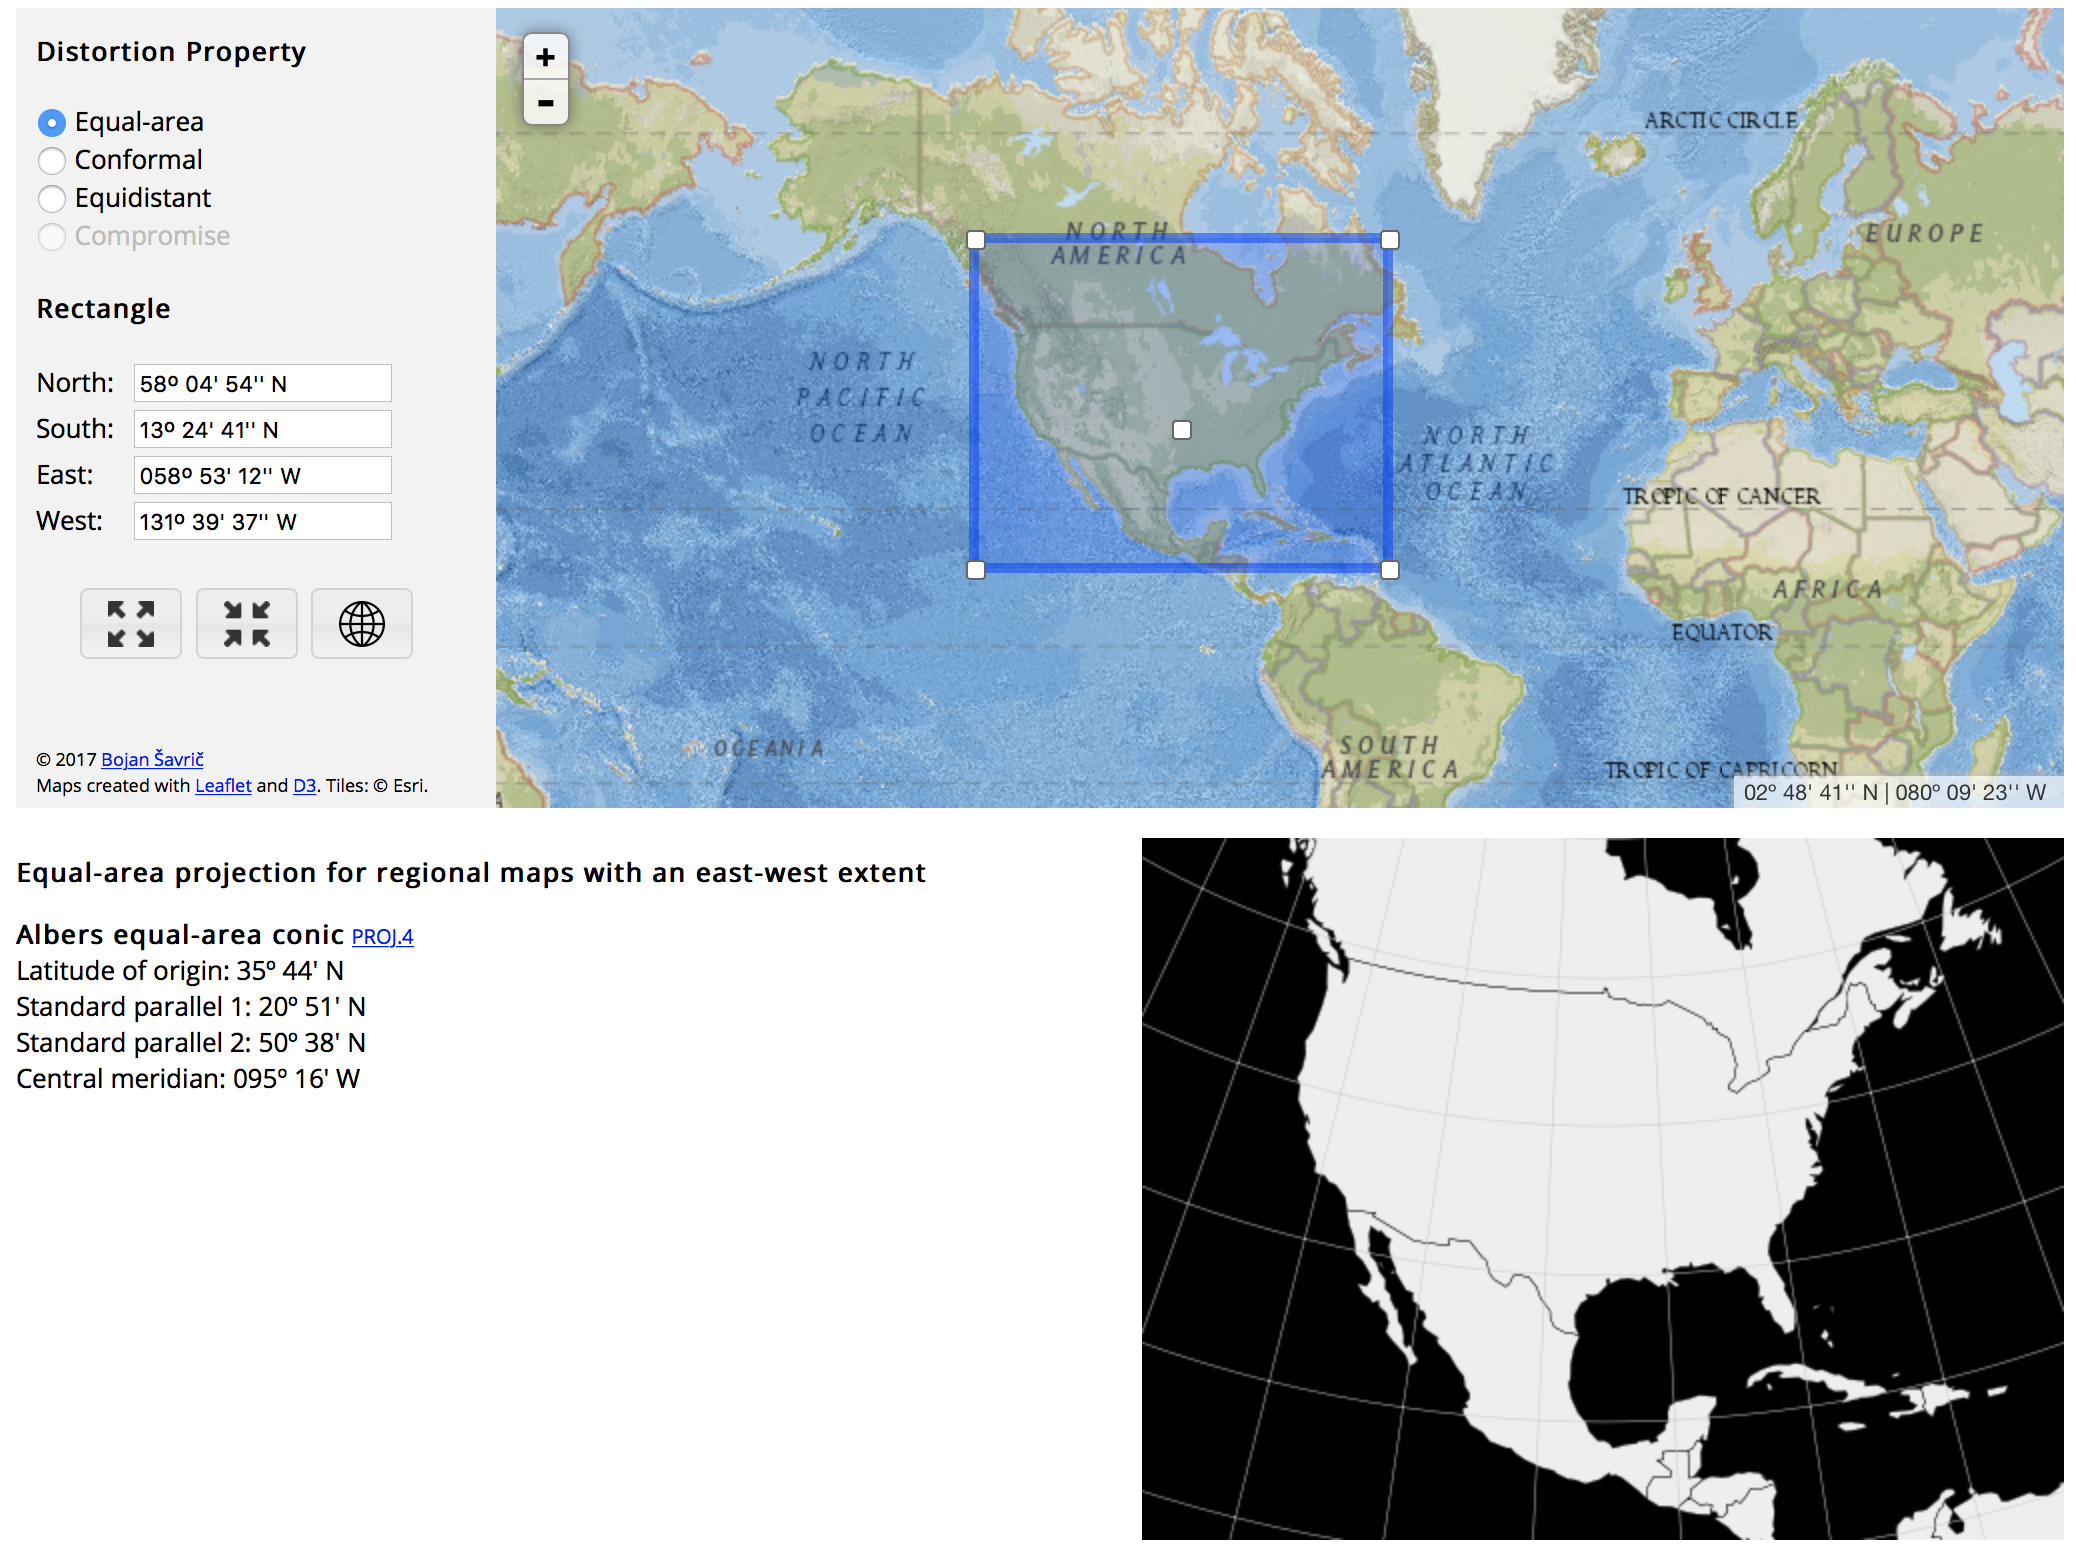
5. Find the best projection for your purpose and geography
Finally, there is also a tool called Projection Wizzard that was designed to help cartographers select an appropriate projection for their map. Depending on the extent and the distortion property of the map, the application returns a list of appropriate map projections with additional projection parameters if necessary.