
 A Wi-Fi transmitter and two drones. That’s all scientists need to create a 3D map of the interior of your house. Researchers at the University of California, Santa Barbara have successfully demonstrated how two drones working in tandem can ‘see through’ solid walls to create 3D model of the interiors of a building using only, and we kid you not, only Wi-Fi signals.
As astounding as it sounds, researchers Yasamin Mostofi and Chitra R. Karanam have devised this almost superhero-level X-ray vision technology. “This approach utilizes only Wi-Fi RSSI measurements, does not require any prior measurements in the area of interest and does not need objects to move to be imaged,” explains Mostofi, who teaches electrical and computer engineering at the University.
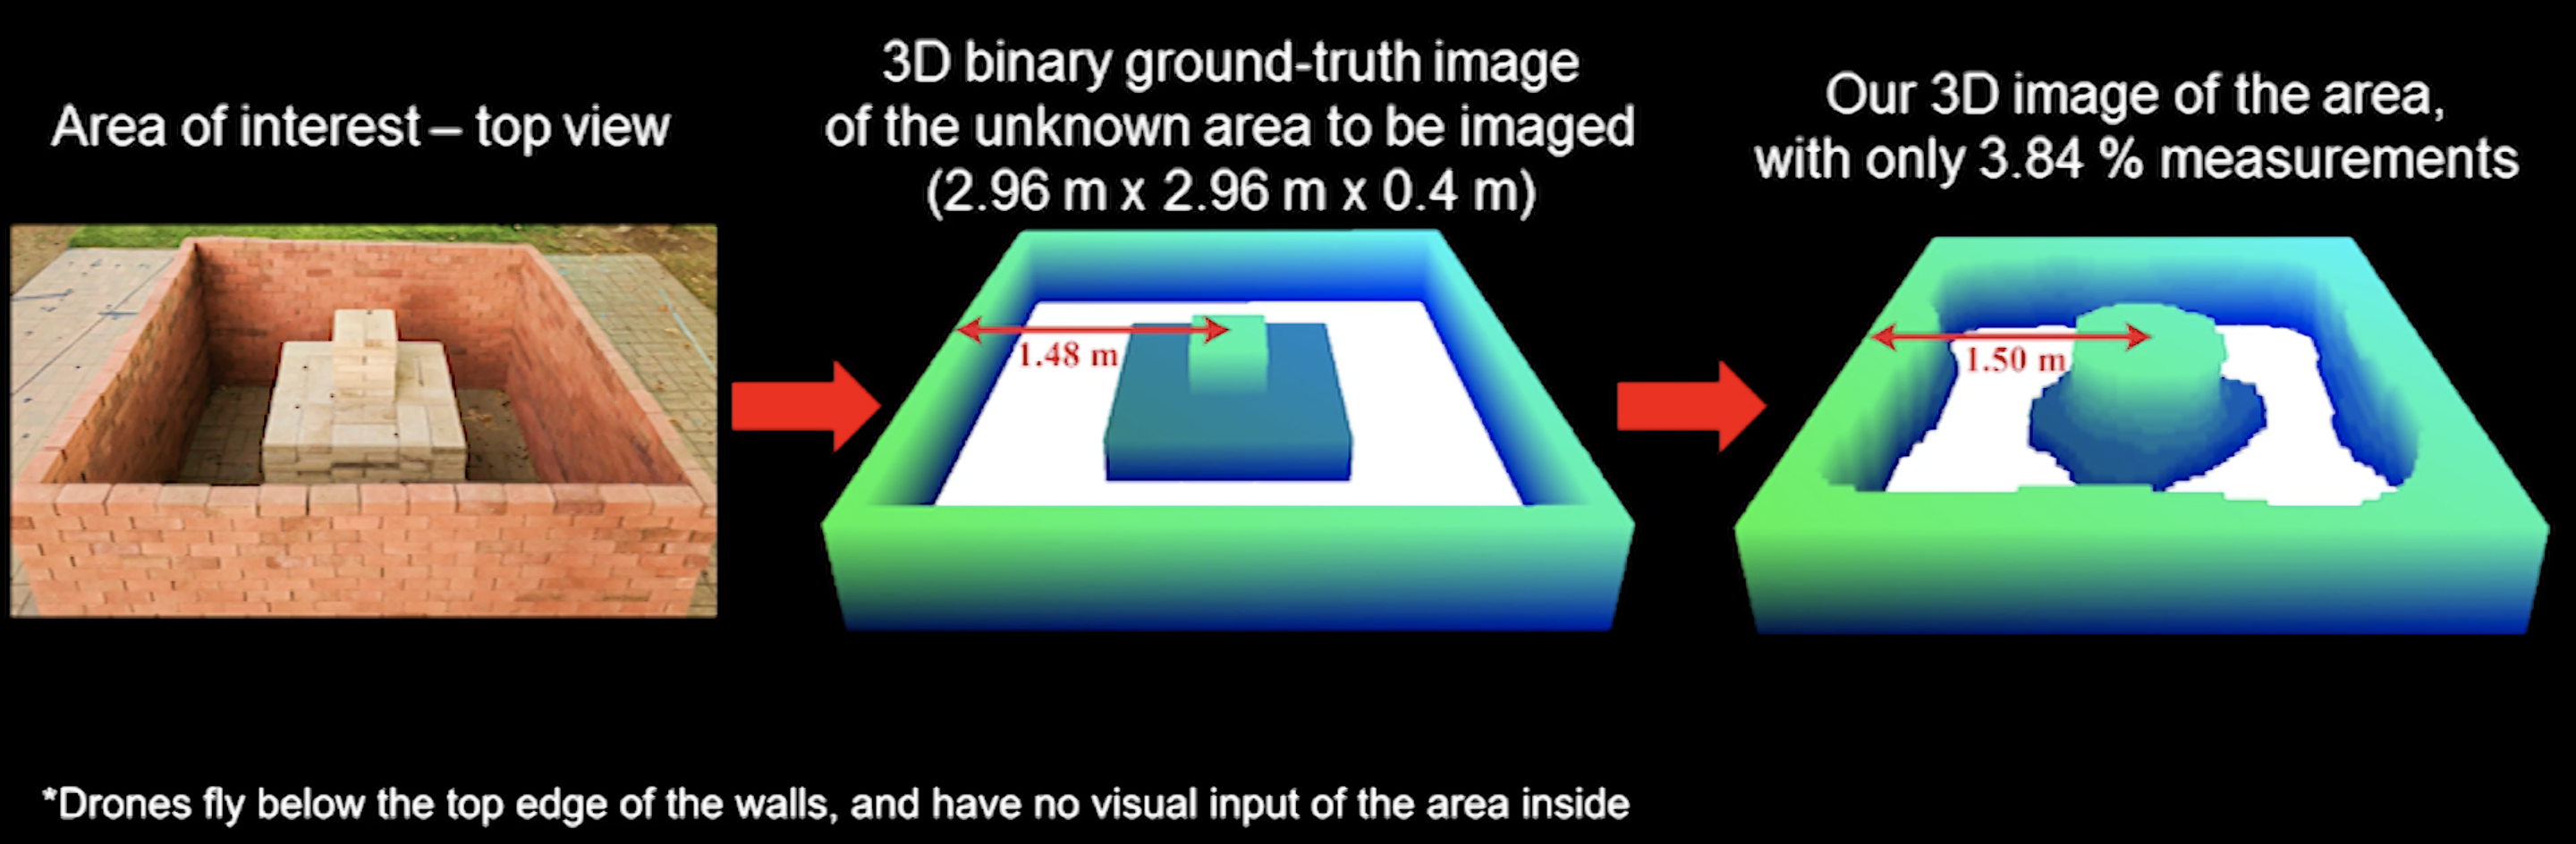
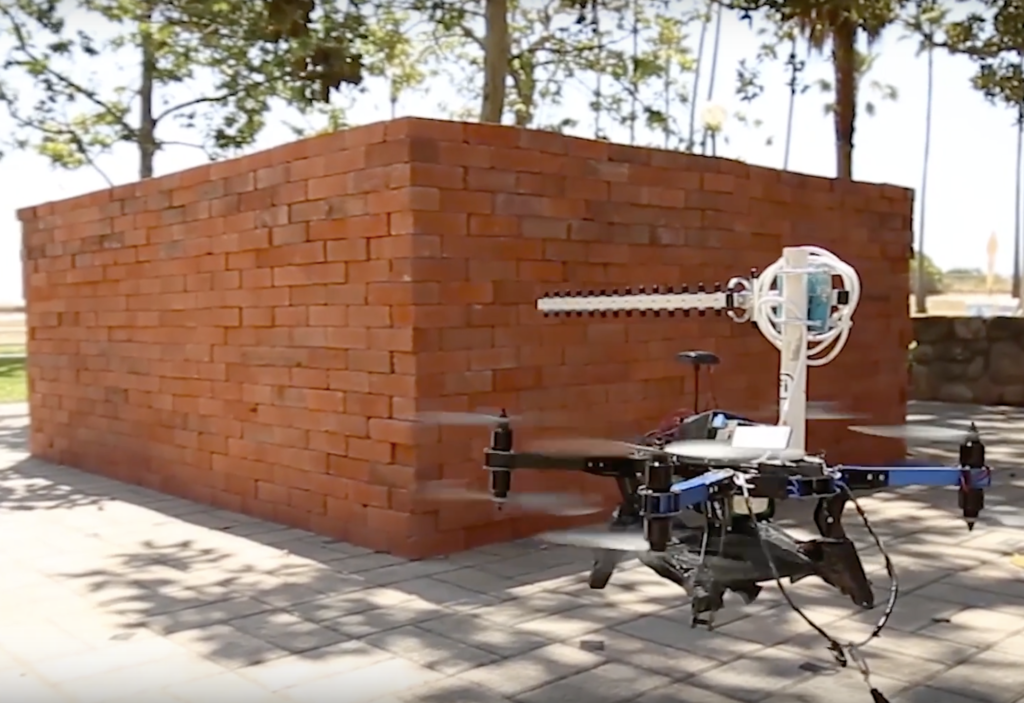
Here’s what the researchers did: They flew two UAVs in synchronous paths outside a closed, four-sided building whose prior measurements were not known to the drones. While one drone kept transmitting the Wi-Fi signal, the other drone recorded the power of the signal. By measuring the variations in signal strength, the dimensions of the objects inside the building could be ascertained to draw detailed 3D images.
Related: Google is testing indoor positioning technology through Tango devices
Even though Mostofi concedes that imaging real areas could be much more challenging due to the considerable increase in the number of unknowns, it is interesting to note that the researchers were able to get near-perfect results in their experiments by using less than 4% Wi-Fi measurements. With a higher number of measurements, the efficiency of the technology should go up significantly.
As such, this technology can have a huge impact in emergency search-and-rescue situations where first responders should be able to figure out what’s inside a building without risking their lives. The other possible applications could come from the fields of archaeological discovery and structural monitoring.
Check out the video below to see the exact approaches the researchers followed to achieve this 3D through-wall imaging:

#Business


Next article
 New York, one of the most populous cities on the earth, is often called the cultural and financial capital of the world. Tracing its origins back to 1624, the city is home to some of the world’s most-recognized landmarks – Times Square, Wall Street, Central Park, et al. But have you ever wondered how New York used to look before all these developments had taken place?
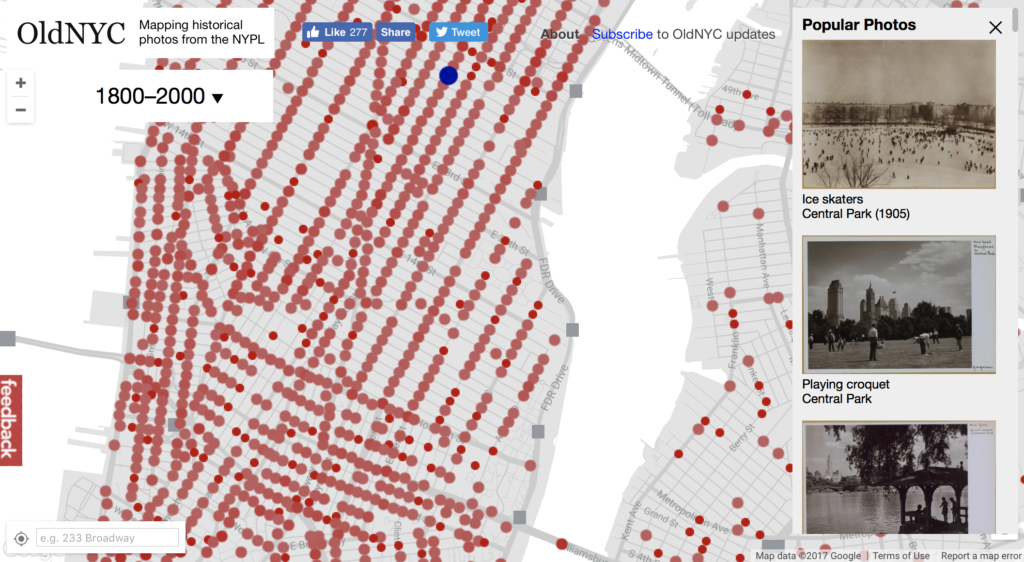
Dan Vanderkam, a Software Engineer at Sidewalk Labs, was curious enough to find out. So he took more than 40,000 images from New York Public Library’s collection from 1870s-1970s and neatly geocoded them on a present-day map over a period of 18 months. The result? An incredible interactive map called OldNYC that lets you see the history behind the places you are oh-so-familiar with!
So put on your sepia-tinted glasses and zoom into the past of the cultural icons you know and love, such as these under-construction scenes of the Manhattan Brooklyn Bridge or ice skaters in Central Park in 1905. The map has a cool little time slider that lets you narrow down your searches to specific time periods as well.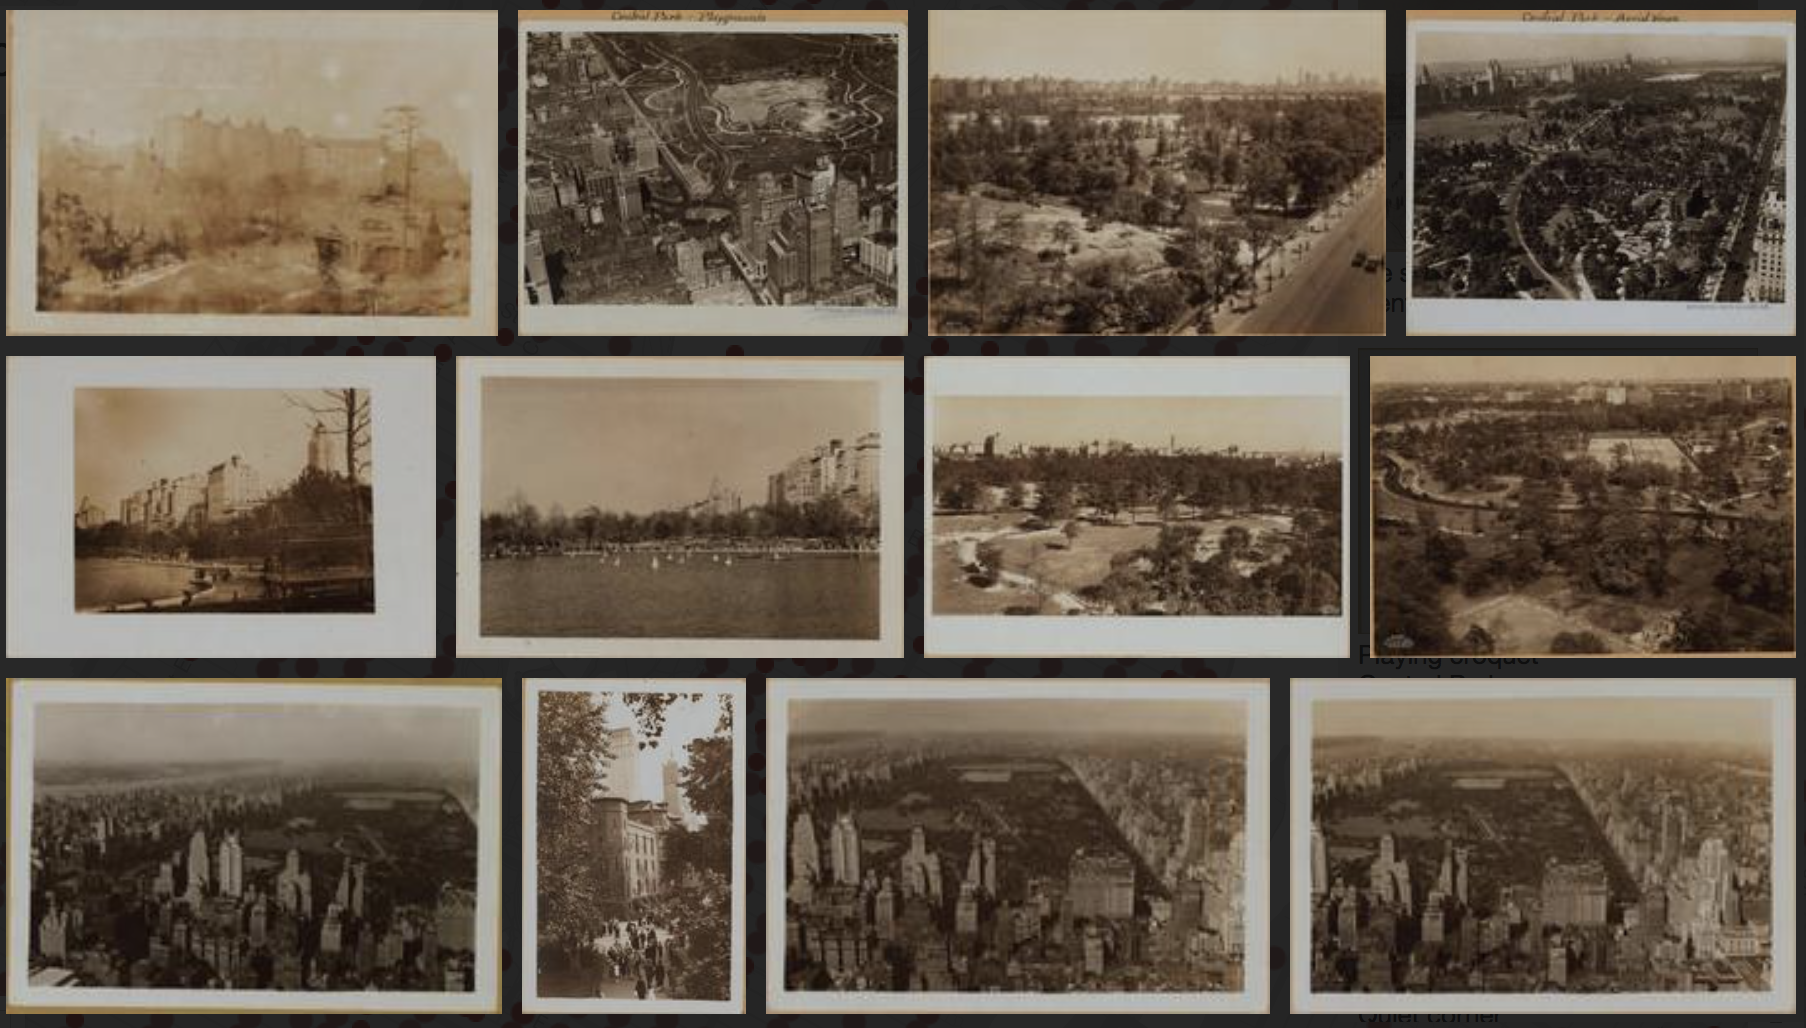
Most of the images used by Dan come from the New York Public Library’s Milstein collection which catalog photographer Percy Loomis Sperr’s works documenting the changes to the city between the late 1920s and early 1940s.
At an event celebrating the launch of the OldNYC website, Dan detailed how the idea for this map germinated when he stumbled upon a historic, incorrectly-labeled image of his neighborhood. “I realized the right way to present this information is not through keywords. The right way to present this information is through maps.”
If you are technically-inclined, you can read about how Dan extracted the images from the library’s photo cards here, and how he generated the training data for the photodetection project here.