
We live in the digital age where we do our online research, then we choose our path. We do this in everything we do like choosing a vacation, selecting a college, or pursuing a career. If you are thinking of entering the GIS field or progressing further with your career in GIS, then this report is sure to help. We surveyed Indeed for the top 25 countries and there are currently 36,257 jobs available that are asking for GIS skills. A summary of GIS salaries shows that the average is USD $72,995/yr but earnings rapidly increase with developer and administrator skills. There are 5 key reasons this industry will continue to grow and offer opportunity to anyone that wants to learn GIS as a technical upskill to their discipline studies (e.g., environmental, biology, planning). If you need encouragement, there are lots of welcoming people in our industry. Or book a time with us and we’d be happy to talk.
GIS jobs near me: distribution by country
Who is hiring and where are the jobs? GIS is used across the board in most municipal, engineering, environmental, planning organizations. We see opportunities for both employment or consulting jobs with these organizations. Urban centers produce the most jobs with lots of building and environmental requirements. Rich Serby, Geospatial Recruiter at Geosearch, talks about the in job opportunities with funding in the United States that will be used to address the financial rebound from a COVID stressed economy. Asia Pacific growth of GIS is forecasted at CAGR 15.71% through 2028. China has major investments in cognitive analysis for autonomous driving vehicles. India has a growing National Smart Cities program launched in 2019. Meanwhile, the European GIS market has a projected CAGR of 7.1% through 2027. This is evidenced by programs like ESA and the French SPOT program with benefits to measure climate change.
Sustainable development and alternative energy are areas demanding GIS analysis and the professional talent to support projects. It’s a good sign to see consortiums like the United Nations Geospatial Network which has the mission to address global challenges regarding the use of geospatial information.
| Country | Number of GIS Jobs |
| Australia | 471 |
| Austria | 204 |
| Belgium | 320 |
| Brazil | 303 |
| Canada | 935 |
| China | 474 |
| Denmark | 131 |
| Finland | 14 |
| France | 212 |
| Germany | 2,745 |
| India | 518 |
| Ireland | 122 |
| Italy | 304 |
| Japan | 2,138 |
| Netherland | 828 |
| New Zealand | 259 |
| Norway | 715 |
| Singapore | 128 |
| South Korea | 116 |
| Spain | 231 |
| Sweden | 357 |
| Switzerland | 220 |
| United Arab Emirates | 38 |
| United Kingdom | 1,078 |
| United States | 23,396 |
| Total | 36,257 |
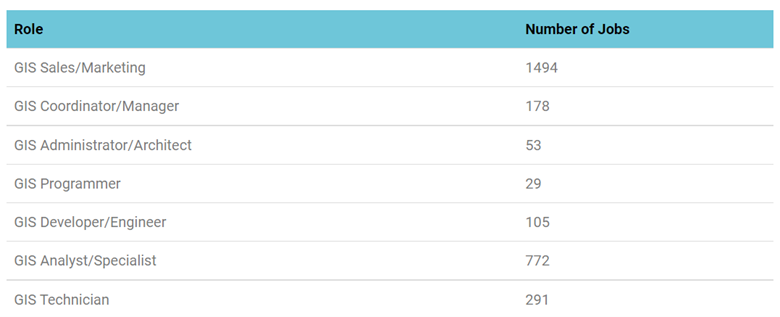
GIS positions and roles
As we read through hundreds of these job announcements, it was evident that there were jobs in many industries that were requesting GIS skills such as: healthcare statistician, forester, and real estate specialist. This skill could be layered into the job requirements just like the need to know CRMs, databases, or graphic design. But let’s focus on the key geospatial roles that are typically found in GIS departments and are the center of data management, analysis, and visualization. We see job offerings all across the board. And the high numbers of GIS analysts/specialists are what we would predict as they do the majority of the data prep and analysis. But their responsibilities are growing as a lot more customized web development is needed as geographic applications become the ultimate access point to the data for larger audiences. The main area of surprise is GIS in support of marketing and sales. These could very well be GIS analysts that are asked to work with their marketing teams to produce GIS products that can be very compelling graphics to win business.
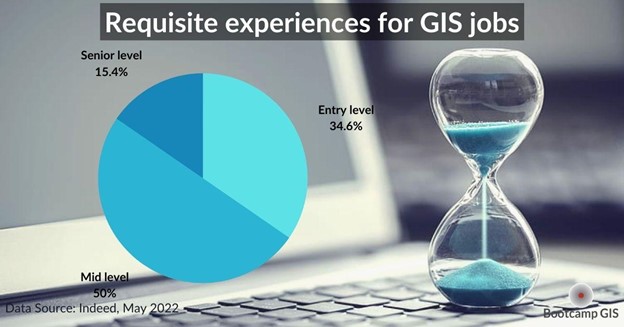
GIS experience: requisite levels
Everyone is somewhere on the spectrum of professional experience. If you are new to GIS, consider that the entire tech sector is full of upward mobility. This is because your efforts to add current technology to your portfolio can be more appealing than someone who learned the technology 10 years ago and might be outdated. Before choosing your learning route, look at the ROI seen in Masters in GIS or with getting a GIS Certificate. Some of the best GIS architects we know did not have geography degrees, but they had a desire to learn and jump into projects. In the upper experience levels, we see requests to know web GIS, system integration, and agile management skills. Everyone now has the recurring task to learn more. Here is a breakdown of the percentage of jobs falling within various experience levels.
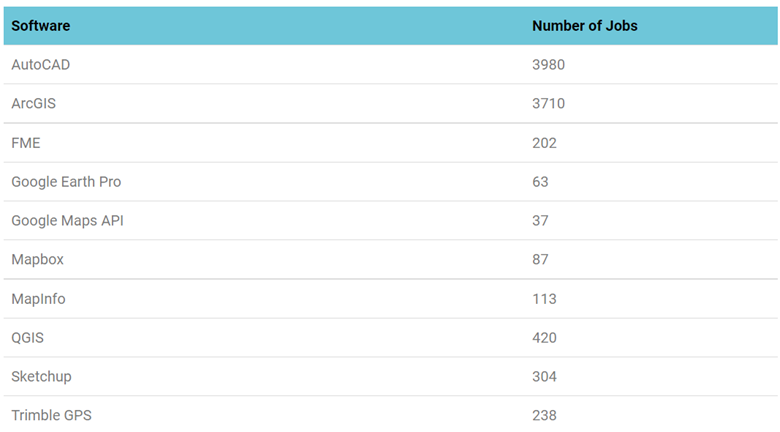
GIS software most seen in job announcements
Universities typically don’t like to be known as trade schools. Especially in tech where the tools change all the time. Even large government organizations count on its staff to figure out their own training needs. In both cases it becomes the responsibility of the enduser to stay on top of what is current and pursue the know-how. Here are the most commonly requested software packages related to geospatial roles. Of note is the nearly equal AutoCAD and ArcGIS numbers. Both have different needs, dominant followings, and intersect in many projects. Whichever world you play in, it is a marketable advantage to say you have experience in converting data to and from CAD to GIS.
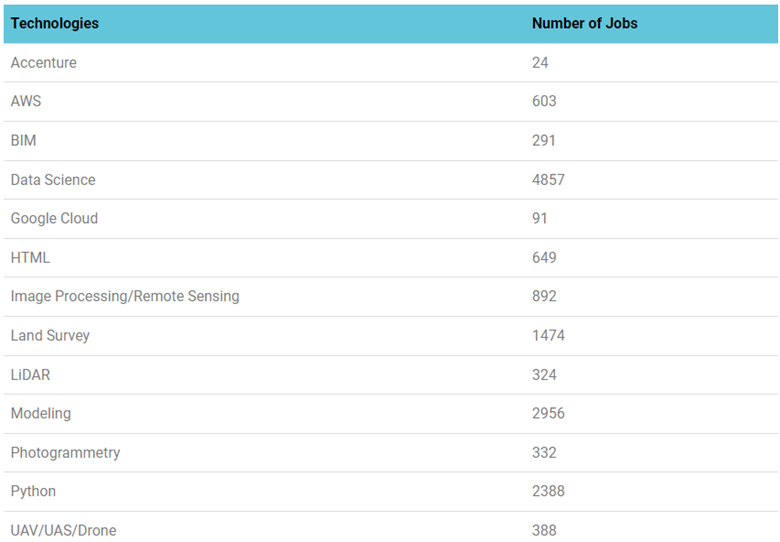
Geospatial technologies most in demand
One of the reasons GIS has grown in scope and number of jobs is its integration and blend with other technologies. The person that can architect the ‘map system’ rather than just the map is extremely valuable. This definitely means you need to double time your DIY learning in 2 or more areas like you can see in the need for cloud/GIS skills. This blend of GIS with IT might require you to look at a GISc Certification program. However, the biggest surprise is the huge number of jobs asking for Data Science skills. This goes along with the large number of Python requests, since this scripting language is used to write routines and models to automate the extraction of data trends. Those of you that have portfolios blending GIS/Cloud or GIS/Data Science will likely be rewarded with higher salaries.
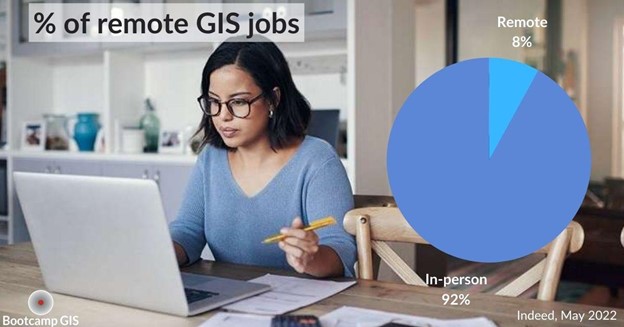
Remote GIS jobs
So you want to be paid to work remotely. Are you crazy? Oh wait. It’s a growing thing now all across tech. Of course, the pandemic proved that IT consulting companies remained productive while staff was distributed. But it’s made hiring managers scratch their heads and say that this could be just as good for the company as the employee. We can now hire people without the risk of moving them from their family, their accustomed cost of living, and without paying for extra office infrastructure. There has been a 33% increase in remote GIS jobs and this number will continue to grow. With leaner tech business models, companies will be able to broaden their talent pool with lower turnover when they hire people who are comfortable with a work/life balance.
Conclusion: GIS skills are marketable
So there are your GIS job insights. This info can arm you at making yourself more marketable by learning the right technical and analytical skills. If GIS is a new area to you, there are now many ways to learn GIS. And if you want to look at efficient alternatives to getting a Masters degree, you can see this list of Top 10 GIS Certificate programs rated according to industry needs. Ultimately this is the purpose of this report: to make sure that students and professionals direct their career where the rubber meets the road with industry needs.
Did you like the article? Read more and subscribe to our monthly newsletter!

#Business


Next article

“… we all try to steer clear of certain places and people, whether we’re aware of it or not.” (Source)
Currently, my preferred route home is through a residential estate. Its definitive characteristic is close-knit houses, children playing outside and a few ‘vibandas’ (makeshift stalls). Perhaps it’s the sense of community that draws me here. Or maybe it’s because after so many years, the place remains unchanged.
Unlike me, not everyone prefers this route. Some avoid it despite—or perhaps because of—the things that draw me. While our routes change based on different circumstances, the common ground is that they’re determined by the things we’re trying to avoid.
Mapping the Things We Avoid
What if we could create a map of the routes we follow and the people/ things we avoid?
Well, that is what members of the Perfect City working group did. At a workshop, they asked people living in New York City (NYC) to draw maps of what, whom, or where they avoided. The result? Avoidance Maps.
I first heard about avoidance mapping on episode 034 of Isn’t That Spatial podcast.
The idea of creating maps based on people’s experiences with navigating the city intrigued me. For some reason, it made me think about the cartography cube, and the space avoidance maps occupy therein.
But I’m getting ahead of myself.
Why Produce Avoidance Maps?
Maps help people see what isn’t obvious from tables/ text. But what would make someone spend their time and effort producing avoidance maps?
In this case, creating avoidance maps made the participants understand who they were in NYC in a new way. Specifically, the avoidance maps were:
- Useful in seeing how the ability to navigate a place successfully depended on knowledge of the place and the feeling of belonging
- Provocative because they showed that what/ whom you avoid says as much about you as avoidances themselves
- Creative because they led to formation of new narratives about the city from different points of view
Above all, the maps helped to see how gender, race, class, and geographic backgrounds inform “belonging” in the city.
“It turns out mapping what we avoid also shows us where we feel we belong.” (Source)
Understanding the Cartography Cube
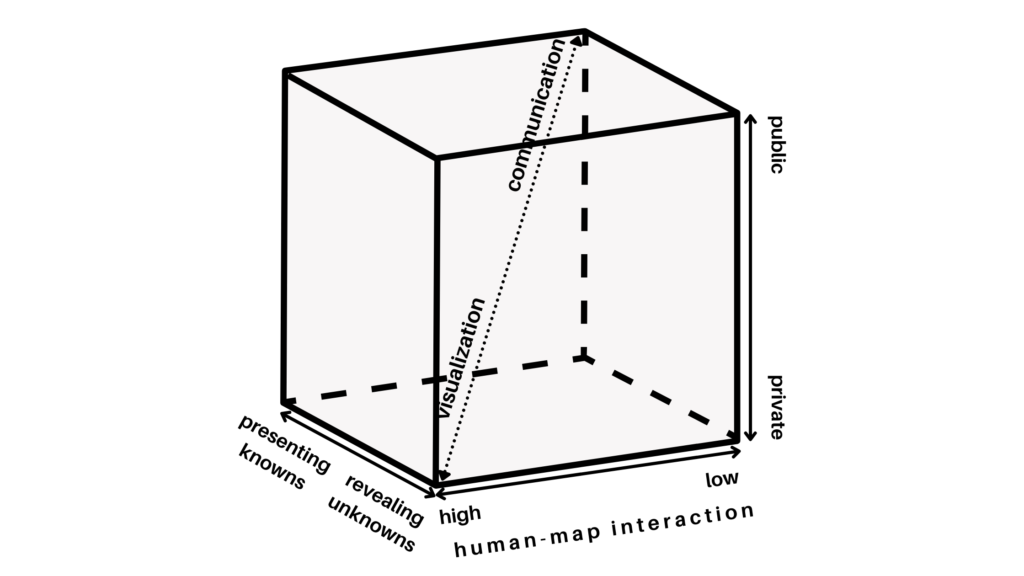
In response to the divergent definitions and views of visualization by cartographers, Professor Alan M. MacEachren formulated a graphic representation of visualization. It was based on treating cartography as a cube, hence ‘cartography cube’.
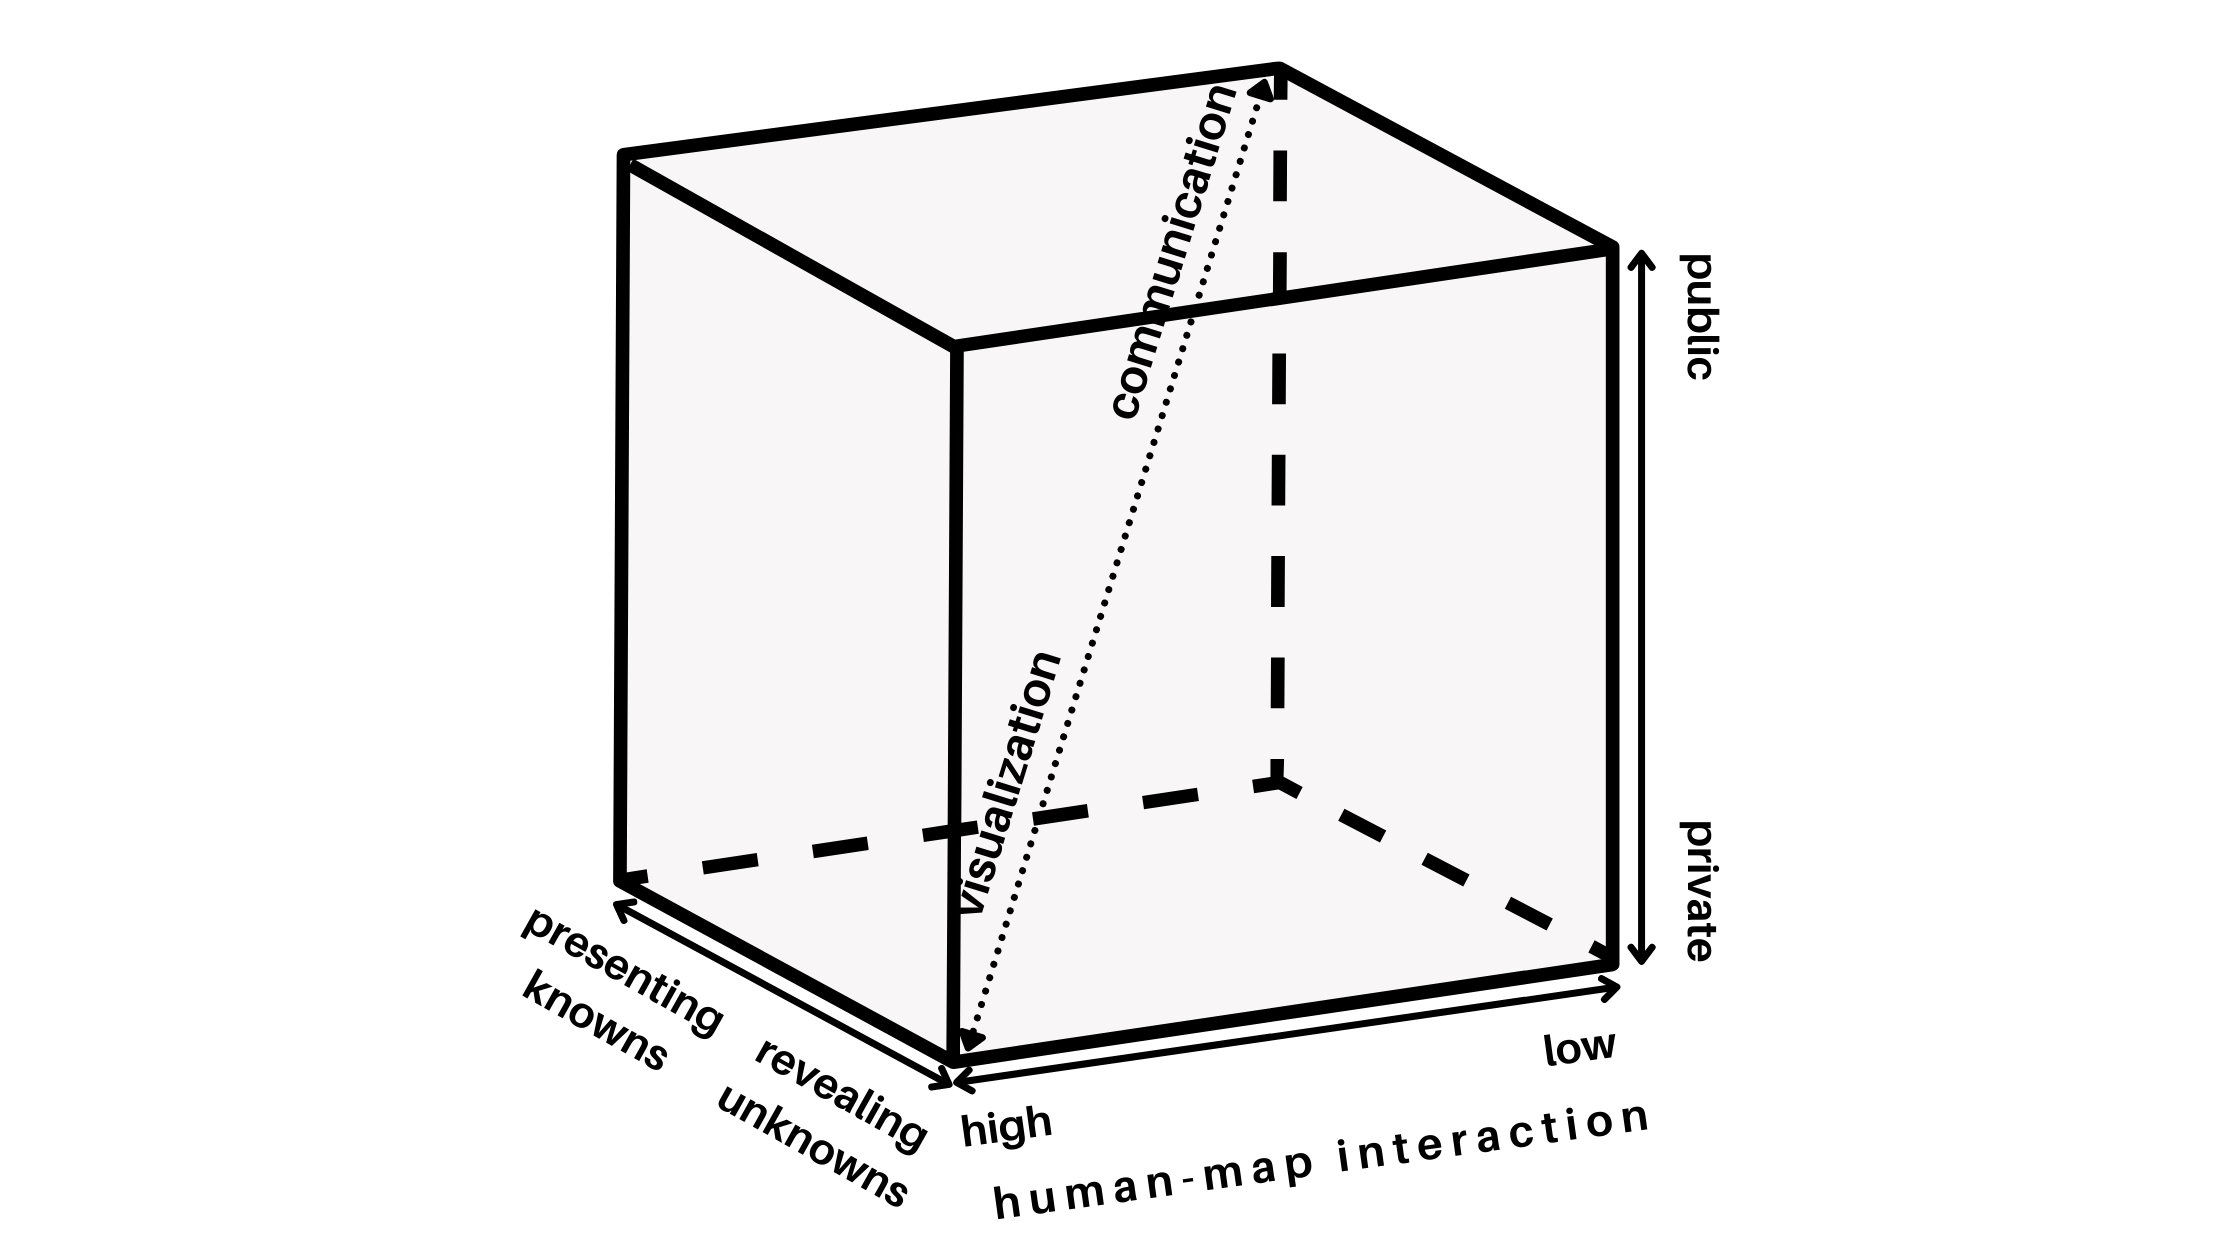
MacEachren’s cartography cube
The cartography cube deals with kinds of map use—and not kinds of maps. Therefore, based on how a map is used, it may occupy any space within the cube.
“The fundamental idea is that map use can be conceptualized as a three-dimensional space. This space is defined by three continua: (1) from map use that is private (where an individual generates a map for his or her own needs) to public (where previously prepared maps are made available to a wider audience); (2) map use that is directed toward revealing unknowns (where the user may begin with only the general goal of looking for something “interesting”) versus presenting knowns (where the user is attempting to access particular spatial information); and (3) map use that has high human-map interaction (where the user can manipulate the map(s) in substantive ways – such as effecting a change in a particular map being viewed, quickly switching among many available maps, superimposing maps, merging maps) versus low interaction (where the user has limited ability to change the presentation).” (MacEachren 1994, p. 6-7)
There are two extremes in the cube. Geographic visualization on one corner and cartographic communication in the other. While all maps contain both visualization and communication, the major difference is the emphasis on visualization or communication at various locations within this space. Emphasis is determined by the primary use of the map—which affects the approach to map design.
Where Does Avoidance Mapping Fit In the Cartography Cube?
Looking at where the avoidance maps by NYC residents fit on each axis of the cartography cube:
Private vs public map use
I would say that avoidance maps occupy the private map use space. This is because the maps were used to help individuals/ small groups of individuals to think spatially. In this case, the maps helped residents, urban planners and architects think spatially about belonging in the city.
Map use directed towards revealing unknowns vs presenting knowns
The avoidance maps were meant to show what it looks like steering clear of certain places and people. It was an exercise designed to lead to conversations about gentrification and displacement, safety and perception. It’s a lens through which to look at bias, belonging, and other subjects.
By mapping the things people avoid, the maps reveal how different people experience and access urban space. Therefore, avoidance maps are directed towards revealing unknowns.
Map use that has high human-map interaction vs low interaction
According to MacEachren, map use can’t take place without some level of interaction. Furthermore, while the use of a computer increases the level of human-map interaction and hence visualization with maps, it isn’t always necessary. Maps can be interactive if they’re drawn in a way that aids visual thinking/ mental visualization. Nevertheless, computer tools expand the possibilities for interaction and hence visual thinking.
Even though the avoidance maps were two-dimensional images hand drawn on paper, they were nonetheless interactive in the sense that they enabled one to mentally visualize the things/ places being avoided.
Note that I don’t dispute that if the maps were represented on a computer, they would be more interactive—and even allow for integration of additional data such as imagery. What I’m saying is that their display on paper doesn’t make them non-interactive.
Other Thoughts…
Photo by MA7EO on Unsplash
When I first read about avoidance maps, my first thought was how great it would be if everyone shared their avoidance map publicly. What would we learn about urban spaces? Would we discover issues we didn’t know existed before and therefore deal with them?
On further reading, I realised that while mapping represents reality, it also affects how we construct this reality. Sparke called this the proleptic effect of mapping which he defines as: “the way maps contribute to the construction of spaces that later they seem only to represent.”
Making me pose the question: “If people in my (your) community publicly published their avoidance maps, would this affect the things and places I (you) avoid?” My answer is yes. I’d avoid things and places avoided by the majority—a case of a map affecting the reality it represents. What would this mean for urban spaces?
What does your avoidance map look like? Where would you place it in the cartography cube and would you be for or against publicising avoidance maps?
References
- Isn’t That Spatial podcast episode on Belonging (and Avoidance)
- Urban Omnibus/Architectural League article on the Perfect City Working Group’s Avoidance Mapping project
- Book by Alan M. MacEachren and D.R. Fraser Taylor: Visualization in modern cartography: Setting the Agenda
- The Role of Maps in Virtual Research Methods accessed via Google Scholar
- Journal article by Mathew Sparke: A Map that Roared and an Original Atlas: Canada, Cartography, and the Narration of Nation
This article has also been posted on Geohub blog.