
Handling and processing big data is awesome but always questions the physical system capacity, dataset processing software, memory availability, efficient algorithm, processing time and so. If any of these go wrong Oh! dear, you are in trouble with big data.
Among geo-people, its very common, dealing with satellite/raster/gridded data. Now-a-days most of freely available huge datasets comes in grid format and if it’s an spatio-temporal data set Oh! boy it could be TB of data with thousands millions of records and thats a real nightmare. For an instance, GRidded Information in Binary (GRIB) data; basically weather data dateset, very useful for any sort of research involving temperature, humidity, precipitation and so. You can get the daily data for free in 0.5×0.5 degree spatial resolution, for whole world. So, now you know where to get huge amount of free data but question is how to process this data mass?
To make the long story short, lets pick a question to answer, “how can we create a weekly long term average (LTA) from 20 years of daily data? And what we need to make the processing efficient?” – simeplest way would be using shell script and make use of gdal library. Following is some steps and directions:
first to download the daily dataset using grib api (and …maybe with little bit of shell script for naming and organizing the data for more convenience) for the time period and perimeter we are interested in. then create a grid using gdal_grid function and make geoTIFF or any other format you are interested in (we also can do point wise calculation and grid it at the end)
for convenience we can define three directories src_path (where the geoTIFFs are), stage_dir (this is staging area where the intermediate processing file will be kept) and dest_path (where we want to find output). Besides bash script here I have used some gdal functions like that gdal_calc.py, gdalinfo and gdal_translate etc. details are discussed bellow:
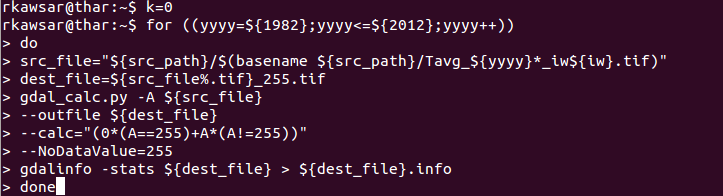
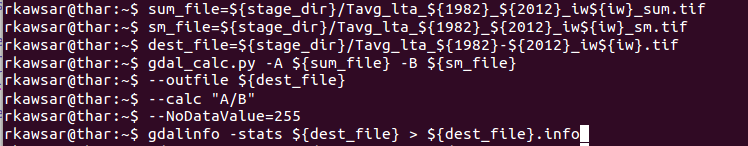
# its always a question while processing raster datasets how to deal with no data pixels. here’s a solution how to assigning 255 as NoDataValue to different unwanted pixels:
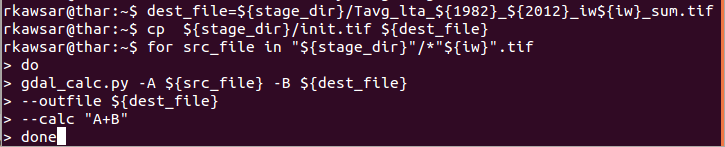
 # To create a long term Temperature average its necessary to summarize the weekly Tavg images. we do that here:
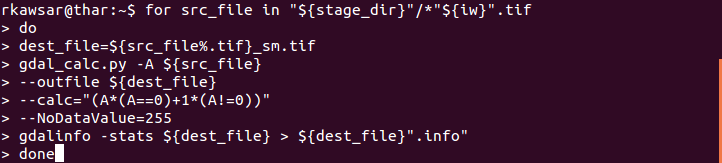
 # after we have created the summarized image its necessary to create status bitmap image (SM) with 0 for unusable and 1 for usable pixel values; using this SM image we can exclude the unwanted pixels from the LTA estimation:
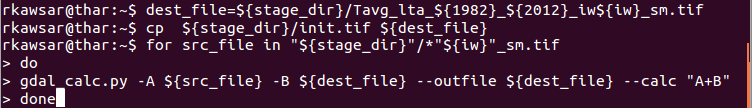
 # Now we have to summarize the status bitmap (SM) images:
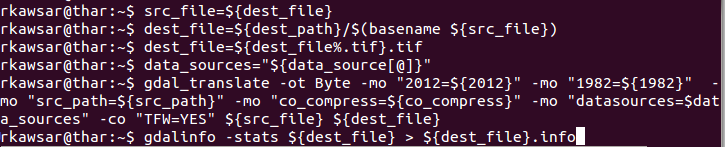
# finally we use the summarized Tavg image and SM image and create the long term image average (LTA) and save it in destination folder:
Here the scripting ends. now you can use these scripts and use some global variables like International Week (iw) and put it in a loop. Run the script than go to party and sleep tension free 🙂 . hopefully in next days you will get tons of data processed and stored in the destination folder.
Did you like this article? Read more and subscribe to our monthly newsletter!


#


Next article

Satellite images are a meaningful source of information for disaster mapping as recently revealed by the example of Haiyan typhoon in the Philippines. They provide a quickly available interpretation on a disaster impacted place and its surroundings that would otherwise be difficult to obtain. The images at the bottom depict the most afflicted typhoon area of Tacloban City and its hinterland in Leyte Province. They were taken by NASA’s ASTER sensor at a height of 700km above the Earth on November 15 this year (upper image) and on April 03, 2004 (bottom image). The images are false coloured (not in RGB format as pictures) in order to discriminate vegetation as red shiny surfaces from built up areas that appear as silver-white (urbanized areas) to tan coloured areas in case of bare soil. Though being from the same location the images differ significantly. The reasons might be changes of land cover and land use within the 9 year time span, but NASA scientists argue that most of those alternations are due to the strong typhoon.
A strong difference in interpretation comes from the vegetation especially toward the interior that appears cherry red in 2004 and almost beige after the typhoon. Since the tropical vegetation is not exposed to seasonal change the pale colour in 2013 was caused by the strong winds of the typhoon uprooting and stripping trees and bushes.
The built up areas in 2013 seem to be sprawled compared to 2004, which could point to intensive urban growth. However, scientists believe that the rise of silver-brown coloured areas was rather caused by the debris that was produced and blown around during the typhoon than by dramatic urban growth. They build their theory on the street grid that is clearly visible in the 2004 image and appears blurred after the storm. Also, the composition of red and brown colours along offshore areas altered to tanned tones due to aggregated mud.
Those examples point out the difficulty of extracting exact information from satellite images and the risk of misinterpretation. I think that knowledge, experience and information on the location are important features to retrieve the value of satellite imagery.
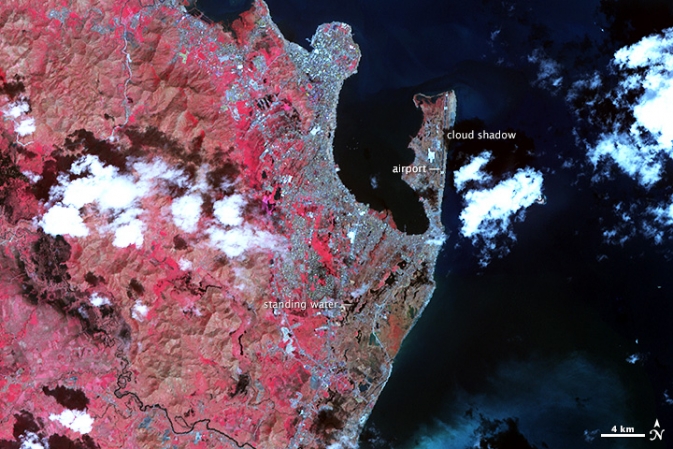
Tacloban City, 15 Nov 2013, ASTER sensor (Terra).
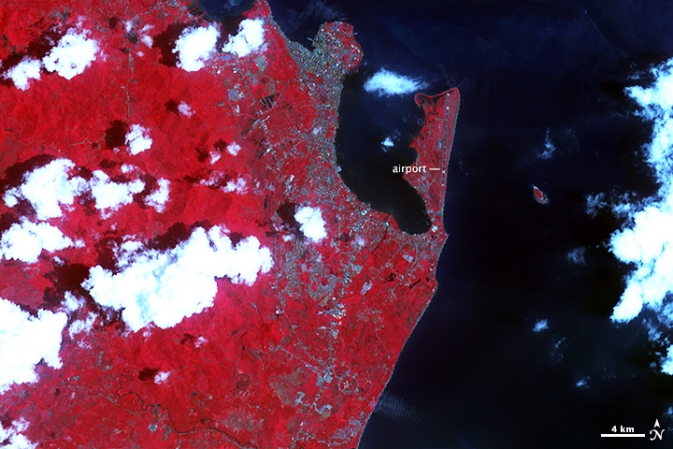
Tacloban City, 03 Apr 2004, ASTER sensor (Terra).
Source: Mashable
Did you like this post on image interpretation? Read more and subscribe to our monthly newsletter!