
The $5T global farming industry still relies on the observations of human scouts to determine crop conditions. This labor-intensive and error-prone method contributes to >50% over-application of costly and environmentally harmful inputs, missed indicators of emergent conditions that suppress yields, and a limited ability to forecast crop performance or optimize farming practices.
SlantRange solves the agricultural information problem with its patented technologies in low-altitude remote sensing and edge analytics; enabling more efficient, automated, and environmentally responsible farming through targeted crop measurement and data delivery.
We interviewed Matt Barre, Director of Strategic Development at SlantRange to learn more about their vision, their business and what makes them a successful remote sensing startup. Enjoy reading the interview 🙂
- Matt, SlantRange founder’s all have prior experience working in the defense sector building sensors for a totally different kind of drone. What made them take the leap of faith into entrepreneurship and start SlantRange?
Our two co-founders, Mike Ritter and Mike Milton, as well as myself and several other colleagues here at SlantRange, had been working together at General Atomics for almost a decade designing, testing, and deploying a variety of remote sensing and advanced analytics solutions for the Predator family of unmanned systems in defense applications. This included hyperspectral, multispectral, thermal, LIDAR, active/passive imaging systems as well as all of the data processing and visualization tools required to support these sensors.
About 6 years ago, Ritter and Milton saw the increasing trend of using drones for commercial applications as an excellent opportunity to apply their expertise in remote sensing and analytics to address a new market. While there were several verticals to explore, agriculture represented a massive market opportunity where this new technology could bring valuable new information and new levels of efficiency to tasks that were currently being conducted with manual labor.
They quickly developed a few prototypes and began testing them with a small network of corn and soybean growers in Nebraska. Those growers were immediately impressed, became the initial investors, and SlantRange was born.
- SlantRange’s main product is your multispectral sensor (backed by your suite of remote sensing analytics products). Multispectral sensors aren’t something new though. How is the SlantRange sensor different and better?
Indeed, multispectral sensing has been used in agriculture for quite some time, primarily from satellites. The various biochemical characteristics of plants that can be inferred from spectral signatures and indices are very well established. However, relatively recent advancements in camera technology have enabled these sensors to be small enough, light enough, and cheap enough to be practical for use on small low-altitude drones.
At SlantRange, we are strongly committed to the accuracy of our sensors as the value of the data products we produce are of course completely dependent on the accuracy of the raw data from our sensors. One example is our radiometric calibration, the process we use to normalize our measurements under changing sunlight conditions. Our sensors measure the amount of light that is reflected by a plant in multiple narrow spectral bands to derive various metrics about the health of the plant. But in order to do this accurately, we need to know the intensity and spectral content of the incident sunlight. We achieve this with our Ambient Illumination Sensor (AIS), which is mounted on top of the aircraft and measures the sunlight characteristics in real-time during the flight. These measurements are used to calibrate the reflectance measurements from the crop, producing completely normalized measurements that can be compared over time.
As an example, if you collect a map of a field without this sunlight calibration technique and then collect another map a week later and the crop looks different, you don’t know if the crop health has actually changed or if the differences are just due to different sunlight conditions. With our calibration technique, all of the measurements are on a normalized scale and can be accurately compared over time, allowing our customers to conduct more advanced analysis, such as evaluating trends, forecasting, etc.
We now have 3 issued patents on this calibration technique and we consider it a foundational technology for airborne imaging and analytics in agriculture.
- At a time when every single company out there is trying to get their application running on the cloud, SlantViewTM – your analytics platform is something that doesn’t even need the internet to work. Why is that?
Aerial imaging systems generate large volumes of data very quickly. Even when a high-speed internet connection is available, it can take quite a long time to upload the imagery for processing in the cloud. And within the agriculture sector, you simply can’t rely on the availability of an internet connection at all. So very early on, we decided to pursue an edge-compute architecture for our solutions. This includes some pre-processing that is completed on the sensor itself (each of our sensors include a Qualcomm Snapdragon processor) with the balance of the analytics completed in SlantViewTM, running completely offline on a laptop or tablet.
This edge-compute processing model has been at the core of our analytics engine since the beginning has been a big contributor to our market traction across the globe. We’re now operating in over 45 countries, including many locations that don’t have access to high-speed internet connections.
However, it’s important to note that we certainly appreciate the value and power of cloud-based analytics when a connection is available. We have integrated with several cloud-based farm management platforms that allow users to aggregate our data with other farm data such as soil data, weather data, and satellite data to establish more comprehensive insights about their operations.
We have also partnered with Microsoft to integrate their Azure IoT Edge services into our platform to seamlessly ingest, manage, and analyze data from large networks of distributed sensors. Custom analytics, as well as automated machine learning and artificial intelligence algorithms, can be deployed both in the cloud and at the edge with this new architecture.
- SlantRange has been working quite closely with DJI and recently you launched the 3PX sensor that is specifically meant for DJI drones. Could tell us more about the sensor and your partnership with DJI.
We announced our partnership with DJI in March of 2018 with the launch of our 3PX sensor. DJI approached us several months earlier to be a launch partner for their Payload SDK, which allows 3rd party payloads to integrate seamlessly with the DJI Matrice 200 Series drones, their workhorse platform for enterprise applications. The 3PX uses the DJI SKYPORT, a custom mounting interface, to mount directly to the drone just like any other DJI camera. The interface also provides power to the 3PX, eliminating the need for any external power cables or batteries to power the sensor. And most importantly, the interface includes a real-time data connection between the 3PX sensor and the operator on the ground, using the existing data link between the drone and controller.
You can learn more about the 3PX and our partnership with DJI in this webinar.
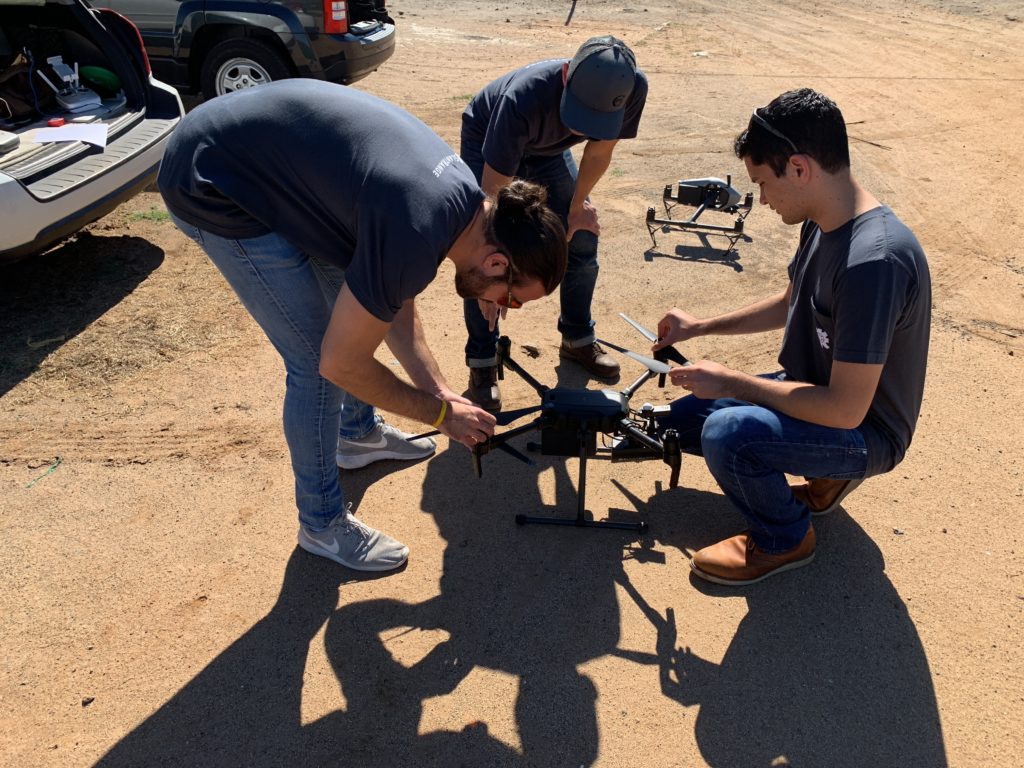
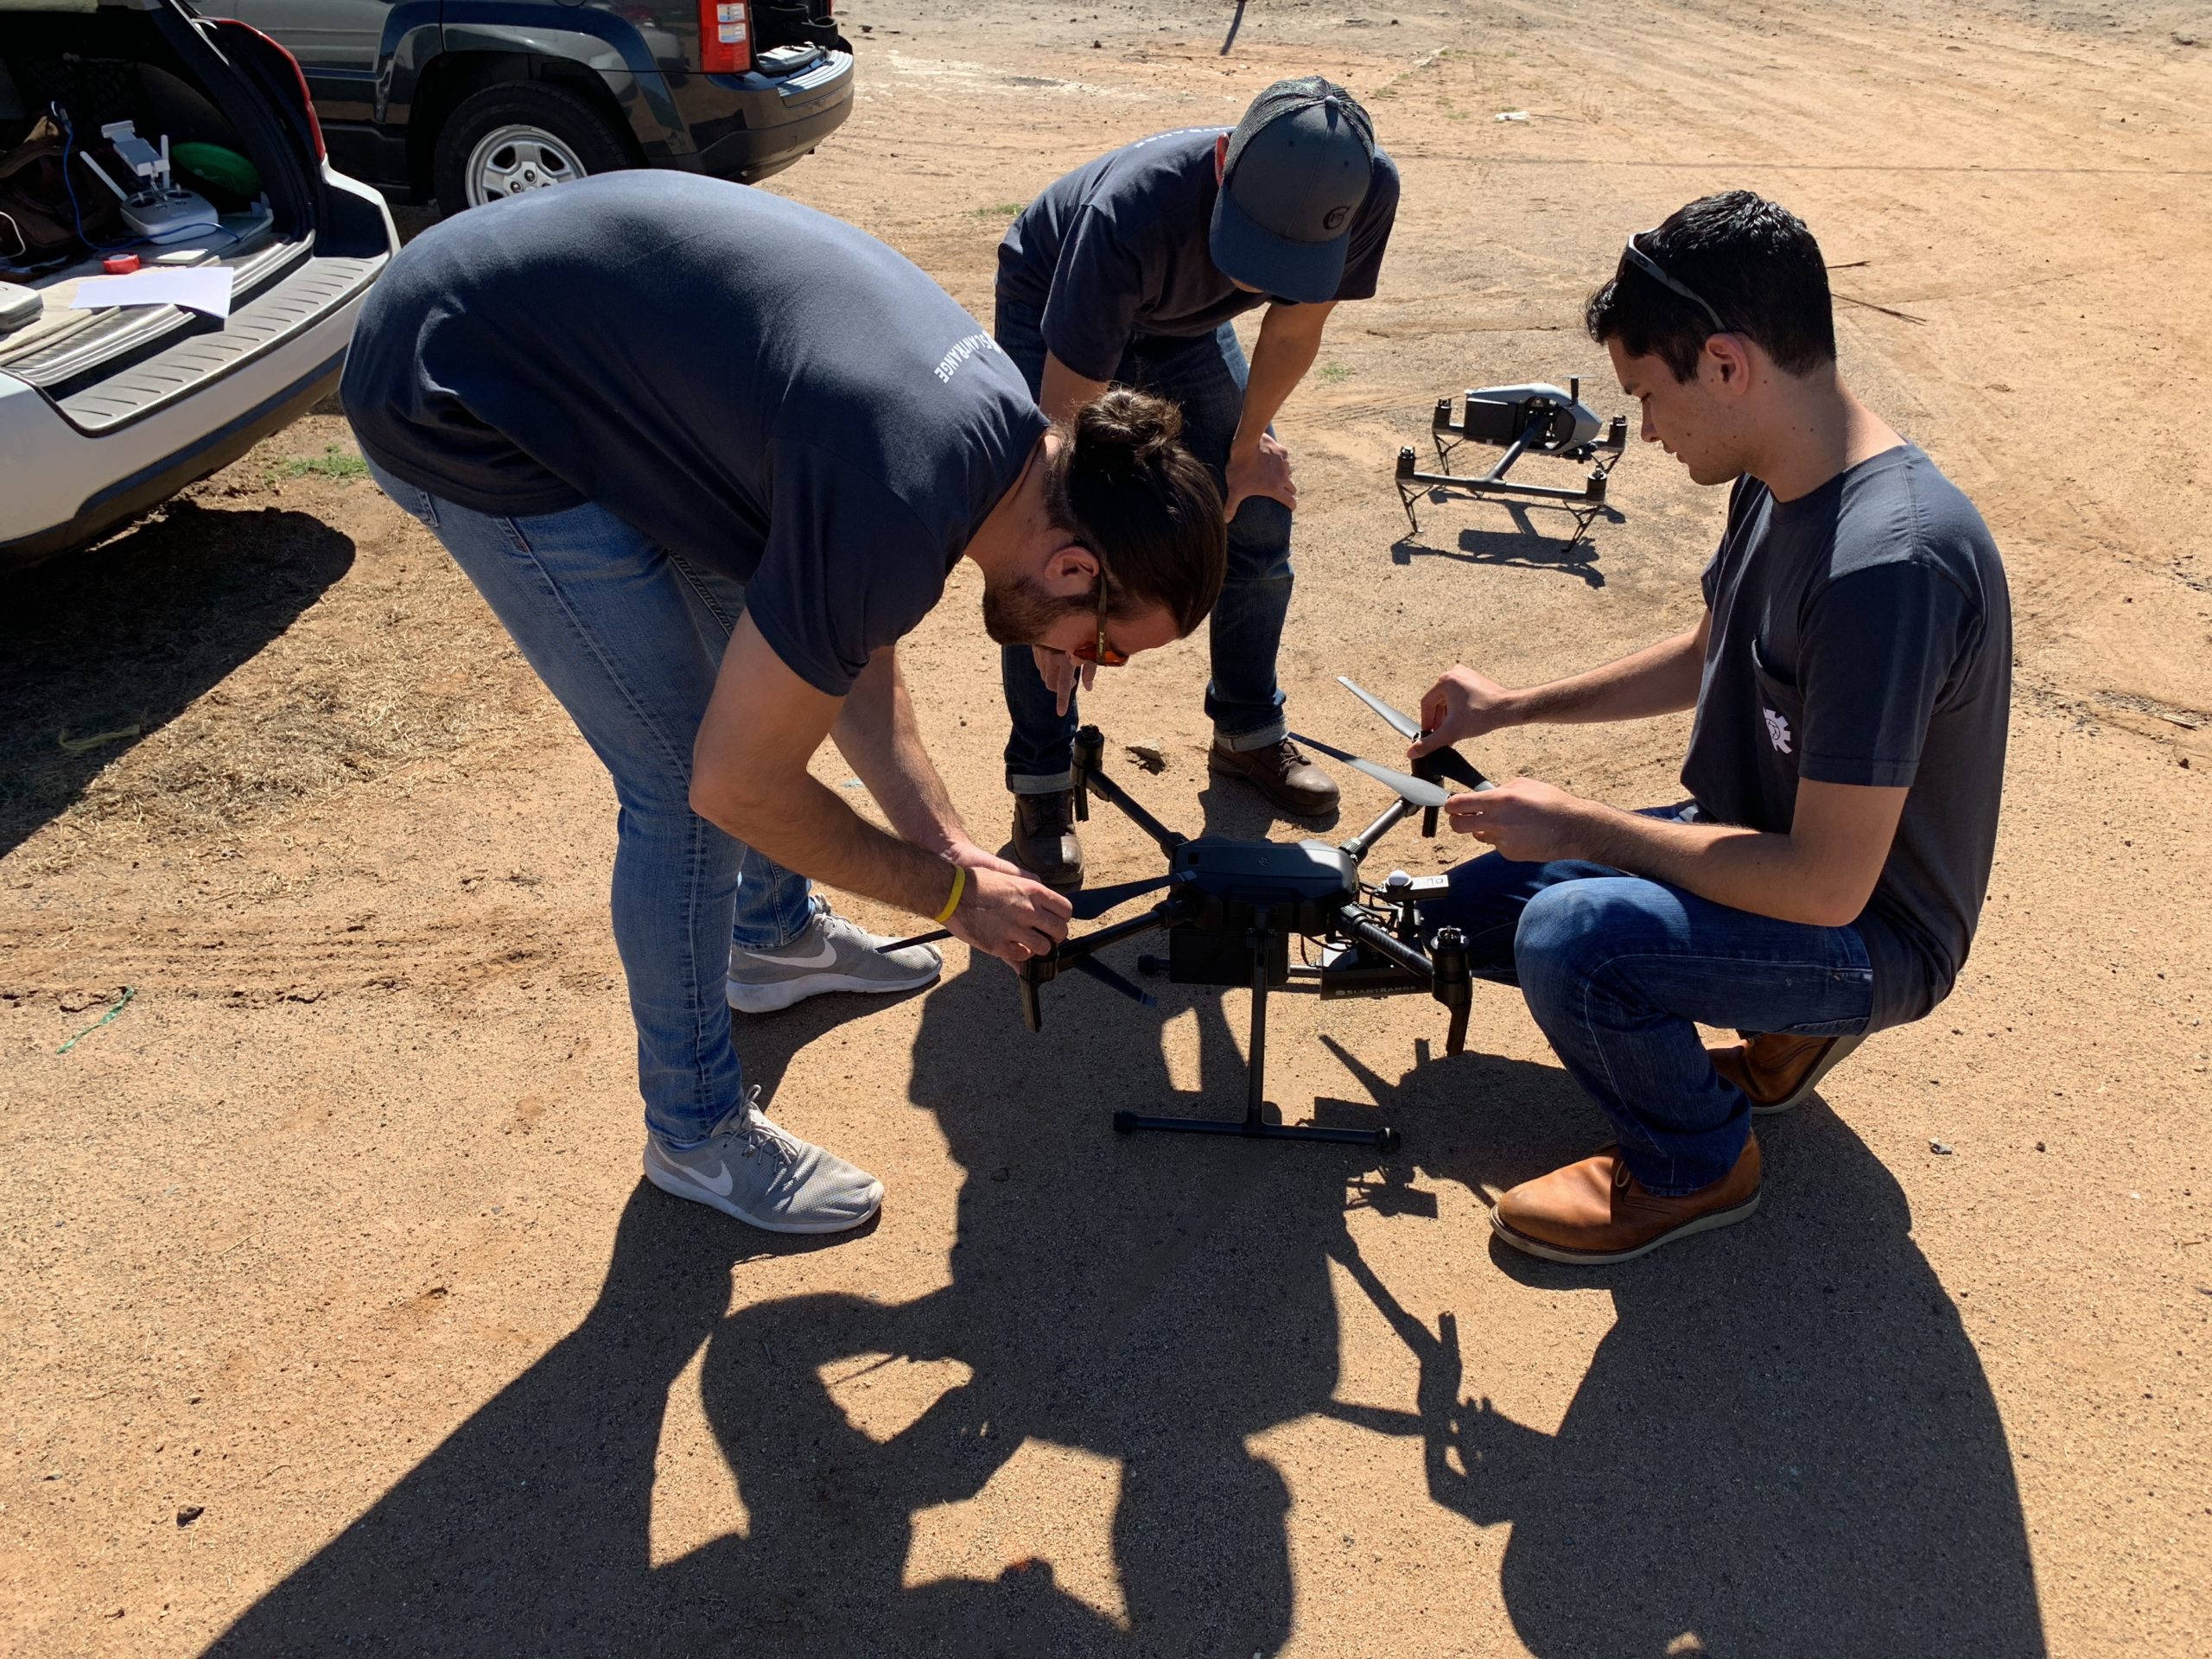
- As a company that counts farmers among your (angel) investors, I’d guess that convincing farmers of the benefits of remote sensing was the easy part. What has been your biggest engineering challenge in building sensors for drones?
Our biggest engineering challenges typically arise from the conscious decision we made very early on to not be involved with the drone hardware itself. Our expertise is in remote sensing and analytics so we chose to focus our efforts in these areas. However, this leaves us very dependent on the other hardware and software vendors in the drone ecosystem. Our users have a wide variety of applications and use cases so we’re often challenged to ensure that our systems are compatible with as many platforms as possible. We achieved this by pursuing a self-contained architecture for our sensors, which include their own navigation system, data storage system, data triggering system, and several other features that allow them to operate completely independently from the drones that carry them.
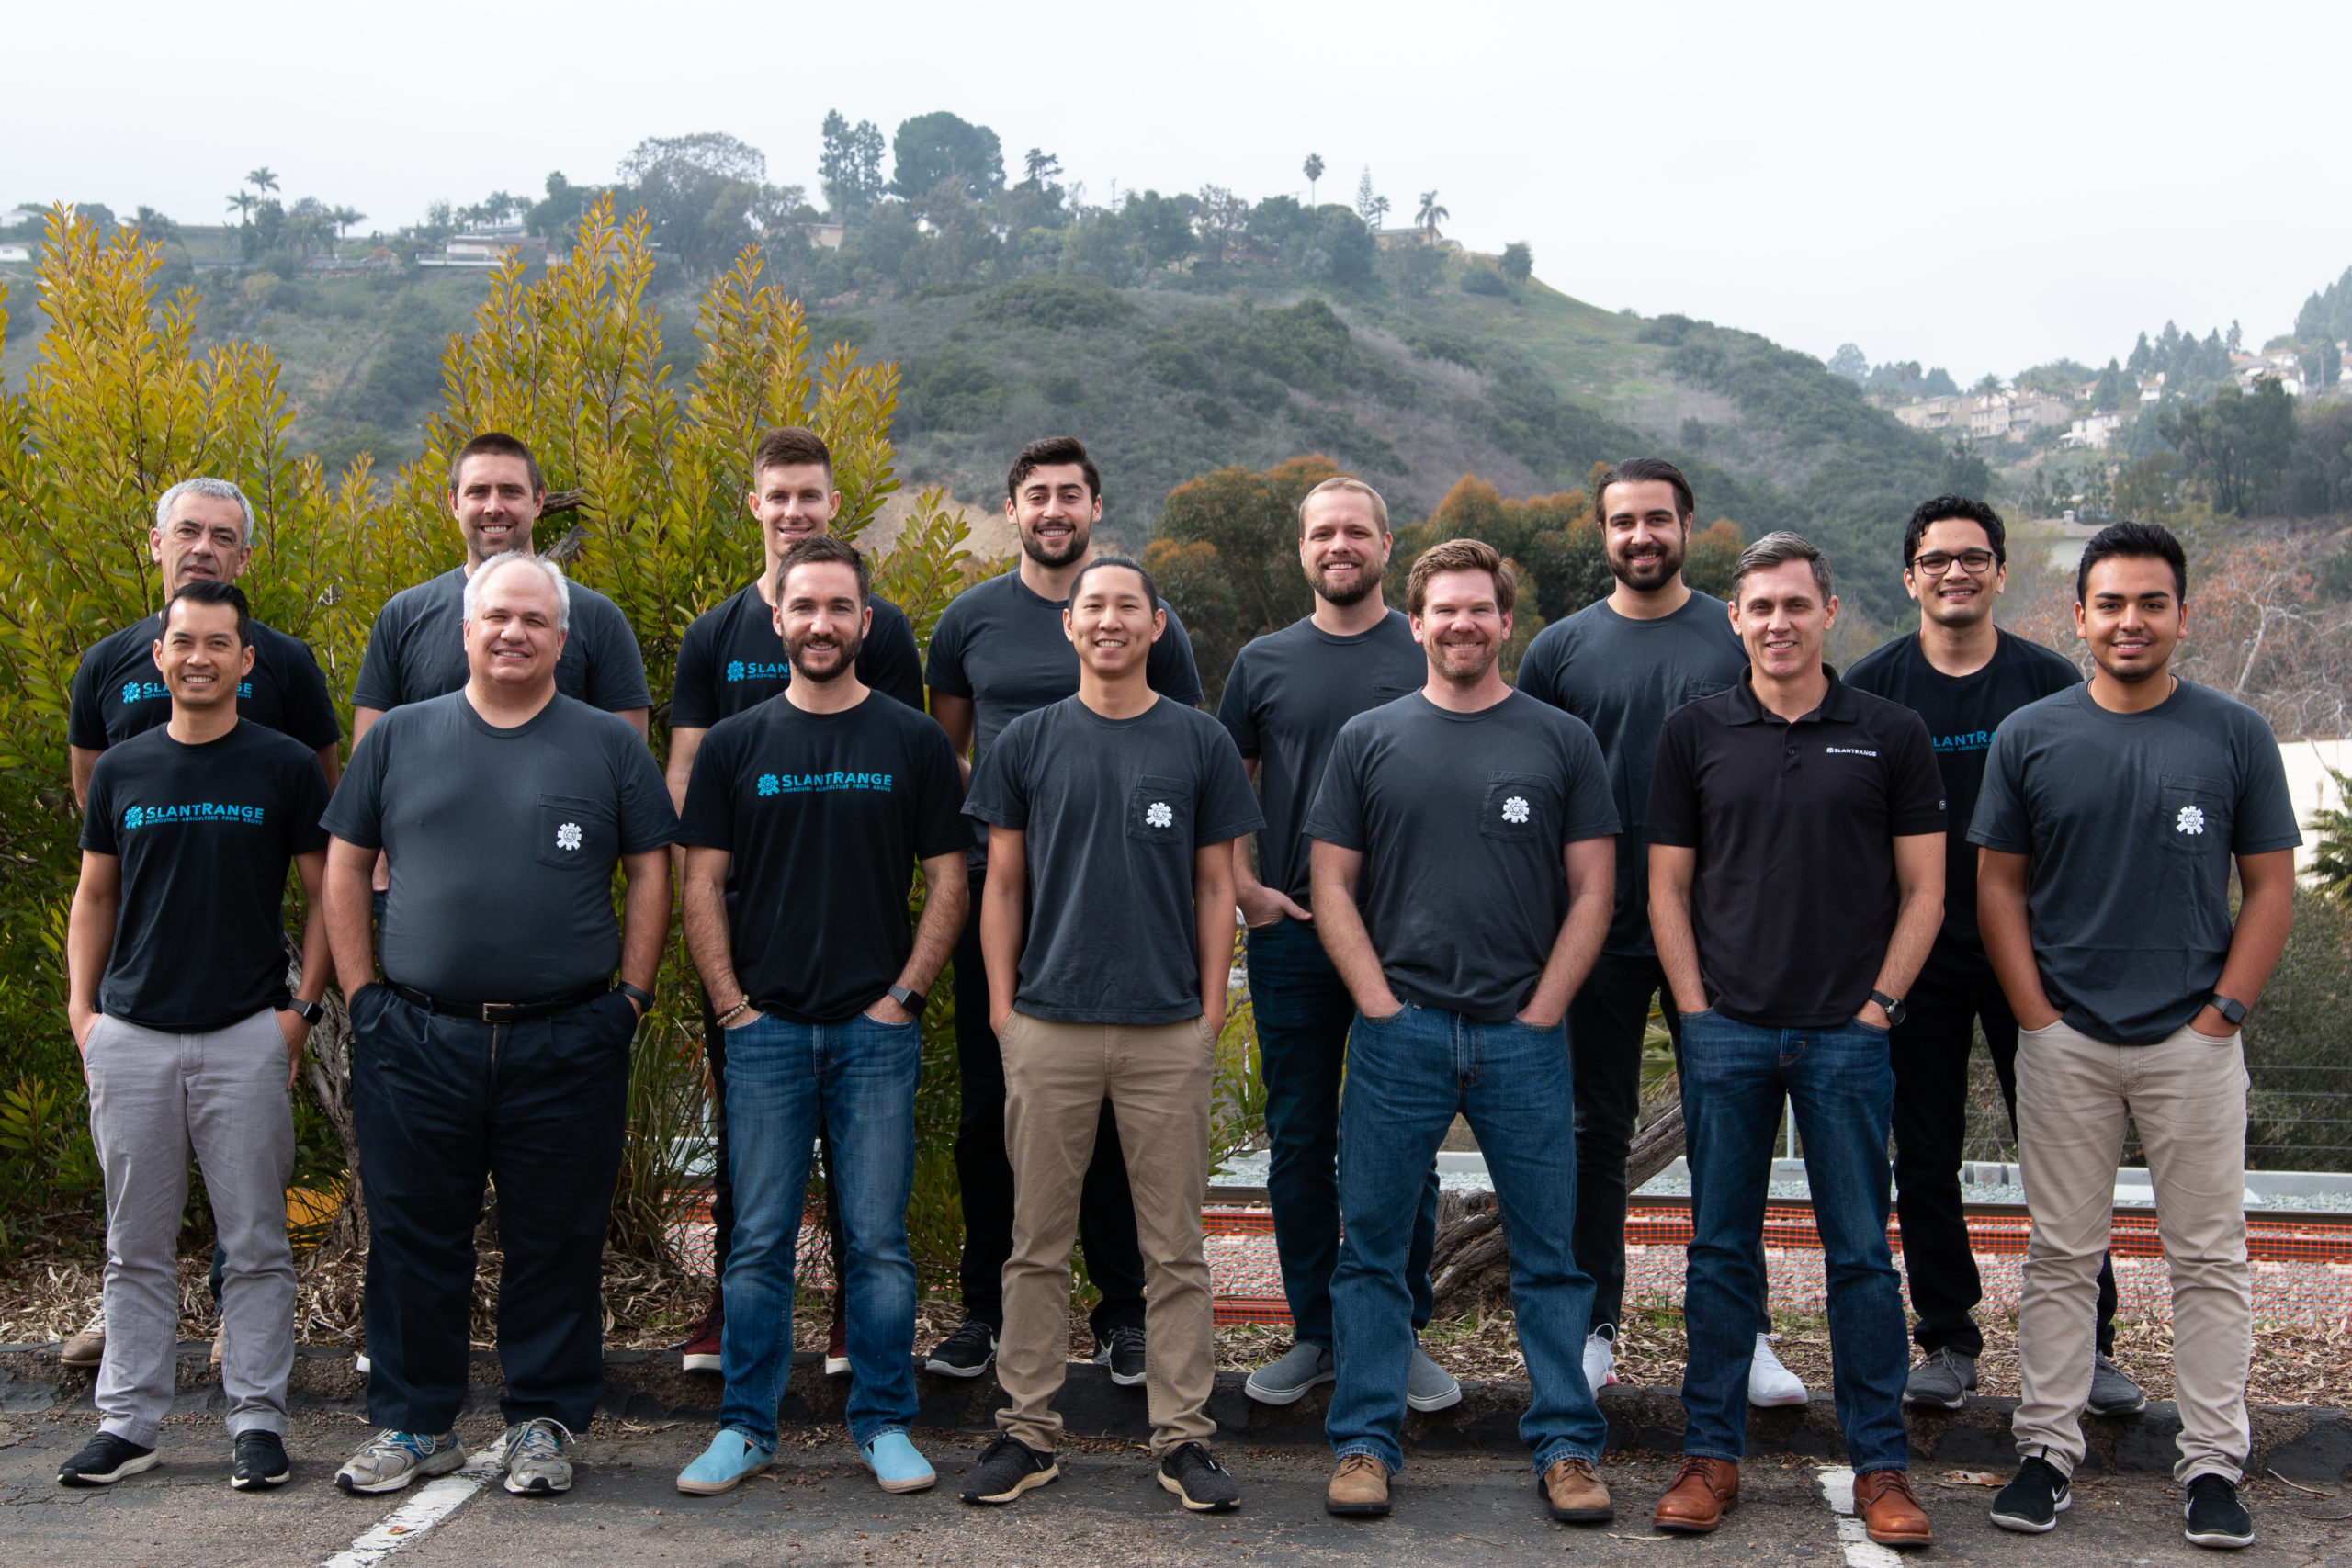
SlantRange Team Photo
In terms of integration, we’ve developed simple and robust mounting kits for many of the most popular drones and our partnership with DJI resulted in a tightly integrated solution for their DJI Matrice 200 Series of drones.
We have also pursued several custom integrations with the flight planning apps used to autonomously fly the drones used with our sensors. This includes configuration of the flight planner based on our sensor parameters as well as the automatic detection, configuration, and real-time feedback included with the 3PX sensor.
- Collecting quality remote sensing data isn’t an easy task. How do you ensure that farmers who are flying their drones equipped with SlantRange sensors aren’t doing something wrong? How do you let them know that something isn’t correct before they spend a few hours collecting the data only to find out the data isn’t useful?
As a starting point, we provide a full onboarding process to each of our customers to ensure they are familiar with the hardware setup as well as the data collection and data processing workflows. We also offer a more in-depth training course for those who prefer more personalized instruction, which also includes a detailed introduction to our suite of analytics.
We’ve always provided some quick-look tools in our software that allow our customers to evaluate the area coverage of a flight and to check for any gaps immediately after a data collection. We’re also implementing some new features that analyze the image content for quality metrics such as exposure and focus. However, these are all tools that are used after a flight has been completed.
Our 3PX sensor provides real-time feedback to the user to ensure they’re collecting high quality data. These real-time metrics include the status of the sensor’s navigation system, the status of the data storage system and, most importantly, measurements from the AIS. If lighting conditions drop too low for quality data, the user will be notified immediately, allowing them to make the decision to abort the mission if they choose. All of this information is transmitted using DJI’s Payload SDK and is displayed in real-time on the same mobile device used to operate the drone.
- You also recently announced an additional service that is frankly quite interesting – “Aerial Phenotyping”. What is that all about? Could you tell us more!
Over the past several years, we’ve seen increasing interest in using our sensors and analytics for very specific applications within the agriculture research community. Much of the in-field research is conducted using test plots, which are arrays of small plots, typically a few rows of plants wide and only several meters long, that are laid out in a grid pattern across a test site. Each of the plots may contain a different seed hybrid, treatment program, or both, with the intent to evaluate the performance of the crop across a season.
Phenotyping involves the measurement of the various metrics about the crop to support the goals of the trial. This has traditionally been a manual process and can be very time-consuming, expensive, and prone to error. We saw an opportunity to customize our data collection and processing workflows to provide this data from an aerial platform in an automated and repeatable way. This included some enhancements to our navigations system, including the integration of RTK GPS, as well as some customization of our analytics to accurately assign the contributions of each image to the appropriate plots within the trial.
This led to the launch of our Aerial Phenotyping services. The service includes the collection of the imagery over the trial, typically multiple times over the course of a season, and the tabulated results are delivered to the customer for each and every plot within the trial, including metrics such as plant counts, plant size distributions, chlorophyll index, vegetation fraction, NDVI, stress values, yield potential, and other custom analytics based on the needs of the customer. This provides a turnkey solution for our customers who can focus on the results and their research rather than the process of collecting and processing the data itself. We are now going into our 3rd season of the service and are proud to support the research of companies such as Bayer, BASF, Land O’Lakes, Syngenta, and AgReliant.
- As a key player in a successful startup, I am sure that there are many things that you must have learnt along the way. What was the most interesting feedback that you received so far?
One of our advisors once told us to do things that don’t scale in order to learn how to scale. While it seems a bit counter-intuitive, it actually makes a lot of sense. His point was that you sometimes have to be hyper-focused on a particular customer segment, or even a specific customer, to learn what it takes to delight your broader customer base. This may involve some completely unscalable approaches or methods but from that process you can begin to establish more scalable ways to achieve the same outcome.
As an example, we learned early on that the range of data needs and use cases across all of our customers is immense. We often had customers asking us to develop customized algorithms to detect the particular crop conditions they cared about. One of our customers in Southern California wanted us to develop an algorithm to detect dodder, a parasitic weed that was causing significant damage in their alfalfa fields. Through the process of developing the algorithm, which was very specific to that weed and not scalable to other crops, we developed and launched our Smart DetectionTM tool. This feature allows a user to draw a region of interest around an anomaly on one of their maps and the software uses the spectral signature from that region to find occurrences of the same feature across the entire field. Our customers have successfully used this tool to identify weeds, irrigation leaks, and lodged plants, and the applications continue to expand every day.
- More often than not it takes a while to find a business model that works for you and your clients. Have you cracked that code already?
While our business model may evolve as we continue to grow, our current model is serving us quite well. Our business is currently divided into two parts. First, we sell our sensors and subscriptions to our SlantViewTM software to growers, agronomists, drone service providers, and drone system integrators. Second, we provide data analytics services on a contract basis, which includes our Aerial Phenotyping service. The analytics we develop through our data services will typically flow into our commercial SlantViewTM software to expand and enhance the capabilities of that business unit.
- You are based in San Diego, how’s the startup scene? Are there many investors specifically looking at Ag-tech companies? Are there any local meetups/events that cater to the geo community?
The startup scene in San Diego is definitely thriving and continues to expand. It’s establishing itself as a desirable alternative to Silicon Valley for both investors, new companies, and talent. It’s definitely expanding beyond its history of biotech and defense with many new startups in both Agtech as well as B2B SaaS services.
San Diego is also well-known for its expertise in remote sensing, robotics, and unmanned systems, partially due to the concentration of defense technology companies and earth sciences research. While I don’t know of any specific geo events, there are certainly events focused on robotics and unmanned systems, which include the automation and navigation aspects of those systems.
- Okay, this is a tricky one – on a scale of 1 to 10 (10 being the highest), how geoawesome do you feel today?
We’re developing a new RTK navigation system to support our more advanced analytics and we’re seeing great results so I’ll say I’m feeling a solid 9 on the geoawesome scale; I’ll give it a 10 when it launches!
- Any closing remarks for anyone looking to start their own geo startup?
If anyone would like to reach you, what would be the best way to do so?
One piece of advice I can offer, which has been shared many times before, if you’re not completely embarrassed by your first product launch, you waited too long!
You can reach us any time at info@slantrange.com. We also have some great content on our blog, YouTube channel, Facebook page, and Twitter feed.
Thanks so much!
The Next Geo is supported by Geovation:
![]()
 Location is everywhere, and our mission is to expand its use in the UK’s innovation community. So we’re here to help you along your journey to success. Get on board and let’s start with your idea…
Learn more about Geovation and how they can help turn your idea into reality at geovation.uk
About The Next Geo
The Next Geo is all about discovering the people and companies that are changing the geospatial industry – unearthing their stories, discovering their products, understanding their business models and celebrating their success! You can read more about the series and the vision behind it here.
We know it takes a village, and so we are thrilled to have your feedback, suggestions, and any leads you think should be featured on The Next Geo! Share with us, and we’ll share it with the world! You can reach us at muthu@geoawesomeness.com or via social media 🙂
If you enjoyed this article about digital framing, read more and subscribe to our monthly newsletter!


#


Next article
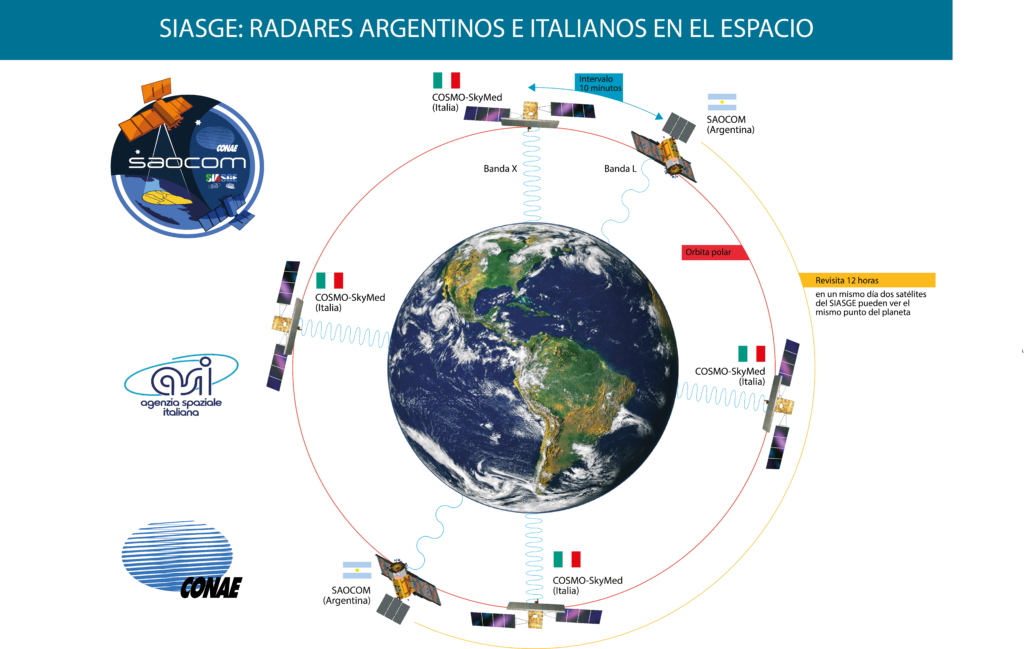

SIASGE (Sistema Italo Argentino de Satélites para la Gestión de Emergencias) stands for Italian-Argentine Satellite System for Emergency Management. It represents a joint programme of the Italian Space Agency (Agenzia Spaziale Italiana – ASI) and the Argentine Space Agency (Comision Nacional de Actividades Espaciales – CONAE) with the scope to integrate the national radar missions of both countries and to cooperatively exploit the data. The mentioned national missions are the Italian COSMO-SkyMed and the Argentine SAOCOM missions. Both missions constitute SAR constellations with COSMO-SkyMed operating 4 satellites in X-band and SAOCOM with two satellites in L-band. The visionary idea of a joint mission already dates back to 20 years ago and was initiated by the former ASI President Sergio De Julio and the Director of CONAE Conrado Varotto. The synergy between the two constellations will create new applications based on the joint employment of the two radar technologies.
The satellites
COSMO-SkyMed constitutes an already established radar satellite constellation with four satellites orbiting in space since 2010. A second generation of satellites is planned to be launched in 2019/2020. The Argentine SAOCOM mission is a new constellation consisting of two satellites. SAOCOM-1A, the first of two identical satellites of the constellation, was launched on 8 October 2018 and finally reached its sun-synchroneous orbit at around 620km altitude. SAOCOM-1B, its twin satellite, is planned to join the same orbit in 2019. The Argentine company INVAP is the prime contractor for the design and construction of the SAOCOM-1 spacecrafts and their SAR payload. However, the satellites are developed in partnership with Belgium and Italy.
Apart from a thermal infrared camera, the SAOCOM-1A satellite carries an L-band polarimetric SAR instrument (~23cm wave length) with the objectives to:
- provide all weather, day/night polarimetric L-band SAR observations
- generate soil moisture maps particularly for the Argentine Pampas and lowland regions every 6 days covering an area of around 83 Mio hectars for giving support to agricultural and hydrological applications
- provide support to agricultural producers in the decision-making process related to planting, fertilization and irrigation, in crops such as soybean, corn, wheat and sunflower, for example, to optimize the use of fertilizers
- provide support to agricultural producers in relation to the use of agrochemicals (fumigation) for the control of diseases in crops, in particular for the fusariosis of the ear of wheat
- develop SAR interferometric techniques for collaborating with the development of different applications.
- collect data that is useful in emergencies, such as floods, droughts, desertification, landslides, oil slicks in land and ocean, fires, seismology, earthquake activity and volcanism
Depending on the swath and polarization mode the SAOCOM-1A satellite records with a horizontal resolution of 10 – 100m covering a swath width of 30km – 350km at an incident angle from 20 – 50° (for technical details consult https://directory.eoportal.org/web/eoportal/satellite-missions/s/saocom, ). Once the constellation is complete, SAOCOM will deliver 500 images daily orbiting the Earth 15 times a day.
The spacecraft operation is accomplished by the CONAE Control Center at Cordoba, Argentina with the support of ESA’s expert teams at ESOC in Darmstadt. All data processing, archiving and distribution is being provided by the MOC (Mission Operations Center) facility at Cordoba. The Cordoba (Argentina) and Matera ground station of ASI, Italy will be available for L-band SAR imagery downlinks.
Whats the advantage of SIASGE
The main difference between the SAECOM and COSMO-SkyMed missions is the wavelength of their sensors: The X-band of COSMO-SkyMed satellites has a wave length of around 3cm, while the L-band sensor of SAECOM satellites records at a wavelength of approximately 23cm. The different backscattering properties of the X-band and L-band translate into different kinds of information registered by the sensors. As a very general statement radar waves are backscattered by objects that have at least the size of their wavelength (and dielectric properties). – This can be explained by the wave and particle shape theory of electromagnetic waves. Hence, an X-band radar wave requires an object of around 3cm to be reflected, while an L-band wave is only reflected by objects larger than 23cm. As a consequence the X-band is useful to detect small objects, whereas the L-band is beneficial to observe larger objects that would result unclear at a smaller wave length. Combining the two facilitates to monitor geometric large objects at a great detail. The exploitation of both band characteristics is one of the striking advantages of the mission. A second benefit is the very good temporal resolution with two coverages per day.
SIASGE consists of six satellite, four of them from the Italian COSMO-SkyMed constellation and two of them from the Argentinian SAOCOM constellation. The image shows the satellites belonging to the joint mission. Source: CONAE
EXAMPLES
Following examples should highlight the different backscattering properties of the X-band and L-band and its impact on the various applications:
Trees: The X-band is reflected by leaves of ~3cm size while the L-band is reflected by the great structures of the tree such as branches or the trunk. Both bands can be exploited together to give a full representation of a forested area.
Agriculture: Consider rice plants growing in a paddy. The young plants emerging from the water will give a backscatter in X-band, while the L-band will not detect any signal and is much less effective at this stage of growth. If the plant reaches a major growing stage, the X-band will not alter considerably as it is saturated. In contrast the L-band changes during the vegetation period and gives useful information about the growing stage and the health condition of a plant.
Surface backscattering: Due to its small wavelength, the X-band is sensitive to small surface roughness. Hence, the x-band signal reflected at a rough surface comes from the surface itself. The same surface is seen much flatter by the L-band, because of the larger wavelength. L-band shows objects very clearly due to the double bouncing of the signal over smooth surfaces.
Penetration characteristics: The penetration of microwaves in terrain is directly dependent on wavelength. X-band is backscattered at the soil surface (if it is not very dry sand), while the L-band has more signal/sensitivity to the volume content of terrain as for instance soil moisture. Also dry sand and snow are penetrated to a greater extent by L-band than by X-band.
Interferometry: Phase measurements in X-band provide a much higher accuracy than in L-band due to the shorter phase cycle corresponding to half the wavelength. The comparison of phase measurements between two satellite passes is possible only if the two phase signals considered are correlated (coherent). Time decorrelation of phase signal is a strong limit to interferometric analysis and is much stronger in X-band than in L-Band. Hence, X- and L-band interferometric applications are complementary in terms of the area of application: L-band interferometry is more robust and of wider application while X-Band provides more accurate results over selected areas.
Backscattering properties of X-band and L-band on a surface covered by grass. Source: e-geos
Backscattering properties of X-band and L-band on a farming machine showing double-bounce effects for both bands. Source: e-geos
Backscattering properties of X-band and L-band at tree object. The double-bounce effect of L-band is shown in the right panel. Source: e-geos
Penetration characteristics of X-band and L-band into soil. Source: e-geos