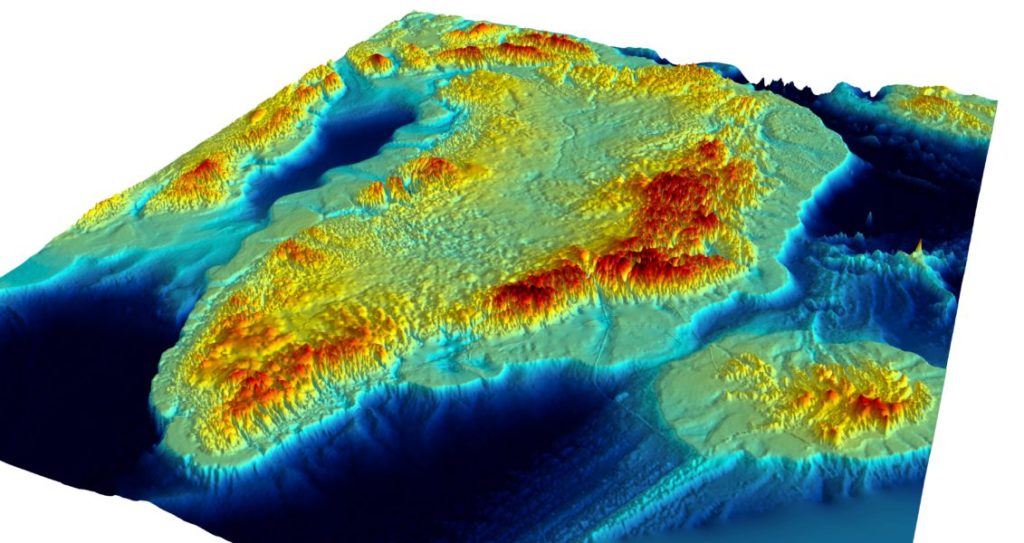


The colorful visualization you see above is what Greenland would look like if it were to lose its ice cover.
Produced by researchers at British Antarctic Survey (BAS), University of Bristol and, the University of California at Irvine, the stunning Greenland Basal Topography BedMachine v3 map has been compiled using varied data – satellite imagery, airborne and ground-based radar and seabed mapping data from research ships. This data has been collected over decades by more than 30 institutions.
In the map, you can see the highest peaks of the region in red. The lowest-lying areas are hued in green and the sea level is in blue color. What makes this 3D map particularly interesting is that it will allow scientists to make much more accurate calculations about the future sea-level rise. The shape of the territory’s bedrock and the adjoining seafloor are crucial indicators of how Greenland may respond to climate change in the future.
“It reveals that many glaciers that drain the Greenland ice sheet are thicker than previously estimated – up to 100 meters in places,” explains Glaciologist Prof Jonathan Bamber, University of Bristol.
So, basically, if all the ice in Greenland were to melt completely, the global sea-level rise would amount to 7.42 meters – 7 cm more from previous estimates.
Apart from exposing the thickness of ice in various places, the variations in the landscape also give scientists a bird’s eye view of the areas which are undergoing change more rapidly than others. “The glaciers have complex fjord geometries that will control how they react to changes from the effects of warmer ocean currents,” Bamber says.
Further, by revealing the new pathways through which Atlantic water can access glaciers with marine-based basins, the map has exposed those regions of Greenland that are most vulnerable to future oceanic forcing.
Greenland Basal Topography BedMachine v3 map has been produced at a horizontal spatial resolution of up to 150 meters. See it in all its glory in the video below:

#Ideas


Next article
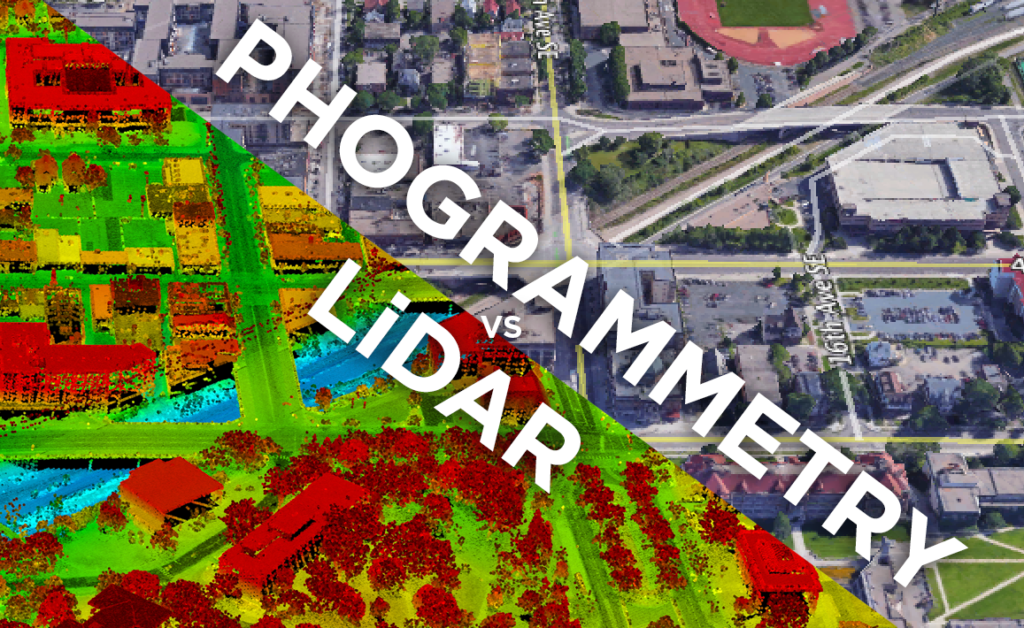
 With the recent development in the drone surveying space, there has been a lot of myths and misconceptions around UAV LiDAR and photogrammetry. In fact, these two technologies have as many differences as similarities. It is therefore essential to understand that they offer significantly different products, generate different deliverables and require different capture conditions but most importantly, they should be used for different use cases.
There are no doubts that compared to traditional land surveying methods, both technologies offer results much faster and with a much higher data density (both techniques measure all visible objects with no interpolation). However, the selection of the best technology for your project depends on the use case, environmental conditions, delivery terms, and budget, among other factors. This post aims to provide a detailed overview of the strengths and limitations of LiDAR and photogrammetry to help you choose the right solution for your project.
How do both technologies work?
Let’s start from the beginning and have a closer look at the science behind the two technologies.
LiDAR that stands for Light Detection and Ranging is a technology that is based on laser beams. It shoots outs laser and measures the time it takes for the light to return. It is so-called active sensor as it emits its energy source rather than detects energy emitted from objects on the ground.
Photogrammetry, on the other side is a passive technology, based on images that are transformed from 2D into 3D cartometric models. It uses the same principle that human eyes or 3D videos do, to establish a depth perception, allowing the user to view and measure objects in three dimensions. The limitation of photogrammetry is that it can only generate points based on what the camera sensor can detect illuminated by ambient light.
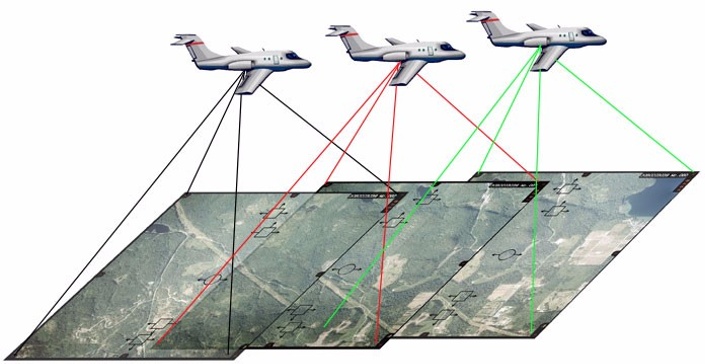
In a nutshell, LiDAR uses lasers to make measurements, while photogrammetry is based on captured images, that can be processed and combined to enable measurements.
Outputs of LiDAR and photogrammetry surveys
The main product of the LiDAR survey is a 3D point cloud. The density of the point cloud depends on the sensor characteristics (scan frequency and repetition rate), as well as the flight parameters. Assuming that the scanner is pulsing and oscillating at a fixed rate, the point cloud density depends on the flight altitude and speed of the aircraft.
Various use cases might require different point cloud parameters, e.g., for power line modeling you might want dense point cloud with over 100 points per square meter, while for creating Digital Terrain Model of a rural area 10 pts/m2 cloud be good enough.
It is also important to understand that the LiDAR sensor is only sampling positions without RGB, creating a monochrome dataset which can be challenging to interpret. To make it more meaningful, the data is often visualized using false-color based on reflectivity or elevation.

Example of point cloud before and after adding a color attribute. Courtesy of TerraSolid
It is possible to overlay color on the LiDAR data in post-processing based on images or other data sources; however this adds some complexity to the process. The color can also be added based on classification (classifying each point to a particular type/group of objects, e.g., trees, buildings, cars, ground, electric wires).
Photogrammetry, on the other hand, can generate full-color 3D and 2D models (in the various light spectrum) of the terrain that is easier to visualize and interpret than LiDAR. The main outputs of photogrammetric surveys are raw images, ortophotomaps, Digital Surface Models and 3D points clouds created from stitching and processing hundreds or thousands of images. The outputs are very visual with a pixel size (or Ground Sampling Distance) even below 1cm.
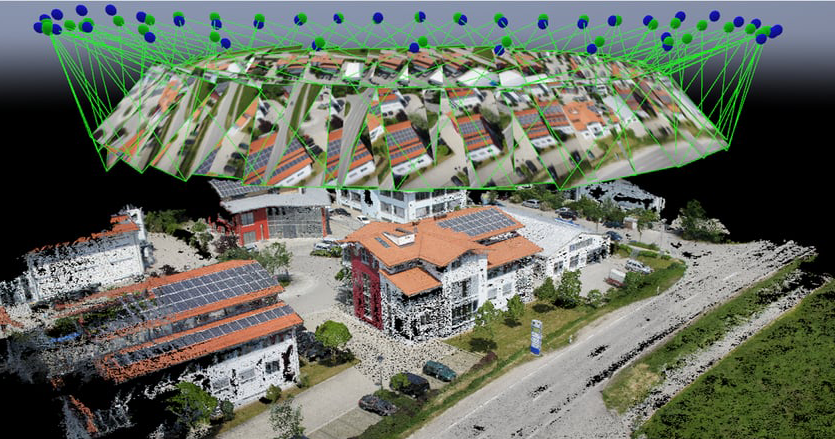
Aerotriangulated images and generated a 3D point cloud. Screen from Pix4D software.
With that in mind, photogrammetry seems to be the technology of choice for use cases where visual assessment is required (e.g., construction inspections, asset management, agriculture). LiDAR, on the other hand, has certain characteristics that make it important for particular use cases.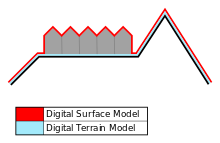
Laser beams as an active sensor technology can penetrate vegetation. LiDAR is able to get through gaps in the canopy and reach the terrain and objects below, so it can be useful for generating Digital Terrain Models.
LiDAR is also particularly useful for modelling narrow objects such as power lines or telecom towers as photogrammetry might not recognize narrow and poorly visible objects. Besides, LiDAR can work in poor lighting conditions and even at night. Photogrammetry points clouds are more visual (each pixel has RGB), but often with generalized details, so it might be appropriate for objects where a lower level of geometric detail is acceptable but visual interpretation is essential.
Accuracy
Let’s start with defining what the accuracy is. In surveying, accuracy always has two dimensions: relative and absolute. Relative accuracy is the measurement of how objects are positioned relative to each other. Absolute accuracy refers to the difference between the location of the objects and their true position on the Earth (this is why any survey can have a high relative but low absolute accuracy).
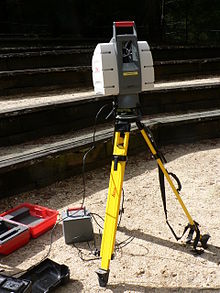
Example of Terrestrial LiDAR scanner
LiDAR is one of the most accurate surveying technologies. This is particularly the case for terrestrial lasers where the sensor is positioned on the ground, and its exact location is measured using geodetic methods. Such a setup allows achieving sub-centimeter level accuracies.
Achieving a high level of accuracy with aerial LiDAR is however much more difficult as the sensor is on the move. This is why the airborne LiDAR sensor is always coupled with IMU (inertial motion unit) and GNSS receiver, which provide information about the position, rotation, and motion of the scanning platform. All of these data are combined on the fly and allow achieving high relative accuracy (1-3cm) out of the box. Achieving high absolute accuracies requires adding 1-2 Ground Control Points (GCPs) and several checkpoints for verification purposes. In some cases, when additional GNSS positioning accuracy is needed, one can use advanced RTK/PPK UAV positioning systems.
Photogrammetry also allows achieving 1-3 cm level accuracies however, it requires significant experience to select appropriate hardware (e.g. Wingtra VTOL), flight parameters and process the data appropriately. Achieving high absolute accuracies requires using RTK/PPK technology and additional GCPs or can be based purely on a large number of GCPs. Nonetheless, using $500 DJI Phantom-class drone with several GCPs, you can easily achieve 5-10cm absolute accuracy for smaller survey areas, which might be good enough for most of the use cases.
Read more about photogrammetry accuracy in this detailed overview.
Data acquisition, processing, and efficiency
There are also significant differences in the acquisition speed between the two. In photogrammetry, one of the critical parameters required to process the data accurately is image overlap that should be at the level of 60-90% (front and side) depending on the terrain structure and hardware applied. The typical LiDAR survey requires only 20-30% overlap between flight lines, which makes the data acquisition operations much faster.
Additionally, for high absolute accuracy, photogrammetry requires more Ground Control Points to achieve LiDAR level accuracy. Measuring GCPs typically require traditional land surveying methods which mean additional time and cost.
Moreover, LiDAR data processing is very fast. Raw data require just a few minutes of calibration (5-30min) to generate the final product. In photogrammetry, data processing is the most time-consuming part of the overall process. In addition, it requires powerful computers that can handle operations on gigabytes of images. The processing takes on average between 5 to 10 times longer than the data acquisition in the field.
On the other hand, for many use cases such as power line inspections, LiDAR point clouds require additional classification which might be very labour-intensive and often needs expensive software (e.g., TerraScan).
Cost
When we look at the overall cost of LiDAR and photogrammetry surveys, there are multiple cost items to be considered. First of all, the hardware. UAV LiDAR sensor sets (scanner, IMU, and GNSS) cost between $50.000-$300.000, but for most use cases, the high-end devices are preferable. When you invest so much in a sensor, you don’t want to crash it accidentally. With that in mind, most users spend additional $25.000-$50.000 for the appropriate UAV platform. It all adds up to $350.000 for a single surveying set which is equivalent to 5x Telsa Model S. Quite pricey.
For photogrammetry, all you need is a camera-equipped drone, and these tend to be much cheaper. In the $2.000-$5.000 range, you can find a wide selection of professional multirotor devices such as DJI Inspire. For the price level of $5.000-$20.000 you can buy RTK/PPK enabled sets such us DJI Matrice 600 or fixed-wing devices Sensfly eBee and PrecisionHawk Lancaster.
Another cost item is processing software. In case of LiDAR, it is typically added for free by a sensor manufacturer. However, post-processing, e.g. point cloud classification might require using 3rd party software, such as TerraScan that cost $20.000-$30.000 for a single license. Photogrammetry software prices are closer to the level of $200 a month per license.
Obviously, another important factor that influences the cost of the service is labour and time. Here, LiDAR has a significant advantage over photogrammetry, as it not only requires significantly less time to process the data but also to lay and mark GCPs.
Overall, depending on the use case and business model photogrammetry services are typically cheaper than LiDAR simply because the investment in the hardware has to be amortized. However, in some cases, the efficiency gains that come with LiDAR can compensate for the sensor cost.
Conclusions
When comparing LiDAR and photogrammetry, it is a key to understand that both technologies have their applications as well as limitations, and in the majority of use cases they are complementary. None of these technologies is better than the other, and none of them will cover all the use cases.
LiDAR should be certainly used when for surveying narrow structures such as power lines or telecom towers and for mapping areas below the tree canopy. Photogrammetry will be the best option for projects that require visual data, e.g., construction inspections, asset management, agriculture. For many projects, both technologies can bring valuable data (e.g., mines or earthworks) and the choice of method depends on a particular use case as well as time, budget, and capturing conditions among other.
LiDAR and photogrammetry are both powerful technologies if you use them the right way. It is clear that with decreasing prices of hardware and software it will become more and more available. Both technologies are still in its early days when it comes to UAV applications and in the following years, we will undoubtedly witness further disruptions (especially when it comes to hardware prices, and machine learning software automation). Stay tunes. We will keep you posted.