
In 2014 over the half of the world’s population was living in cities. The dense infrastructure, elevated percentage of built up areas, traffic and a lack of natural air filter mechanisms often makes highly populated settlements to spots of poor air quality. More than 80% of people living in urban areas that monitor air pollution are exposed to air quality levels that exceed the World Health Organisation (WHO) limits. The impact of bad air quality is significantly higher in low-income cities. According to the latest urban air quality database, 98% of cities in low- and middle income countries with more than 100 000 inhabitants do not meet WHO air quality guidelines. In high-income countries, that percentage decreases to 56%. – The impacts of poor air quality rises the risk of stroke, heart disease, lung cancer, and chronic and acute respiratory diseases, including asthma, increases for the people who live in them.
Due to the importance of the topic, the WHO holds and updates a database of urban air quality assessment for now over 3000 cities in over 103 countries, a number that has doubled in the last two years. The database is visualized via an interactive airpollution map that can be seen on the web.
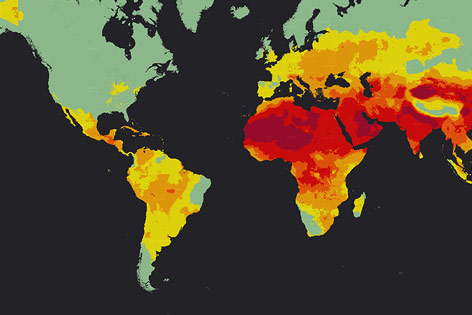
Global Air Pollution Map (interpolated)
The global airpollution map shows that over 90% of the worlds population is living in places where air quality levels are regularly exceeded. In other words, only 8% of the world’s population lives in places of good air quality. Regions with poor air quality are Northwest Africa, the Saudi Arabian Peninsula including the Golf of Persia, parts of India, Russia and China. Interestingly these regions do not only coincide with places of low environmental specification for industry but often are located in zones where the purification of the air by natural filtering systems, for instance by forests/ vegetation or precipitation is low. The latter is well examplified by the Sahara as area of bad air quality. The most polluted spot in terms of air quality is not Peking ranking on place 153, but the city of Onitsha in Nigeria.
The situation in Europe is mediocre, whereas the air quality assessments are particularly low for Eastern Europe. Interestingly, the air quality in North America is thoughout most parts of the continent quite good, which can be explained by the presence of largly unpopulated areas and a modernized industry. To me, that is an obvious reason, why strict environmental regulations are important for a densly populated continent as Europe.
Have a look at the interactive map examples in the figures below or better, make yourself an own opinion about the air pollution map on its website (see link below).
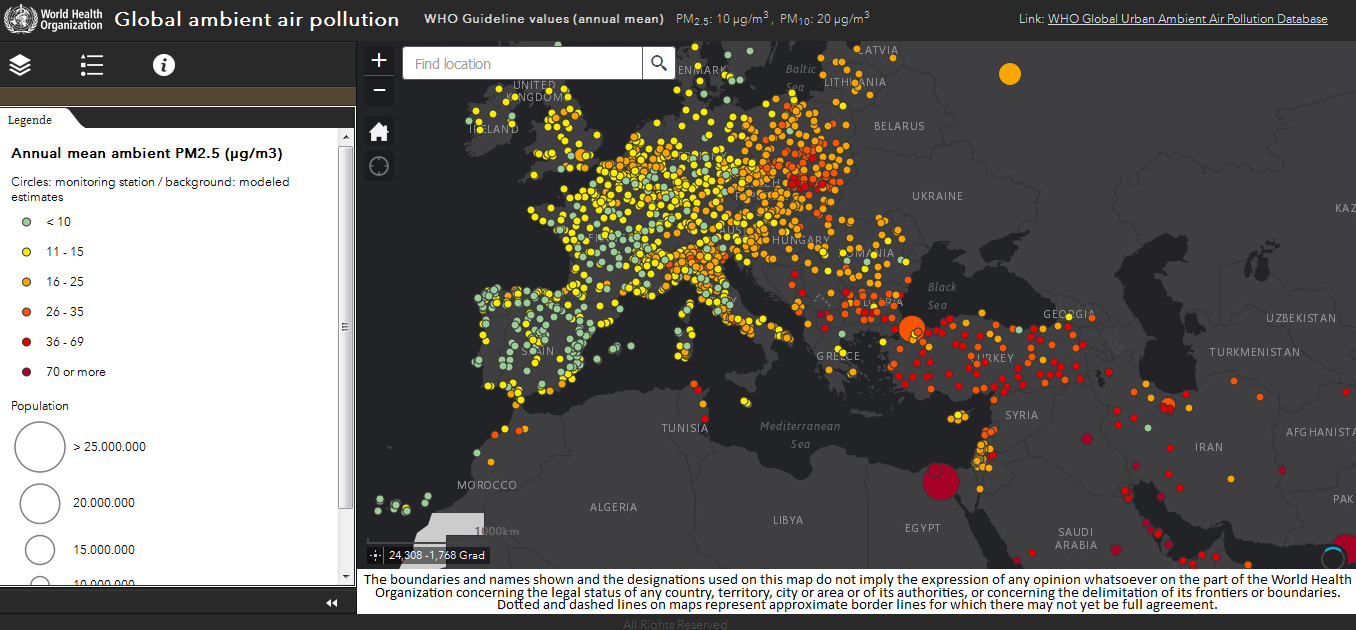
Global ambient air pollution (interactive map example), Europe.
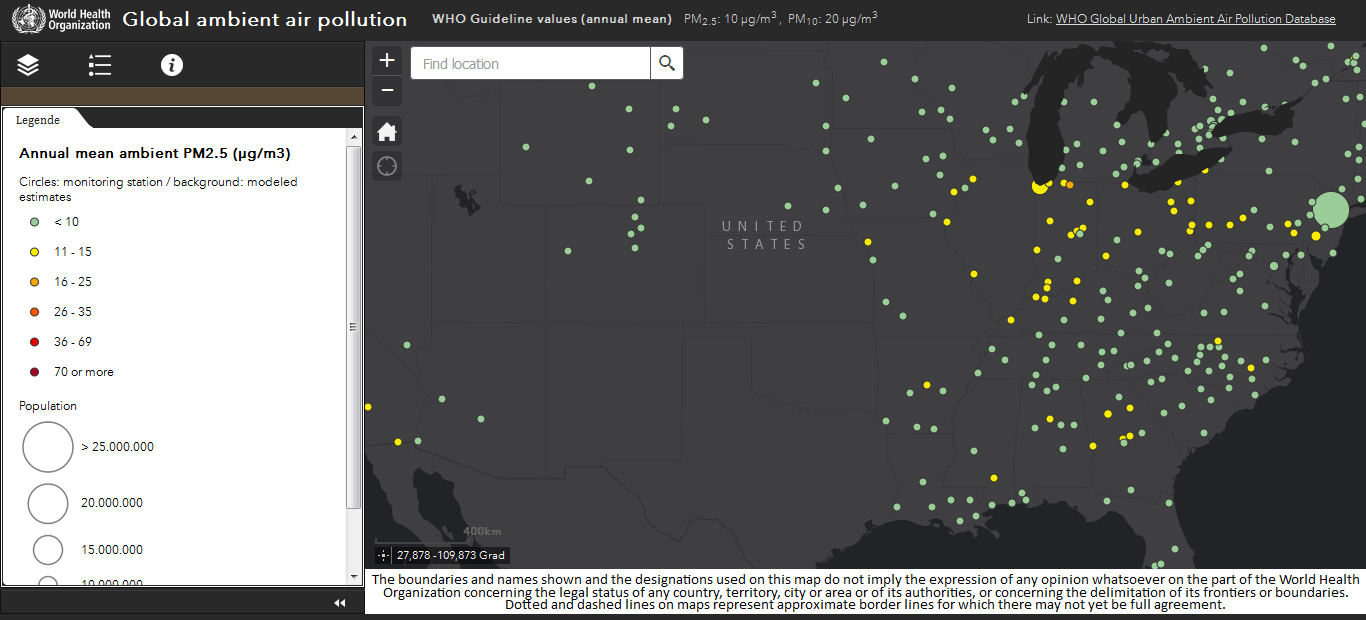
Global ambient air pollution (interactive map example), North America.
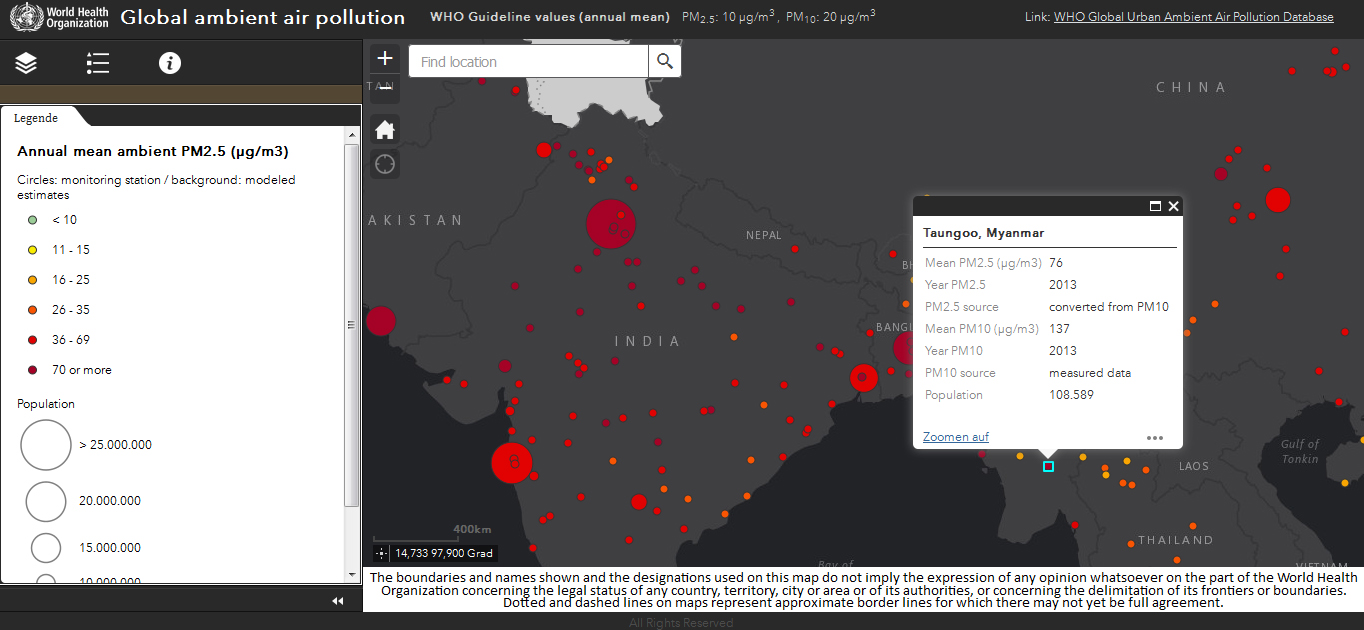
Global ambient air pollution (interactive map example), India. The air quality details for each sample station can be opened.

#Ideas


Next article
This week we’ve got for you something cool. The challenge is to recognize on satellite images 10 famous bridges from all around the world. Remember to share your score with the world and to check out our other quizzes.
All the images are the courtesy of Terraserver.com.
[viralQuiz id=51]