We have analyzed 568 geospatial startups around the world. Here are the conclusions about the market

The geospatial industry is continuously developing very fast all around the world. The market size is projected to grow rapidly from $239.1B in 2019 to $502B in 2024, at a Compound Annual Growth Rate (CAGR) of 13.2% during this period.
The geospatial industry comprises private and governmental entities that are involved in collecting, storing, processing, analyzing, mapping, and distributing data related to location information. Location-based information is becoming more and more essential in today’s knowledge-driven world. It is used in providing key decision support in fields such as weather forecasting, early weather disasters warning, supply chain management, food production, land titling and administration, transportation network analysis, disease analysis, and battlefield monitoring…
Geospatial data is used daily by millions of people in their everyday routine. Google Maps itself has over 2 billion users. Without this data, our smartphones could not navigate us with the use of digital maps to our destinations. Moreover, geospatial technologies have been identified by the US Department of Labor as one of the three high-growth industries in the 21st century.
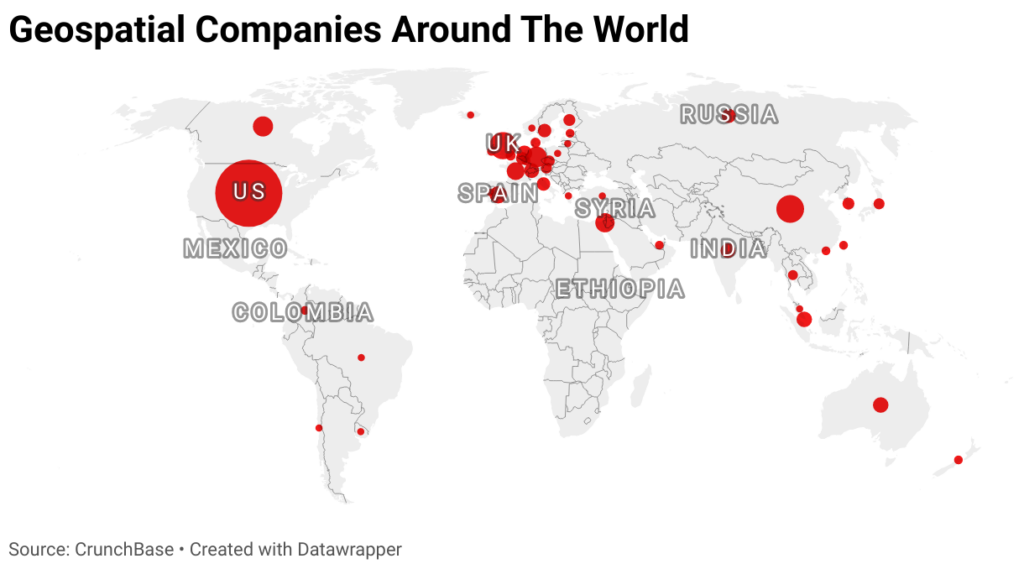
Geospatial Companies Distribution Around The World:
After analyzing the data of 568 active companies founded after the year 2005 in the geospatial industry based on Crunchbase, we found that about 48% of the companies are located in the US where they captured around 57% of the total funding in the industry:
China came in second place, where 7% of the companies are located, and they captured 17% of the total funding of the industry, followed by the UK, Germany, and Canada respectively.
The US lead in this industry is mainly caused by the application of geospatial technologies in various fields and by the exceptional governmental support and recognition of the essential role of this industry in government and society. This support was revealed through the Geospatial Data Act (GDA) that the President signed in 2018. On the other hand, the Asia Pacific geospatial market is expected to continue to outperform the EU market where APAC countries are expected to have exponential market growth, especially in China, South Korea, and India. The tremendous expansion in the urban population in these countries is one of the major factors of this growth that results in escalating the application of smart cities, smart infrastructure, and well-planned urban landscapes. In addition, these countries are witnessing great technological development in the 5G and IOT fields.
Industry Trends:
After analyzing the establishment date of the 568 companies in our database, we realized the massive negative impact of the Covid19 pandemic, which started by the end of 2019, on the establishment of new startups in this industry. In fact, the US was the only country where new companies were launched in the industry in the year 2021. Despite the negative effect of the lockdown on establishing new geospatial companies, the adoption of geospatial analysis has risen in the healthcare sector to monitor the Covid19 outbreak. In addition, our data revealed that the economic crisis between 2009 and 2010 did not significantly affect the industry, especially in the US, mainly due to the continual investment of the US government in the geospatial industry to improve homeland security.
Top 10 Companies by Total Funding:
After specifying the top 10 countries funding geospatial companies in our database, we found that Momenta, which is a Chinese company founded in the year 2016 and is working mainly on AI and Autonomous applications, has the highest funding with about $1203.15088 million. Yet, 7 out of the top 10 companies are American companies, which reveals the domination of the US in this industry. Whereas ISPACE TECHNOLOGIES is a Japanese company, and SATELLOGIC is an Argentinian company.

#Business


Next article

When you think about viral content, maps are not the first thing that comes to mind. And yet, it is not uncommon to see maps of all shapes and sizes dominating social conversations about various issues – as well as non-issues.
In January 2020, the Australian bushfires were “the hottest” topic for every media. The artist Anthony Hearsey pulled publically-available satellite data about the fires from NASA and created a 3D rendering of all the fires that had been detected in a one-month period.
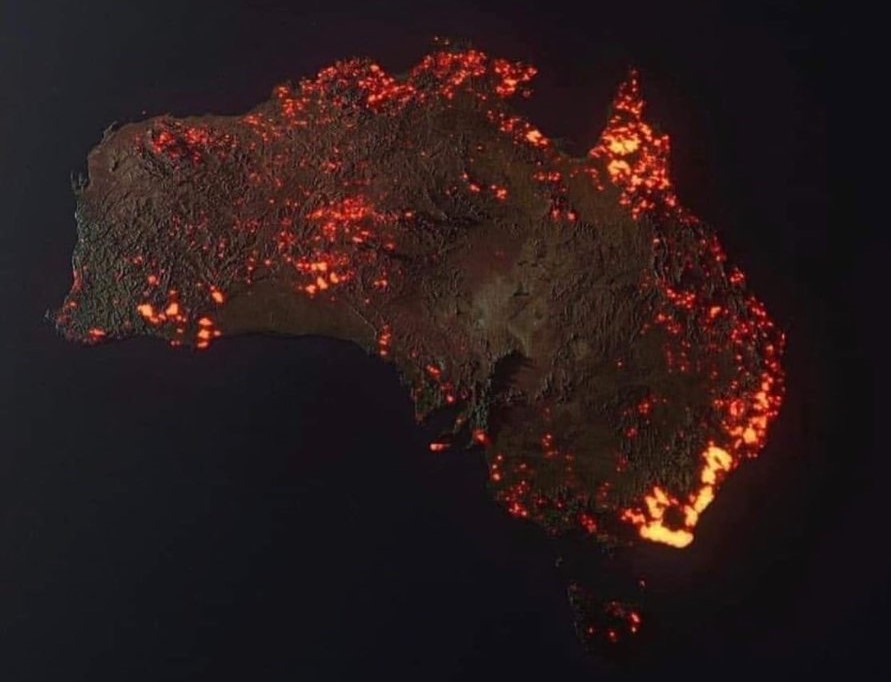
Courtesy: Anthony Hearsey
People mistook that compilation to be a recent satellite photo showing the live extent of the fire. Singer Rihanna put out a tweet of that visualization, and in no time, it had amassed 76,8000 retweets and comments. News organizations had to step in and clarify what that graphic actually represented.
But that’s just one example of a trending map. Virtually anything interesting could make up for the content of a viral map – if done correctly.
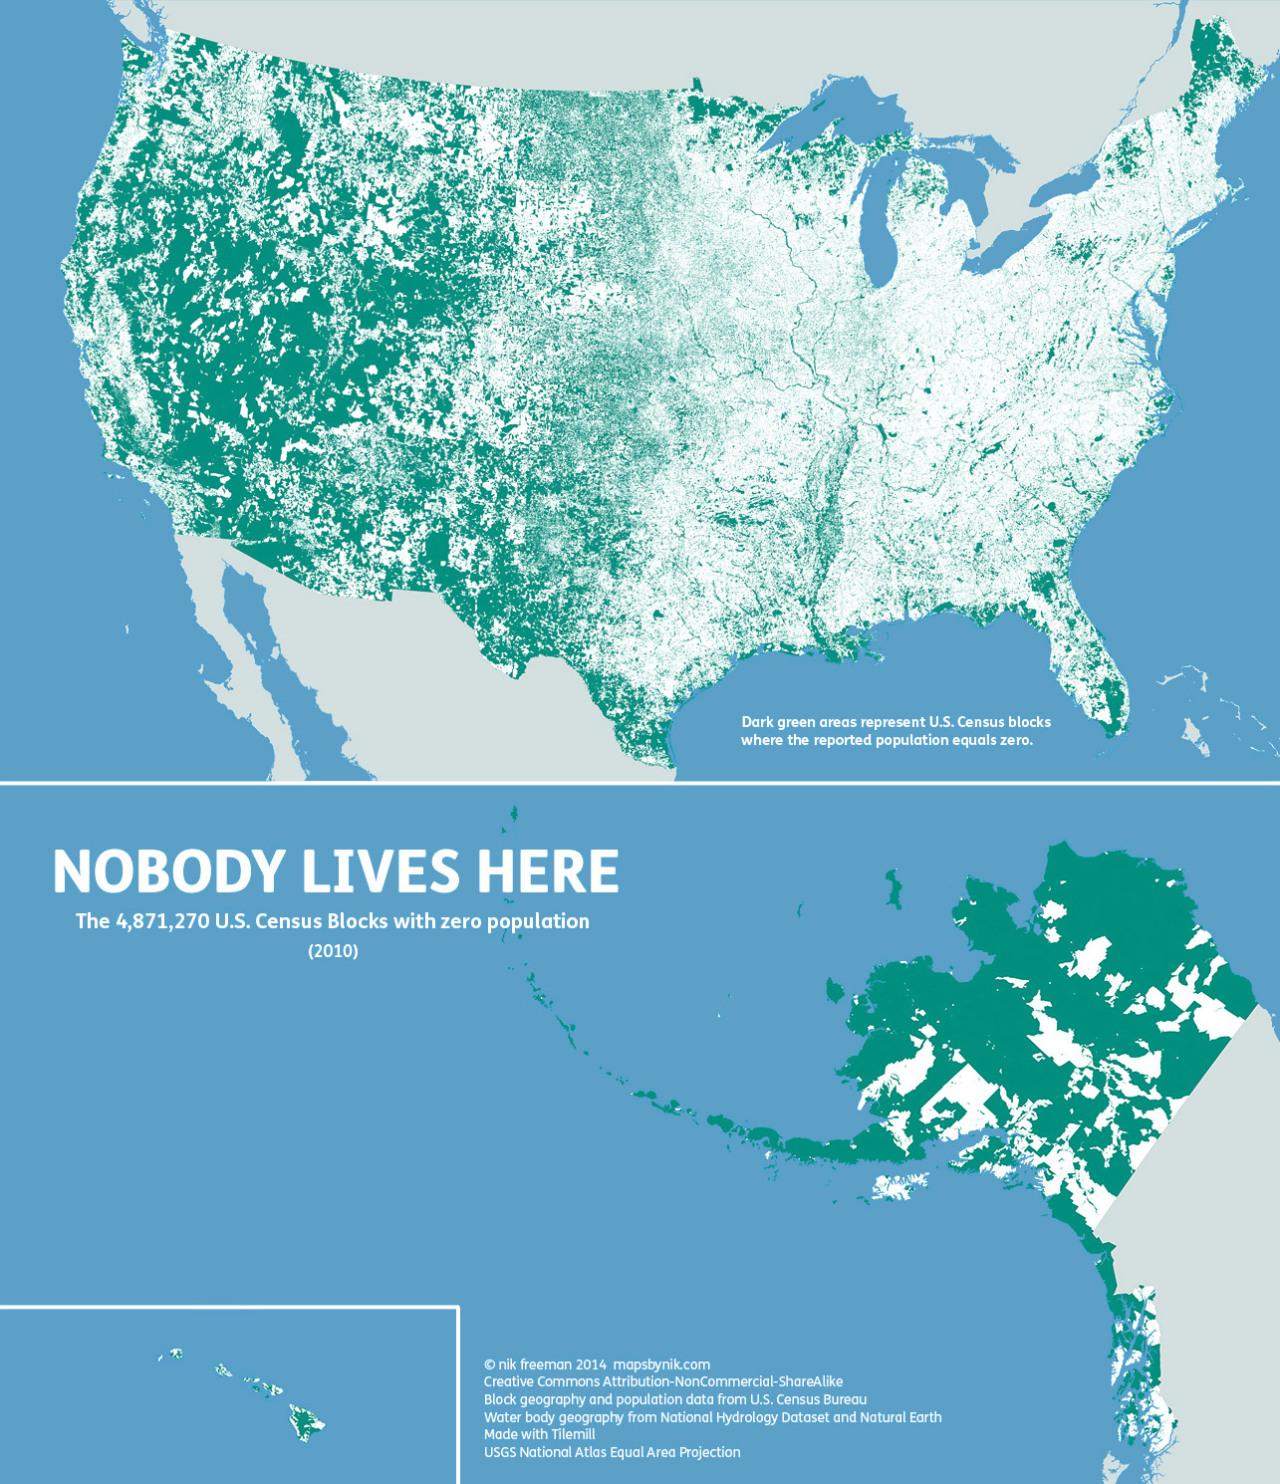
Like Nik Freeman’s map of the nearly 5 million Census Blocks in the United States where no one lives:
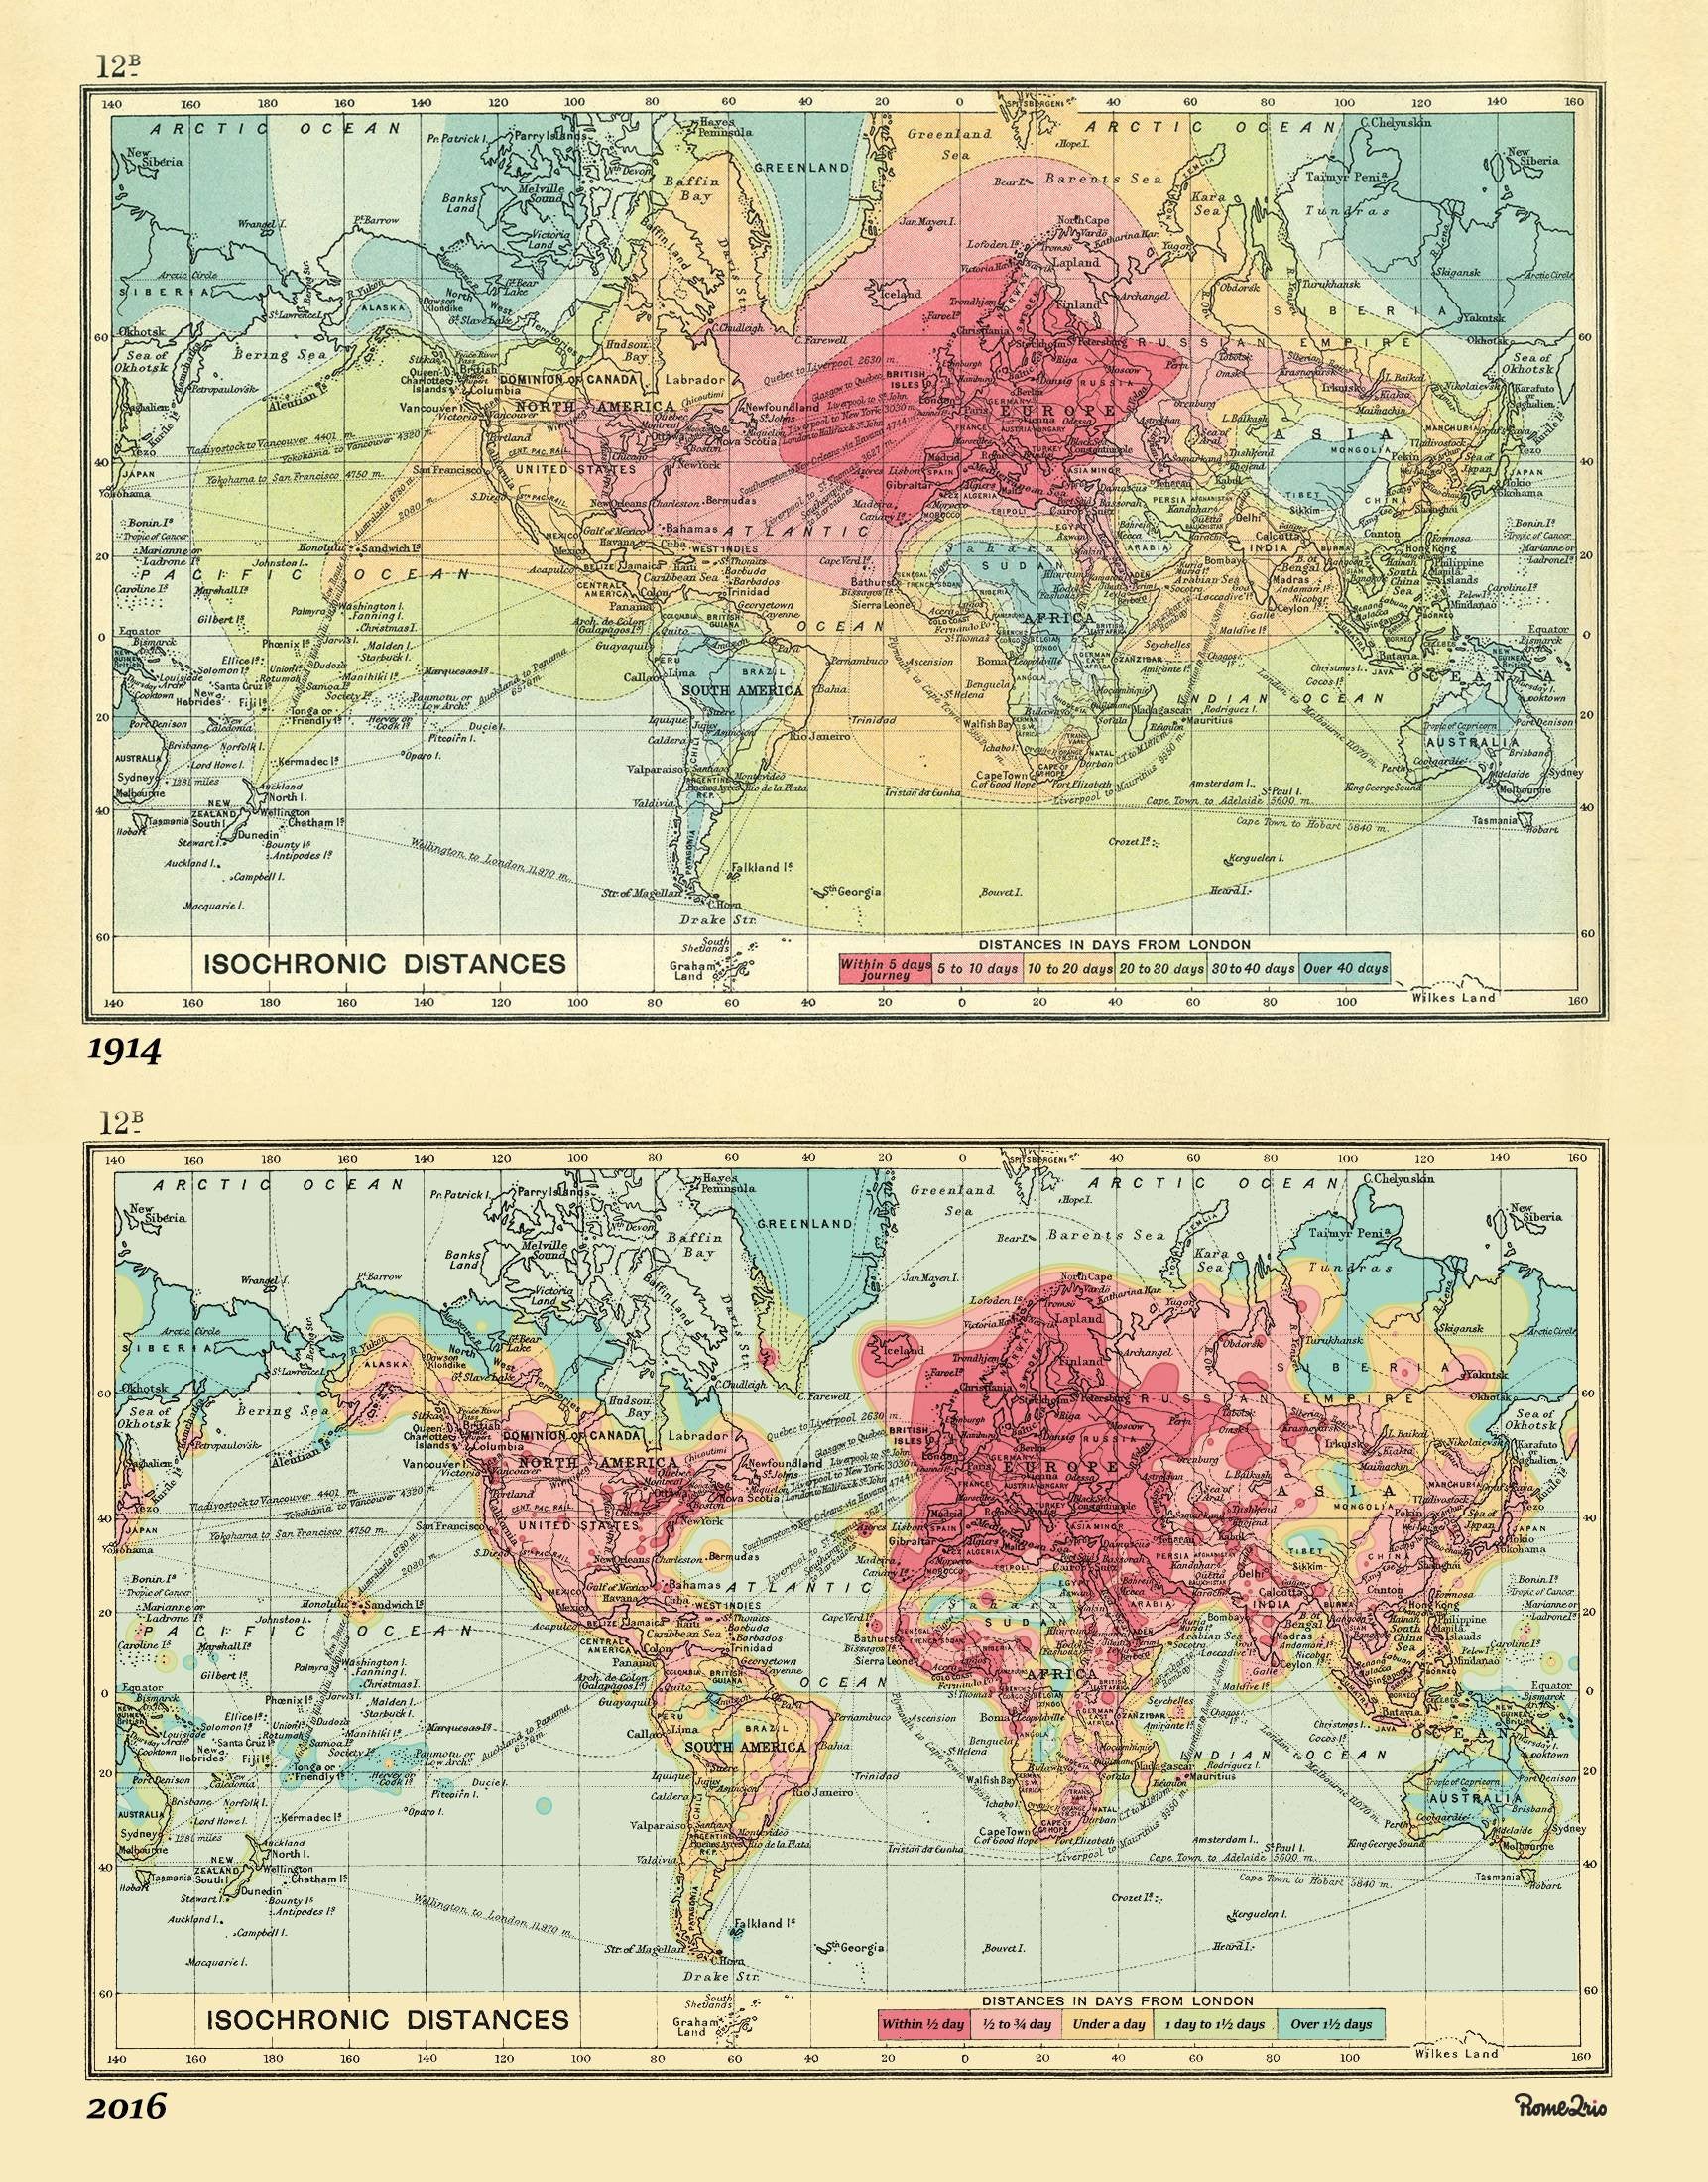
Or Rome2rio’s modern-day heatmap of the travel times from London to every airport around the world – which uses a map from 1914 as its base:
But what is it that makes a map click with its audience? Researchers and cartographers alike are trying to decode the mystery.
And while nobody has stumbled upon a fixed formula using which you would be able to craft viral maps intentionally, case study examples have shown that there are certain elements that can be associated with maps that are shared widely on social media or, depending on their content, via news organizations.
Elements of viral cartography
1. Simplicity
Like all good maps, viral maps are easy to understand. It shouldn’t take anyone more than a few second to get what the map is talking about – like the one below that shows you just how densely populated India is:
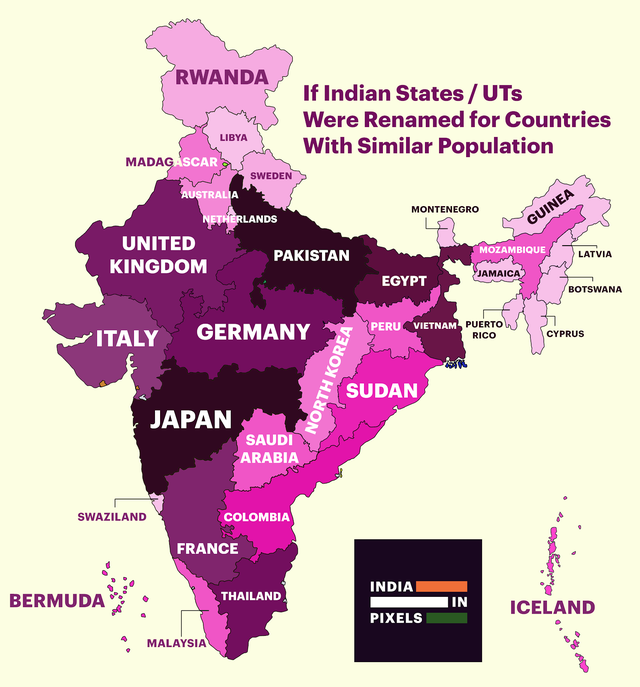
Courtesy: India in Pixels
2. Usefulness
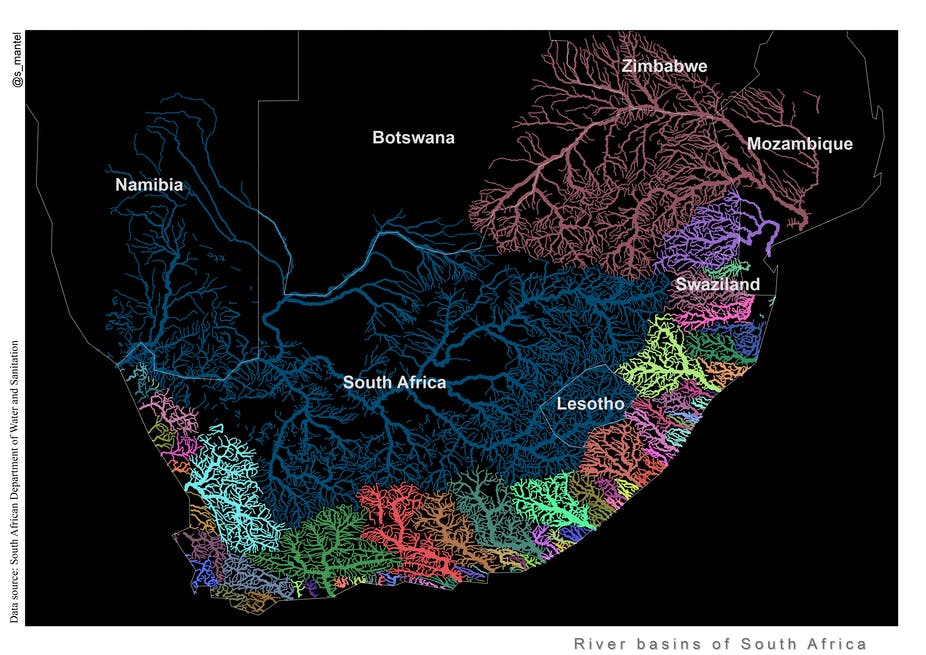
A map could also go viral if it answers a question of interest for a diverse group of people. When river ecologist Sukhmani Mantel decided to bathe the river basins of South Africa in the colorful palette below, she didn’t know it was going to go viral. But South Africans told her how they wished they had access to this map when they were in school. And you have to admit, maps like this would have made geography even more fun for all of us!
3. Aesthetics
Aesthetics also plays a very important role in making a map appeal to the masses. Let’s take the topographic map of Iceland below as an example. When you think about Iceland, you think icy whites or cold blues – not the deep reds that show the lowest elevations or the bright yellows that show the highest!
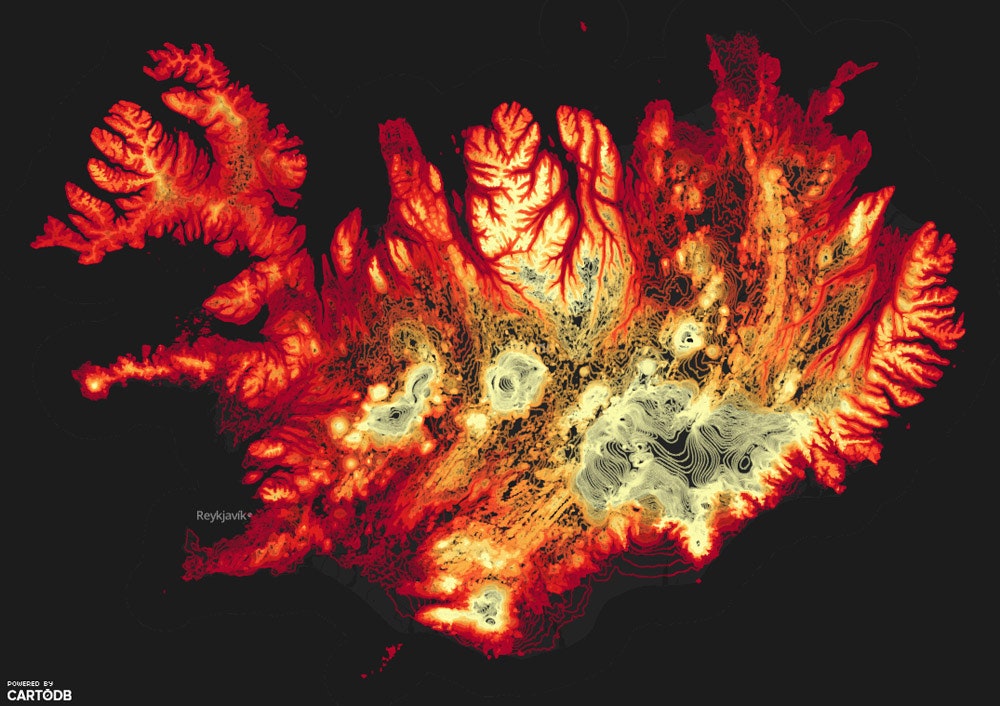
Courtesy: Aitor Garcia Ray
4. Emotional resonance
It doesn’t matter if its awe, or surprise, or joy, or fear, or anger – if a map is able to elicit an emotional response from you, chances are, you would want to share it with your friends or colleagues. Like the map below that divides Russia according to which country is the nearest to any particular point within the country, as the crow flies.
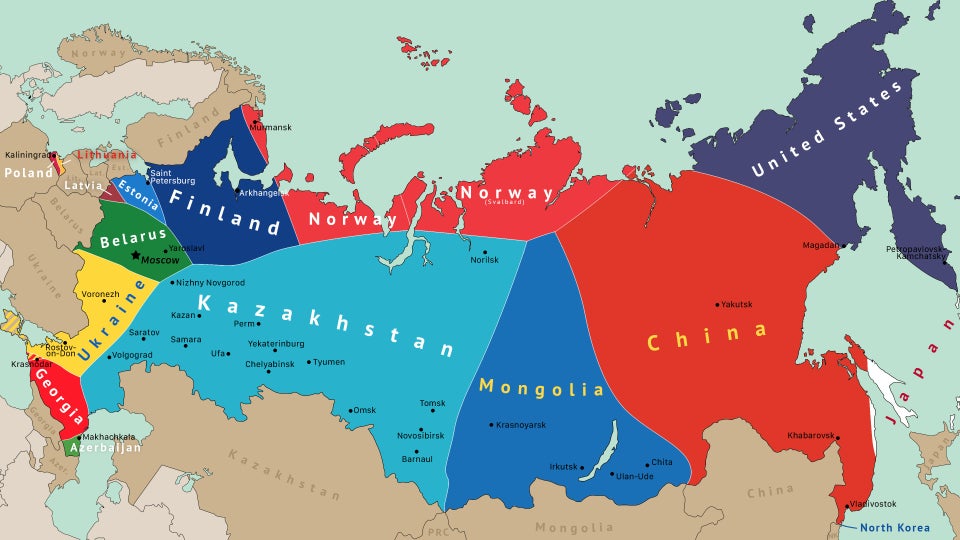
Courtesy: galacticpasta
You only have to go to Reddit to see some of the responses to this map to understand the importance of emotional resonance. Like this Norwegian guy who just found out that there is only one country that separates Norway from North Korea!
5. Humor
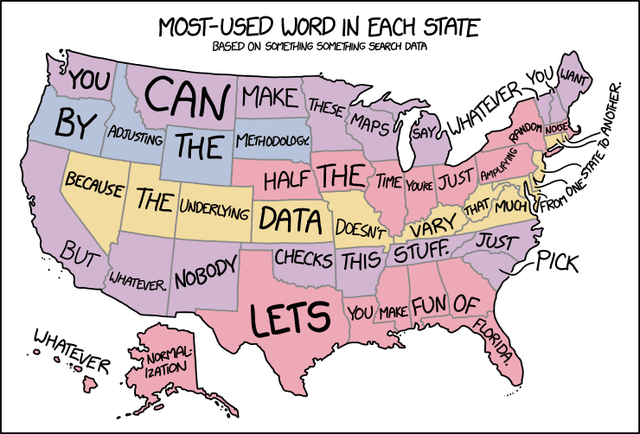
Courtesy: xkcd
The map above is a pointed critique that many maps that get shared on social media are just fluff rather than substance. But a little lightheartedness goes a long way to exorcise stress and connect us to each other – especially in these challenging times.
6. Topicality
Timing, of course, can also play a crucial role in making a map viral. Nate Silver’s map below was released by statistical news website FiveThirtyEight just as the 2016 US presidential elections were heating up. It’s a projection map that gives you a view into a potential future – “if only women voted”. Not only has this map been viewed and shared millions of times on social media, but it also checks the box for the argument that imitation is the sincerest form of flattery.
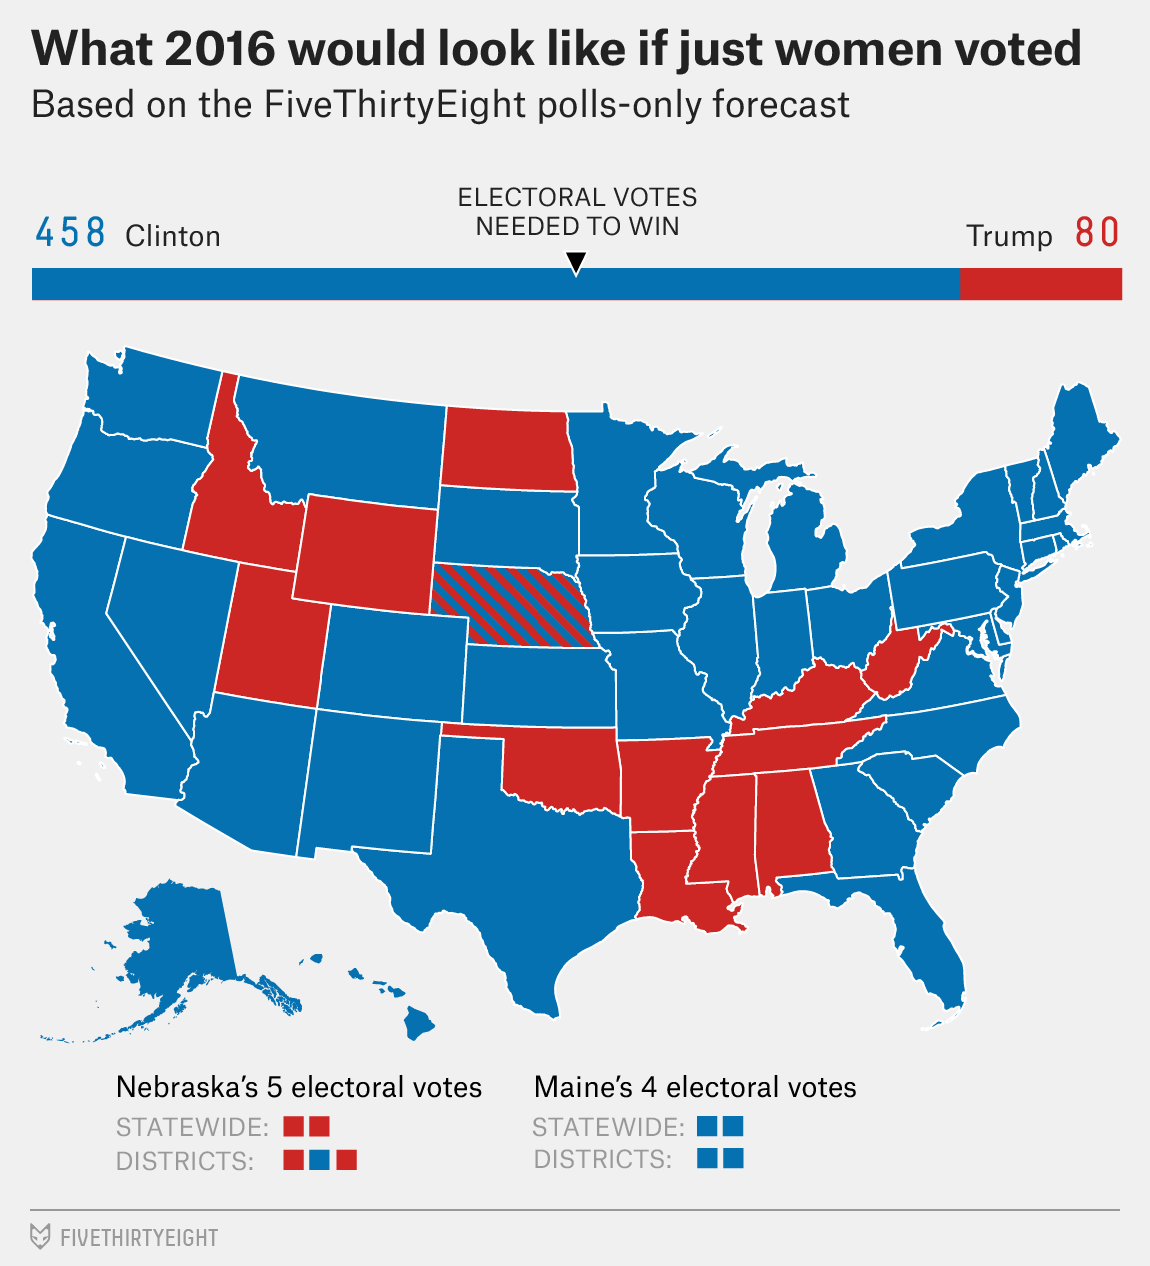
Viral maps and fake news
While researching viral cartography, Penn State geographer Anthony Robinson found that the above map had spawned a series of copycat maps, many of which also went viral. These included both the serious (what “if only people of color voted”) and the silly (“if only goats voted”).
Robinson found more than 500 such unique maps on the internet. And in the context of our battle with fake news, this is a very dangerous thing. When a map conveys more validity than it deserves, it becomes very easy to fabricate the truth; we all know how convincing auto-generated videos called “deep fakes” seem.
As Robinson says, “It’s cool that anybody can make a map now. They can take election data and do something creative with it, and it can be very helpful. But it’s also easy to make something that looks like it’s authoritative and use it as a weapon.”
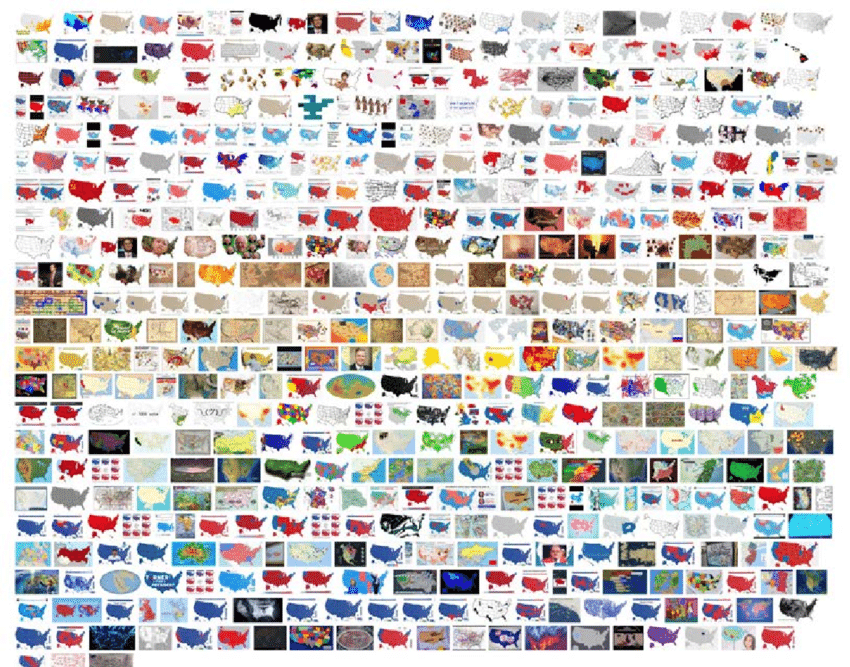
The copycat maps
We must move beyond the notion that maps only show what’s “already there”. Maps can help to “create” perceptions and shape people’s “future actions” as well.
This is why it is more important now than ever to understand where a map has originated. In an ideal world, people would question map accuracy or introspect the intentions behind the map. In our world, technology will hopefully make up for the lack of skepticism among people soon. Machine learning image detection algorithms, like those from Google Cloud Vision, can be used to trace the provenance of viral maps and see how they spread online.
But until that happens, it’s our job to ensure that we and those around us, map responsibly and not just create anything for the sake of virality.
Watch this as a video story: