
“Geospatial tells the story of the delivery driver taking an optimized route. Geospatial tells the story of the construction worker putting in the groundwork to create a livable community. Geospatial tells the story of everyday people, where they shop, and what they like to buy. If we let it, geospatial tells the story of the human experience – what makes us tick and what drives us forward.”
To Begin – A Story
Have you ever felt the need for more, for something genuine, like something is missing and there is a disconnect? In our highly connected world of electronics fueled by the Internet, I often feel disconnected from something deeply human. It’s hard to put a finger on it, but I will phrase it colloquially as the “human experience”.
To illustrate, I’d like to share a short story about an experience I had in New Orleans. I was on vacation, walking the streets with my partner, enjoying the sights, sounds, smells, and noise of a culture uniquely it’s own. I had just purchased a sketch of Lafitte’s Blacksmith Shop from a local artist. It is one of the oldest structures in New Orleans, now turned into a bar on the far end of Bourbon St. Rumors circulate that, in the times of yore, strategic meetings took place that contributed to America’s acquisition of the Louisiana Purchase.
My partner and I had just arrived and sat outside with our drinks in a quaint spot underneath a rustic gaslit lamp. The bar was crowded. The atmosphere was regal. At this time, a homeless man passed by pushing a wheelchair with a gray pit bull in it, roughly 45 lbs or so. The pit bull was still young. Being dog lovers, my partner and I reached out to pet the dog. The dog was more interested in a water bottle we had than in us. We promptly let the man and dog have our water bottle which turned into one of the most genuine conversations I’ve had in recent memory. The man was a veteran. He was in the Marines and part of a combat mission where the majority of his company passed away, and he was one of the few survivors. A memorial video created by his unit is available by searching “Combat Footage of US Marines in Fallujah, Iraq |Music Video|” on YouTube.
He is around the 2:12 mark in the video. We sat there enchanted as he forwarded to that part of the video, relishing in the memory of his youth. The big nose was unmistakably his. Listening to him describe his story in such vivid detail was a treat. Around us, in my periphery, I saw people giving us judgmental glares while overhearing the occasional potshot about the homeless man’s dog needing water. His dog had water.
The effect was disorienting, like a drunken stupor where the lines between perception and reality blur and become hard to distinguish. It was refreshing and shocking, like the effect felt when standing underneath a waterfall with arms outstretched. I’d take a conversation with this man over those people any day.
Geospatial and the Human Experience
Credited to ThinkPlace – Mapping the Full Picture
What does this story have to do with geospatial? It got me thinking about the things I take for granted every day. The beautiful things I pass by that I no longer seem to notice. The convenient things I consume that help me stay comfortable. The practical things I use that others around the world desperately need.
Geospatial technology helps our packages get delivered quicker, helps us plan and keep track of utilities, and helps us predict behavior before it happens, among other things. At its core, though, geospatial tells a story. Geospatial tells the story of the delivery driver taking an optimized route. Geospatial tells the story of the construction worker putting in the groundwork to create a livable community. Geospatial tells the story of everyday people, where they shop, and what they like to buy. If we let it, geospatial tells the story of the human experience – what makes us tick and what drives us forward.
What are the stories of people living in third world countries? What are the stories of people living under systemic bias? What are the stories of people responding to and providing humanitarian aid during natural disasters? What are the stories of people taking time to slow down, understand, and solve these problems?
Geospatial technology enables us to tell these stories, broaden our perspectives and connect with the world around us. With every initiative put in place to solve a critical issue and every data point plotted to add a spatial component to the issue, we have the opportunity to learn and grow more connected. We are better able to understand, empathize, and cohabitate within the world we all share. What I’d like to do is share a few individuals and organizations that are working towards a brighter world and using geospatial as a means to do so.
Out of Eden Walk

Photograph by John Stanmeyer at National Geographic.
Something that has fascinated me for many years now – Paul Salopek’s experiment in slow journalism, an attempt to walk the 24,000-mile path that humanity took from our origins in Africa to present day. More to the point for me: the tagline of Slow Down, Find Humanity on the front page of National Geographic’s blog.
Paul has been walking the Earth and retracing humanity’s footsteps since 2013. Along the way, he has experienced people, cultures, and landscapes in a way that few of us ever will. The blog is full of maps and photographs partitioning the journey in consumable digestible bits. At the helm of that effort is the geospatial technology that has allowed for a more enriched modern day storytelling experience.
During his Esri 2020 User Conference presentation (link here), Paul describes an experience walking with Afar pastoralists, camel herders who move their animals up and down the Rift Valley of Africa. He describes in vivid detail what he observed and learned from them – an alertness and smooth fluid walk. How often do we slow down and observe people in this way?
Humanitarian Open Street Map

Map credited to Benjamin Herforts at Humanitarian Open Street Map
Another fantastic initiative is Humanitarian OpenStreetMap. Supporting gargantuan efforts such as Water & Sanitation, Disaster Response, and Poverty Elimination, the Humanitarian OpenStreetMap team describes themselves as:
“… an international team dedicated to humanitarian action and community development through open mapping. We work together to provide map data which revolutionizes disaster management, reduces risks, and contributes to achievement of the Sustainable Development Goals.”
Spanning the What We Do page are topics such as “Reaching those in need through maps”, “Putting the world’s most vulnerable people and places on the map”, “Expanding knowledge across partners and communities”, and “Developing innovative new technology to serve the humanitarian and development communities.
Geospatial technology provides visibility to these issues and allows us to support their efforts freely and almost effortlessly.
Los Angeles County Homelessness & Housing Map

Credited to Los Angeles County Homeless Initiative
Of a more informative nature is the Los Angeles County Homelessness & Housing Map. It provides data and visuals to communicate the story of homelessness in LA and the efforts people are taking to remedy that. Homelessness counts, current and planned interim housing, and winter shelters are all topics that are hit on.
This is a great one to spend a few minutes viewing via the StoryMap presentation accessed by clicking on the photo.
The Message
In the examples above, I shared three examples spanning volunteer, state and local government, and private organizations. To me, this illustrates just how powerful of a tool geospatial technology is to tell stories, educate, and help make the world a better place. In short, geospatial is a great way to connect with the human experience.
Storytelling has been used throughout the span of history to keep events, communities, and cultures alive. The desire to be remembered and not forgotten is an innate part of human nature. In our modern information age, we receive so much stimulation that it is hard to focus and internalize the people and world around us.
The message I’d like to communicate is that is takes a conscious effort to maintain connectedness, but it essential to our nature. I hope you enjoyed the stories and resources in the article. I’d love to hear your thoughts. What do you think about geospatial and the human experience? What resources have you come across that spread a similar message? Disagreements? Thoughtful discourse? Let me know in the comments!


#Business


Next article

Geoinformation as an innovative decision support tool in fighting COVID-19 – using wastewater data.

Data is increasingly defining us – everything in our built and natural world has a geospatial component. Over the years, spatial data has become more ubiquitous and detailed. Geographical data drives many decisions and location intelligence has proven to enhance analytics. Hence, it is useful in uncovering powerful insights, making inferences by combining all other useful information, which might otherwise go unnoticed.
Since the COVID-19 pandemic, public health organizations have sort ways to make informed strategic decisions about the virus. Wastewater data proves to be useful in the forecast of COVID-19 infection in communities and geographical information science (GIS) as a tool has helped bolster this discovery.
Why is monitoring COVID-19 in wastewater important?
SARS-CoV-2 RNA (ribonucleic acid), the virus that carries the COVID-19 disease, has been detected in human faeces. It is also found in asymptomatic – one-fourth of SARS-CoV-2 infections (Alene et al., 2021), pre- symptomatic and symptomatic people. In many people, viral shedding begins before they experience symptoms. Wastewater testing can indicate an increase in the infection rate before clinical oral testing does. Studies have shown that the SARS-CoV-2 RNA viral signal can be detected in wastewater several days before clinical cases are identified.
Photo by Erik Mclean on Unsplash
“You spread the virus when you go to the bathroom, even if you don’t know you are infected yet,” said Ana Maria de Roda Husman, Head of Environment at the National Institute for Public Health and the Environment, Netherlands.
Wastewater treatment plants collect faecal matter transported from the sewage system. Researchers collect and test faecal samples in the laboratory. By collecting wastewater treatment plant samples, they can gain insights into changes in infection rates in a community. Furthermore, it is a cost-effective way of collecting data from everyone within the community the wastewater treatment plant serves, including those who lack access to healthcare. Thus, wastewater data surveillance is very useful as an early warning, non-invasive, system in predicting the spread of the virus.
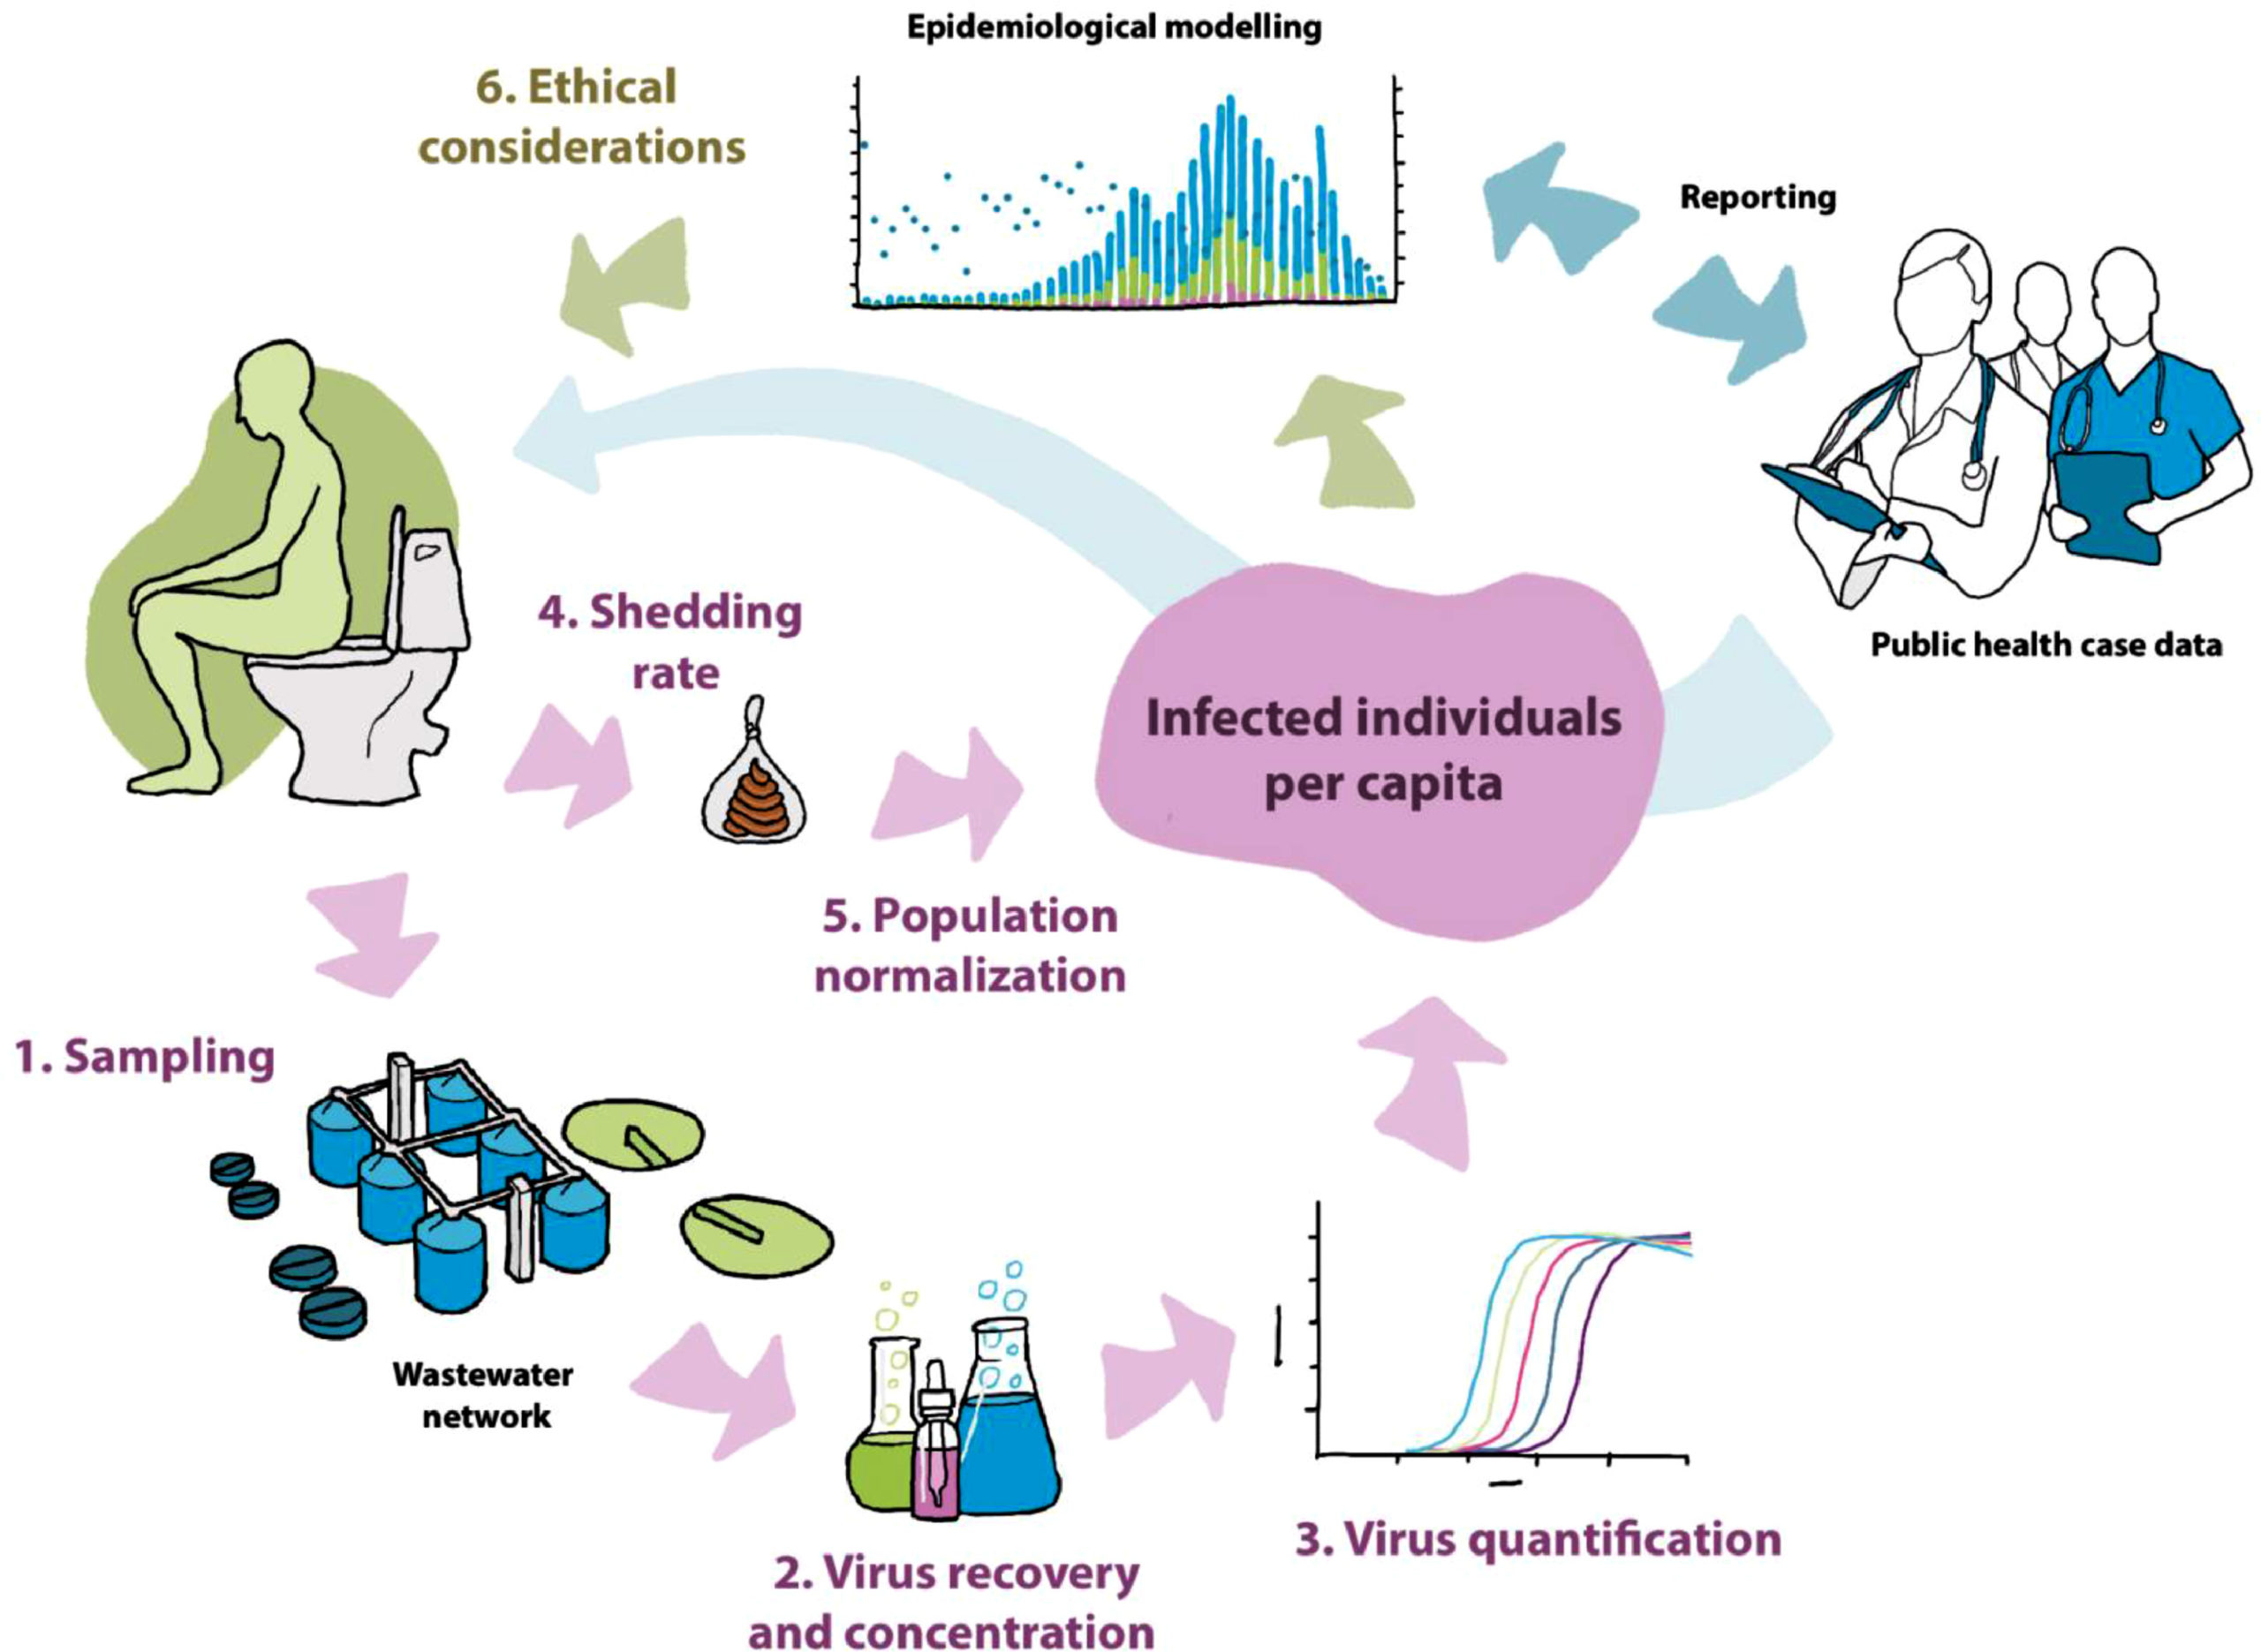
A structured approach to wastewater-based epidemiology (WBE) as used community COVID-19 surveillance. (Polo et al., 2020)
In addition, monitoring wastewater to keep track of infection levels provides a means for data-informed decisions and strategic planning. It also provides a snapshot and a holistic insight about the health of a community.
“Wastewater testing and monitoring should be implemented in every city, so we can see and monitor viruses before they become a pandemic,” said Rosa Inchausti, Director of Strategic Management and Diversity at the City of Tempe.
What role is GIS playing in wastewater surveillance against COVID-19?
How do we connect data to place? GIS leverages on several capabilities. These include, data organization, querying, visualization, management and automation for repeatability and reproducibility. Therefore, this process can be applied to different communities at different scales – for example, national to sub-national level.
Geospatial intelligence provides an immersion and an avenue to visualize community locations and a trend of the viral load per population simultaneously, hence providing additional insights. For example, through dashboards and spatiotemporal mapping to understand the data. Furthermore, visualizing the locations of wastewater treatment plants, helps to understand the distribution of these treatment plants. It is also valuable to compare several areas/communities and contextualize the data in the real world. Therefore, connecting this data with supplementary information health indicators and metrics such as positive cases, hospital admissions, deaths and other socio- economic indicators provide additional value and a comprehensive explanation in understanding the spatial and temporal trends of the virus across different spatial scales.
Geoinformation is also very useful in the processing of complex models that explain the relationship between the health indicators and other supplementary information.
Use case examples
- In an innovative partnership to prevent and reduce the spread of COVID-19, the City of Tempe is working in partnership with Arizona State University (ASU) to study the city’s wastewater. Supported by the Tempe City Council’s Innovation Fund, they have employed the use of story maps including, spatial data driven dashboards to inform the public about the virus in wastewater.
“If we break up some of the collection areas into smaller ones, it would allow us to get more focused results about where concentrations are the highest and to better understand the populations being impacted,” said Dr. Stephanie Deitrick, Enterprise GIS & Analytics manager at the City of Tempe.
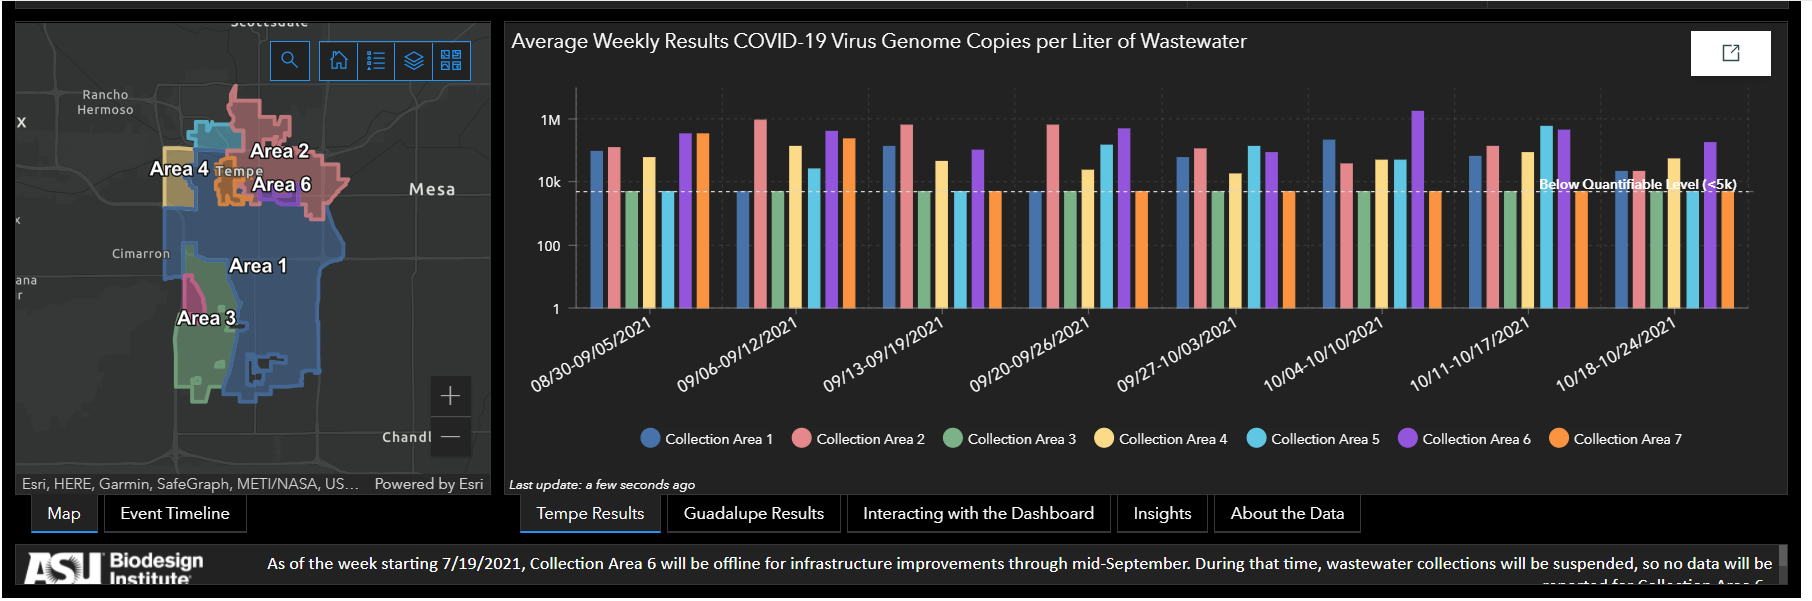
Using geoinformation tools to illustrate the trends of the signal of the weekly average of COVID-19 genome copies per liter of wastewater in Tempe’s sewage. (Source: Tempe’s Covid-19 Wastewater Results Dashboard)
- The Missouri Department of Health and Senior Services (DHSS), Missouri Department of Natural Resources (DNR), and the University of Missouri (MU) developed the Sewershed Surveillance Project , testing COVID-19 viral load in the wastewater of more than 50 participating community water systems. This project aims to mitigate COVID-19 impacts by using wastewater data to identify the geographic distribution of SARS-CoV-2 in Missouri. Additionally, they employed GIS tools to visualize the trend of viral loads in wastewater treatment plant to make deductions on the trends of the viral load over time and monitor the virus indicators for surge or resurgence within communities.
“As the outbreak continues, this program remains an effective tool for trends analysis to be used with other measures of viral spread in a monitored population,” said Jeff Wenzel, bureau chief of DHSS’s Bureau of Environmental Epidemiology.
- University of California San Diego (UCSD) used GIS-powered infrastructure maps to monitor their wastewater. To effectively communicate cases, sewage sample testing results link to a geographical information system to relate which buildings have had a positive case. Overall, this enabled them to offer on-campus housing throughout most of the pandemic.
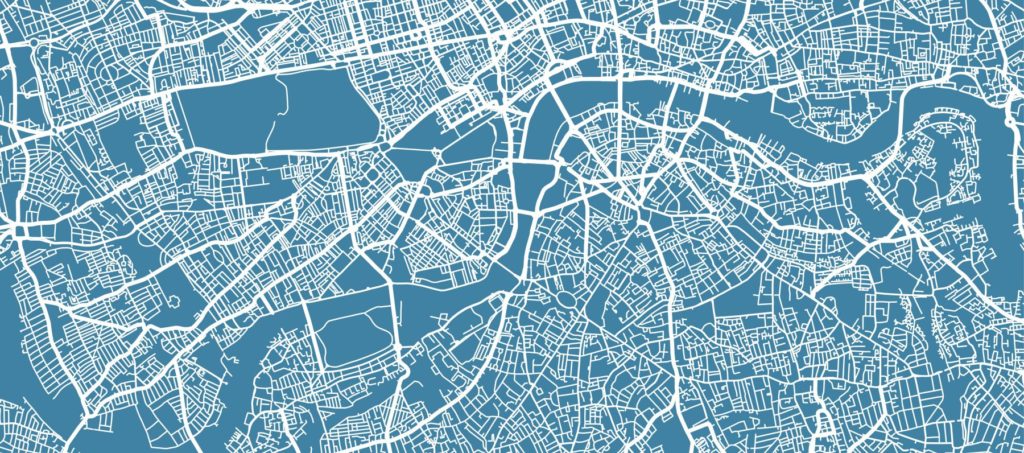
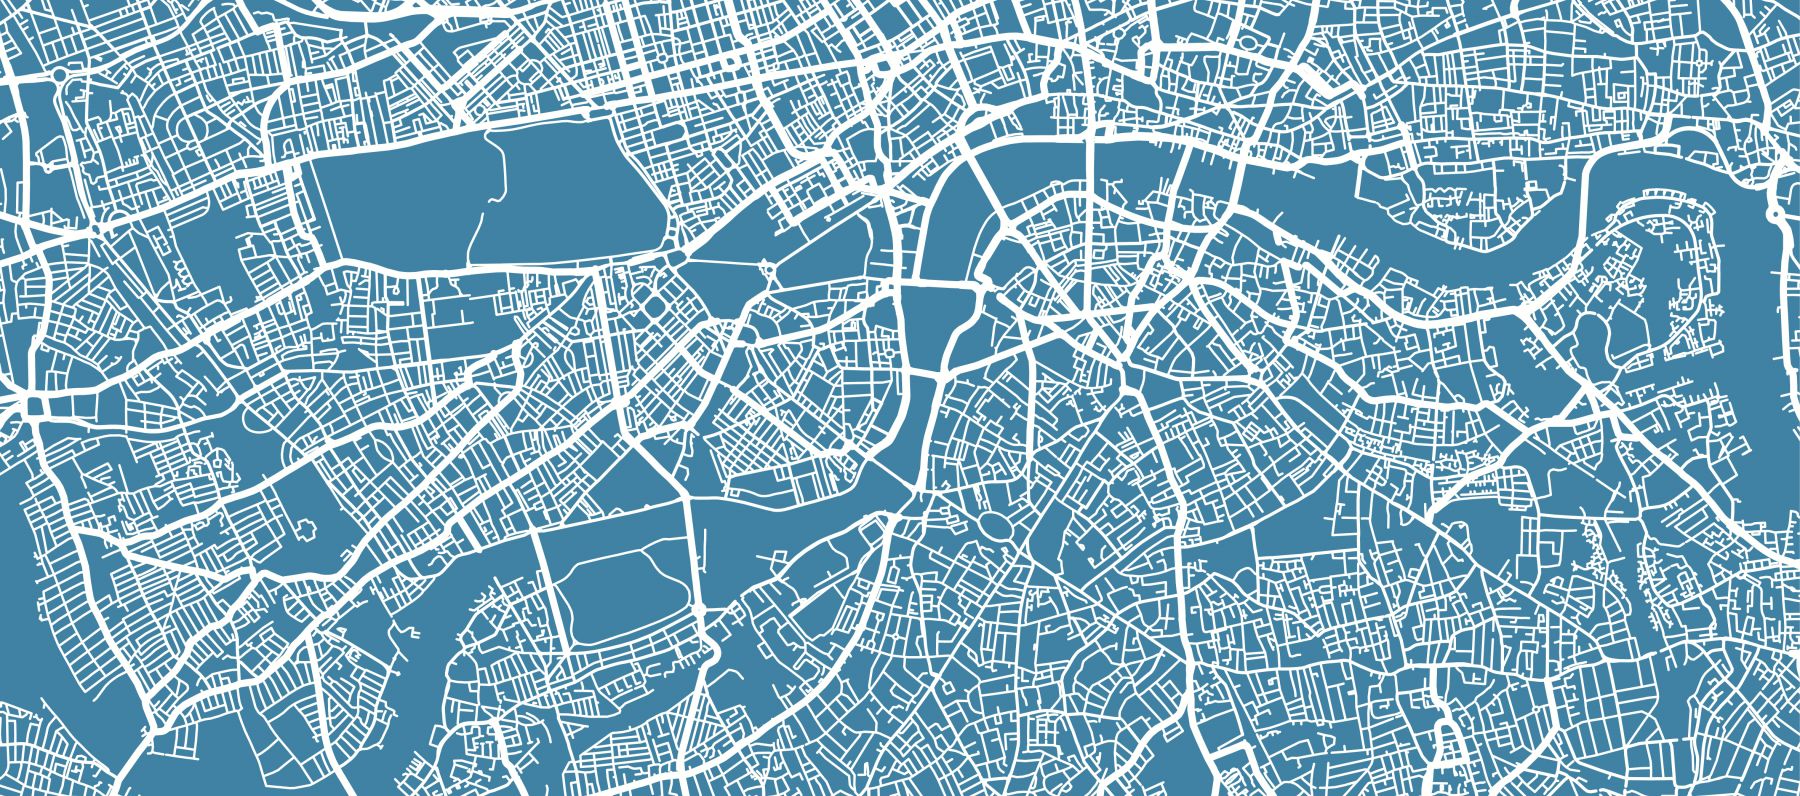
- Natural Environment Research Council (NERC) in the UK, funded by UKRI have been working on a government-led project using wastewater data to track the spread of the COVID-19 disease. GIS has been useful in mapping infection through the sewers and identifying hotspots to contain the outbreak.
Call to Action
Open data helps in understanding the trends and spread of the virus better, if socio-economic and epidemiological indicators are easily available across different communities or regions. It allows a more focused target area together with results from the trend and analysis of the wastewater data.
Cross-sector collaboration would foster a more strategic approach in using wastewater to predict virus spread with geoinformation technologies. Moreover, a combination of ideas and understanding the key considerations from the academia, councils, and a geographical information perspective would be useful to enrich insights about the virus trends and health of the population.
Finally, there is still a lot of research about wastewater surveillance on COVID-19, geoinformation science as a tool proves to be useful decision support system in understanding the virus spread over time. Thus, helping public officials understand vulnerable populations and communities that need immediate interventions.
References
Alene, M., Yismaw, L., Assemie, M.A., Ketema, D.B., Mengist, B., Kassie, B. and Birhan, T.Y., 2021. Magnitude of asymptomatic COVID-19 cases throughout the course of infection: A systematic review and meta-analysis. PloS one, 16(3), p.e0249090.
ArcGIS StoryMaps. 2021. The Sewershed Surveillance Project. [online] Available at: <https://storymaps.arcgis.com/stories/f7f5492486114da6b5d6fdc07f81aacf> [Accessed 21 September 2021].
ArcGIS StoryMaps. 2020. Fighting Coronavirus/COVID-19 with Public Health Data. [online] Available at: <https://storymaps.arcgis.com/stories/e6a45aad50c24e22b7285412d2d6ff2a> [Accessed 21 September 2021].
Geraghty, E., 2021. It’s in the Wastewater: How UC San Diego Senses and Maps COVID-19. [online] Esri. Available at: <https://www.esri.com/about/newsroom/blog/ucsd-senses-maps-covid-19/> [Accessed 18 September 2021].
Lindemann, J., 2020. COVID-19: Tempe Tests Wastewater to Provide Early Warnings. [Blog] ESRI BLOG, Available at: <https://www.esri.com/about/newsroom/blog/covid-19-tempe-tests-wastewater/> [Accessed 22 September 2021].
Newseu.cgtn.com. 2019. Netherlands leads the way with nationwide COVID-19 sewage testing. [online] Available at: <https://newseu.cgtn.com/news/2020-07-21/Netherlands-leads-the-way-with-nationwide-COVID-19-sewage-testing-ShzEz63aMg/index.html> [Accessed 21 September 2021].
Polo, D., Quintela-Baluja, M., Corbishley, A., Jones, D., Singer, A., Graham, D. and Romalde, J., 2020. Making waves: Wastewater-based epidemiology for COVID-19 – approaches and challenges for surveillance and prediction. Water Research, 186, p.116404.
Ukri.org. 2020. UKRI-funded research supports COVID-19 sewage tracking system. [online] Available at: <https://www.ukri.org/news/ukri-funded-research-supports-covid-19-sewage-tracking-system/> [Accessed 19 September 2021].