Why people broadcast their location?
Foursquare and other Location Sharing Services (or Location Based Social Networks) have been used for marketing purposes from the begging of their existence. In order to investigate what value does those networks bring to marketers we need to understand what is the user’s motivation for location sharing. Well of course each of us knows why we broadcast our location to friends, but until its proved by science these are only personal impressions.
In the paper “I’m the mayor of my house: examining why people use Foursquare” Janne Lindqvist have investigated the topic. The quantitative survey with 219 participants revealed several motivators for participants that can have some relevance for marketers:
- Gaming, fun, badges – the most perceived value seems to be linked with the element of gaming, collecting points and badges contributes to the perceived fun of Foursquare.
- Social connection – interacting with friends seems to have a big value for users. The most important aspects are: knowing where the friends are and keeping in touch with them and checking-in to the same places and the same time. The social aspect of Foursquare is very important here, majority of participants claim that Foursquare is fun because their friends are using it.
- Place discovery – majority of users have discovered a new places or where motivated to go to new places because of Foursquare. Most participants where pleased with tips about venues that they have seen on the service. The discounts offered by venues were not that important for users – less than half of them addressed it as a motivation.
Where? When? How often?
The other significant issue is linked with the question: where when and how often do people check-in? The same research displays on a figure below frequency of check-ins for various places.
From the bar charts one can observe that restaurants and bars are the most popular places to check-in at even several times a week, which seems to prove the social and place discovery usage model of Foursquare. From the other hand participants hardly ever check-in at schools and homes, which might be caused by privacy concerns. There is a small group of users that are willing to share their home location and a bigger one that share work location even more than once a day. The survey showed that there are people who are interested in gaining as many points, badges, and mayorships as possible, and check-in everywhere.
The other research by Cheng investigated patterns from more than 22 million check-ins globally. Generated from the data tag cloud of the most popular venues that users check-in shows
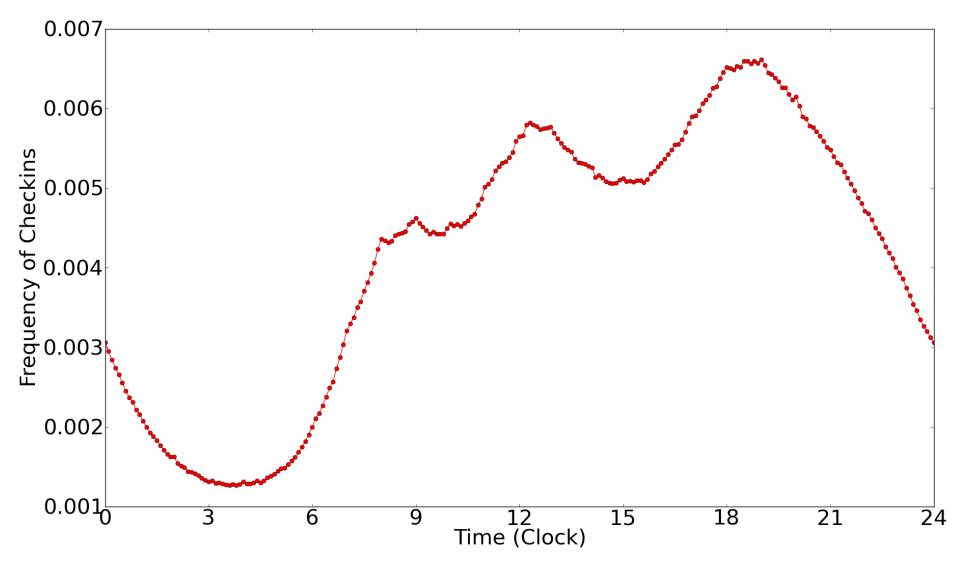
that the most popular places are restaurants, coffee shops, stores, airports, and other venues reflecting daily activity (e.g. fitness, pubs, church). The result seems to prove several points from the previous paper presented. Cheng researched as well the temporal distribution of check-ins in the World:
This pattern provides a glimpse into the global daily activity intensity. One can observe there three major peaks: one around 9am, one around 12pm, and one around 6pm.
Conclusions
The end purpose of social media is not to simply push out a message through yet another channel, but to deliver a message in a way that is both compelling and sharable, and that the recipients will want to share with their network. Marketers using Location Sharing Services must look at ways in which they can provide an interactive experience in-store that leverage the technology in the pocket of their visitors—an experience that will convert them from browsers to buyers and from one-time customers to loyal fans who act as advocates in both the real and virtual worlds. You will not do it with a simple discounts, the study proved the gaming and social aspect is more important. Discounts – yes, but make them more valuable and let customers be more engaged to get them. They will come back for more. Social-gamification – this seems to be the key to success.


 Why people broadcast their location?