#Featured
#Fun
Top 9 maps and charts that explain Super Bowl
Each year, on a Sunday at the end of January or beginning of February, tens of millions of Americans declare their unofficial holiday. More than half the adult population in the US watch The Super Bowl, which determines the championship of American football.
The maps and charts below try to capture an essence of this fantastic event.
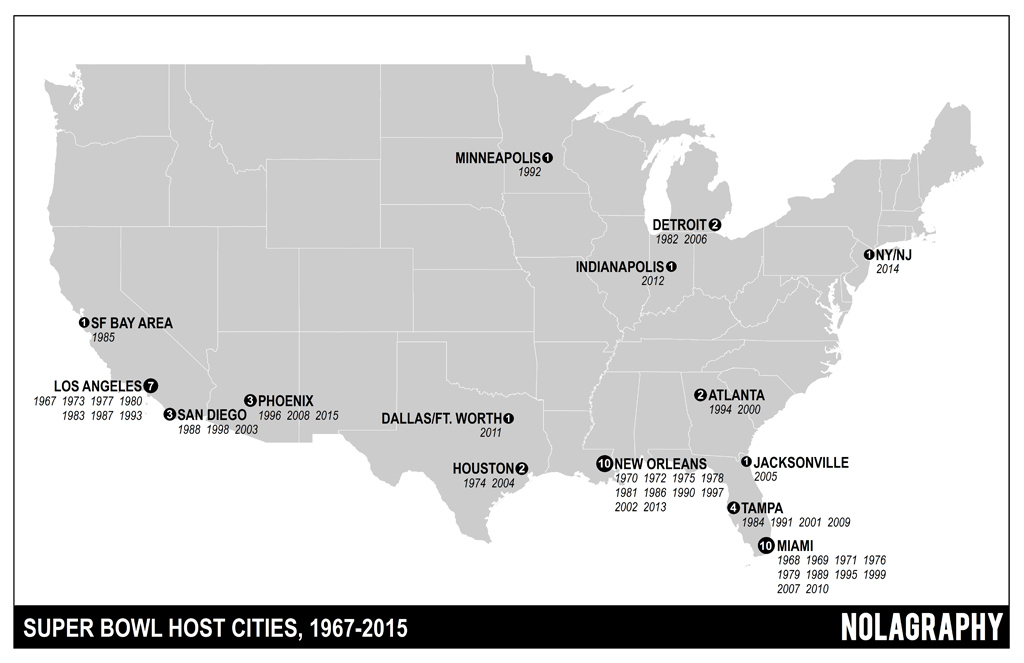
1. Super Bowl host cities 1967-2015
source: nolagraphy
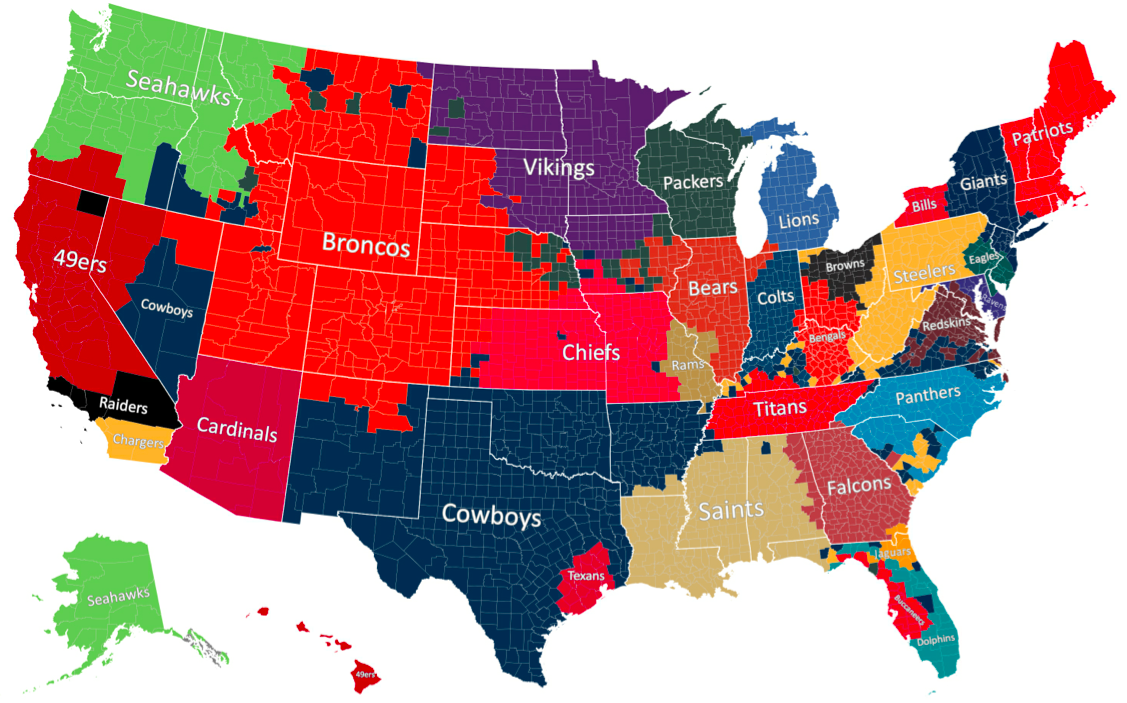
2. Map of NFL Fandom
Each county is color-coded based on which official team Facebook fan page has the most ‘Likes’ from people who live in that county.
source: The Atlantic
3. Number of Super Bowl championships per NFL teams
source: Business Insider
4. List of Super Bowl Winners 1967-2017
| Year | No | Winner | Loser | Score | Venue |
| 2017 | 51 | New England Patriots | Atlanta Falcons | 34-28 | Houston |
| 2016 | 50 | Denver Broncos | Carolina Panthers | 24–10 | Santa Clara |
| 2015 | XLIX | New England Patriots | Seattle Seahawks | 28-24 | Arizona |
| 2014 | XLVIII | Seattle Seahawks | Denver Broncos | 43-8 | New jersey |
| 2013 | XLVII | Baltimore Ravens | San Francisco 49ers | 34-31 | New Orleans |
| 2012 | XLVI | New York Giants | New England Patriots | 21-17 | Indianapolis |
| 2011 | XLV | Green Bay Packers | Pittsburgh Steelers | 31-25 | Texas |
| 2010 | XLIV | New Orleans Saints | Indianapolis Colts | 31-17 | Miami |
| 2009 | XLIII | Pittsburgh Steelers | Arizona Cardinals | 27-23 | Tampa |
| 2008 | XLII | New York Giants | New England Patriots | 17-14 | Arizona |
| 2007 | XLI | Indianapolis Colts | Chicago Bears | 29-17 | Miami |
| 2006 | XL | Pittsburgh | Seattle | 21-10 | Detroit |
| 2005 | XXXIX | New England | Philadelphia | 24-21 | Jacksonville |
| 2004 | XXXVIII | New England | Carolina | 32-29 | Houston |
| 2003 | XXXVII | Tampa Bay | Oakland | 48-21 | San Diego |
| 2002 | XXXVI | New England | St Louis | 20-17 | New Orleans |
| 2001 | XXXV | Baltimore | NY Giants | 34-7 | Tampa |
| 2000 | XXXIV | St Louis | Tennessee | 23-16 | Atlanta |
| 1999 | XXXIII | Denver | Atlanta | 34-19 | Miami |
| 1998 | XXXII | Denver | Green Bay | 31-24 | San Diego |
| 1997 | XXXI | Green Bay | New England | 35-21 | N Orleans |
| 1996 | XXX | Dallas | Pittsburgh | 27-17 | Tempe |
| 1995 | XXIX | San Francisco | San Diego | 49-26 | Miami |
| 1994 | XXVIII | Dallas | Buffalo | 30-13 | Atlanta |
| 1993 | XXVII | Dallas | Buffalo | 53-17 | Pasadena |
| 1992 | XXVI | Washington | Buffalo | 37-24 | Minneapolis |
| 1991 | XXV | NY Giants | Buffalo | 20-19 | Tampa |
| 1990 | XXIV | San Francisco | Denver | 55-10 | N Orleans |
| 1989 | XXIII | San Francisco | Cincinnati | 20-16 | Miami |
| 1988 | XXII | Washington | Denver | 42-10 | San Diego |
| 1987 | XXI | NY Giants | Denver | 39-20 | Pasadena |
| 1986 | XX | Chicago | New England | 46-10 | N Orleans |
| 1985 | XIX | San Francisco | Miami | 38-16 | Stanford |
| 1984 | XVIII | LA Raiders | Washington | 38-9 | Tampa |
| 1983 | XVII | Washington | Miami | 27-17 | Pasadena |
| 1982 | XVI | San Francisco | Cincinnati | 26-21 | Pontiac |
| 1981 | XV | Oakland | Philadelphia | 27-10 | N Orleans |
| 1980 | XIV | Pittsburgh | LA Rams | 31-19 | Pasadena |
| 1979 | XIII | Pittsburgh | Dallas | 35-31 | Miami |
| 1978 | XII | Dallas | Denver | 27-10 | N Orleans |
| 1977 | XI | Oakland | Minnesota | 32-14 | Pasadena |
| 1976 | X | Pittsburgh | Dallas | 21-17 | Miami |
| 1975 | IX | Pittsburgh | Minnesota | 16-6 | N Orleans |
| 1974 | VIII | Miami | Minnesota | 24-7 | Houston |
| 1973 | VII | Miami | Washington | 14-7 | Los Angeles |
| 1972 | VI | Dallas | Miami | 24-3 | N Orleans |
| 1971 | V | Baltimore | Dallas | 16-13 | Miami |
| 1970 | IV | Kansas City | Minnesota | 23-7 | N Orleans |
| 1969 | III | NY Jets | Baltimore | 16-7 | Miami |
| 1968 | II | Green Bay | Oakland | 33-14 | Miami |
| 1967 | I | Green Bay | Kansas City | 35-10 | Los Angeles |
5. History of football in the US
source: Bill sports maps
6. The Top-Searched Super Bowl Recipes by State
source: Eater
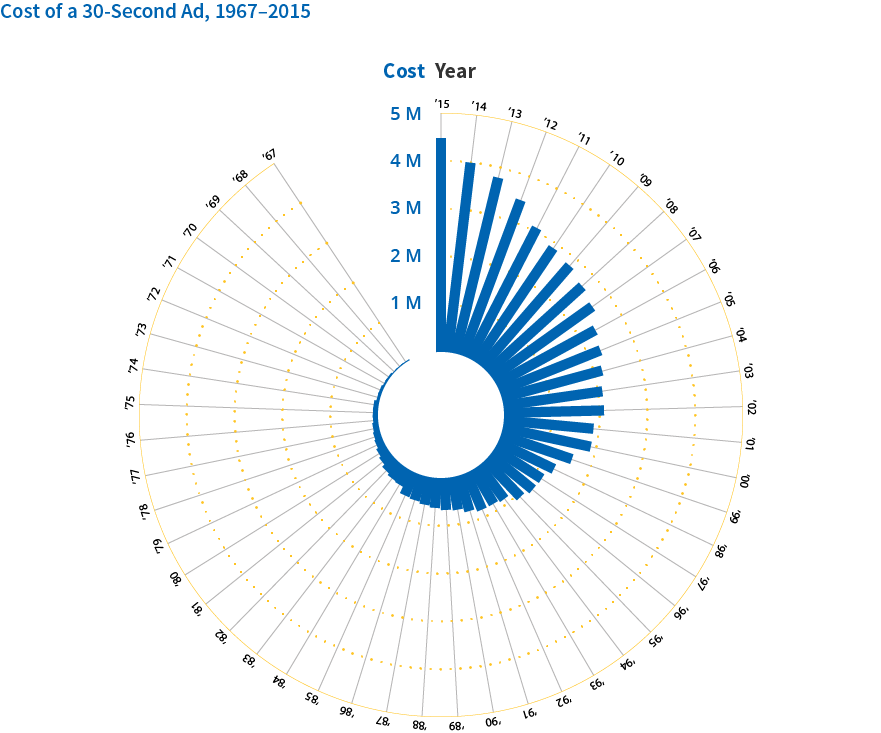
7. Cost of a 30 second Super Bowl ad 1967-2015
source: USA Today
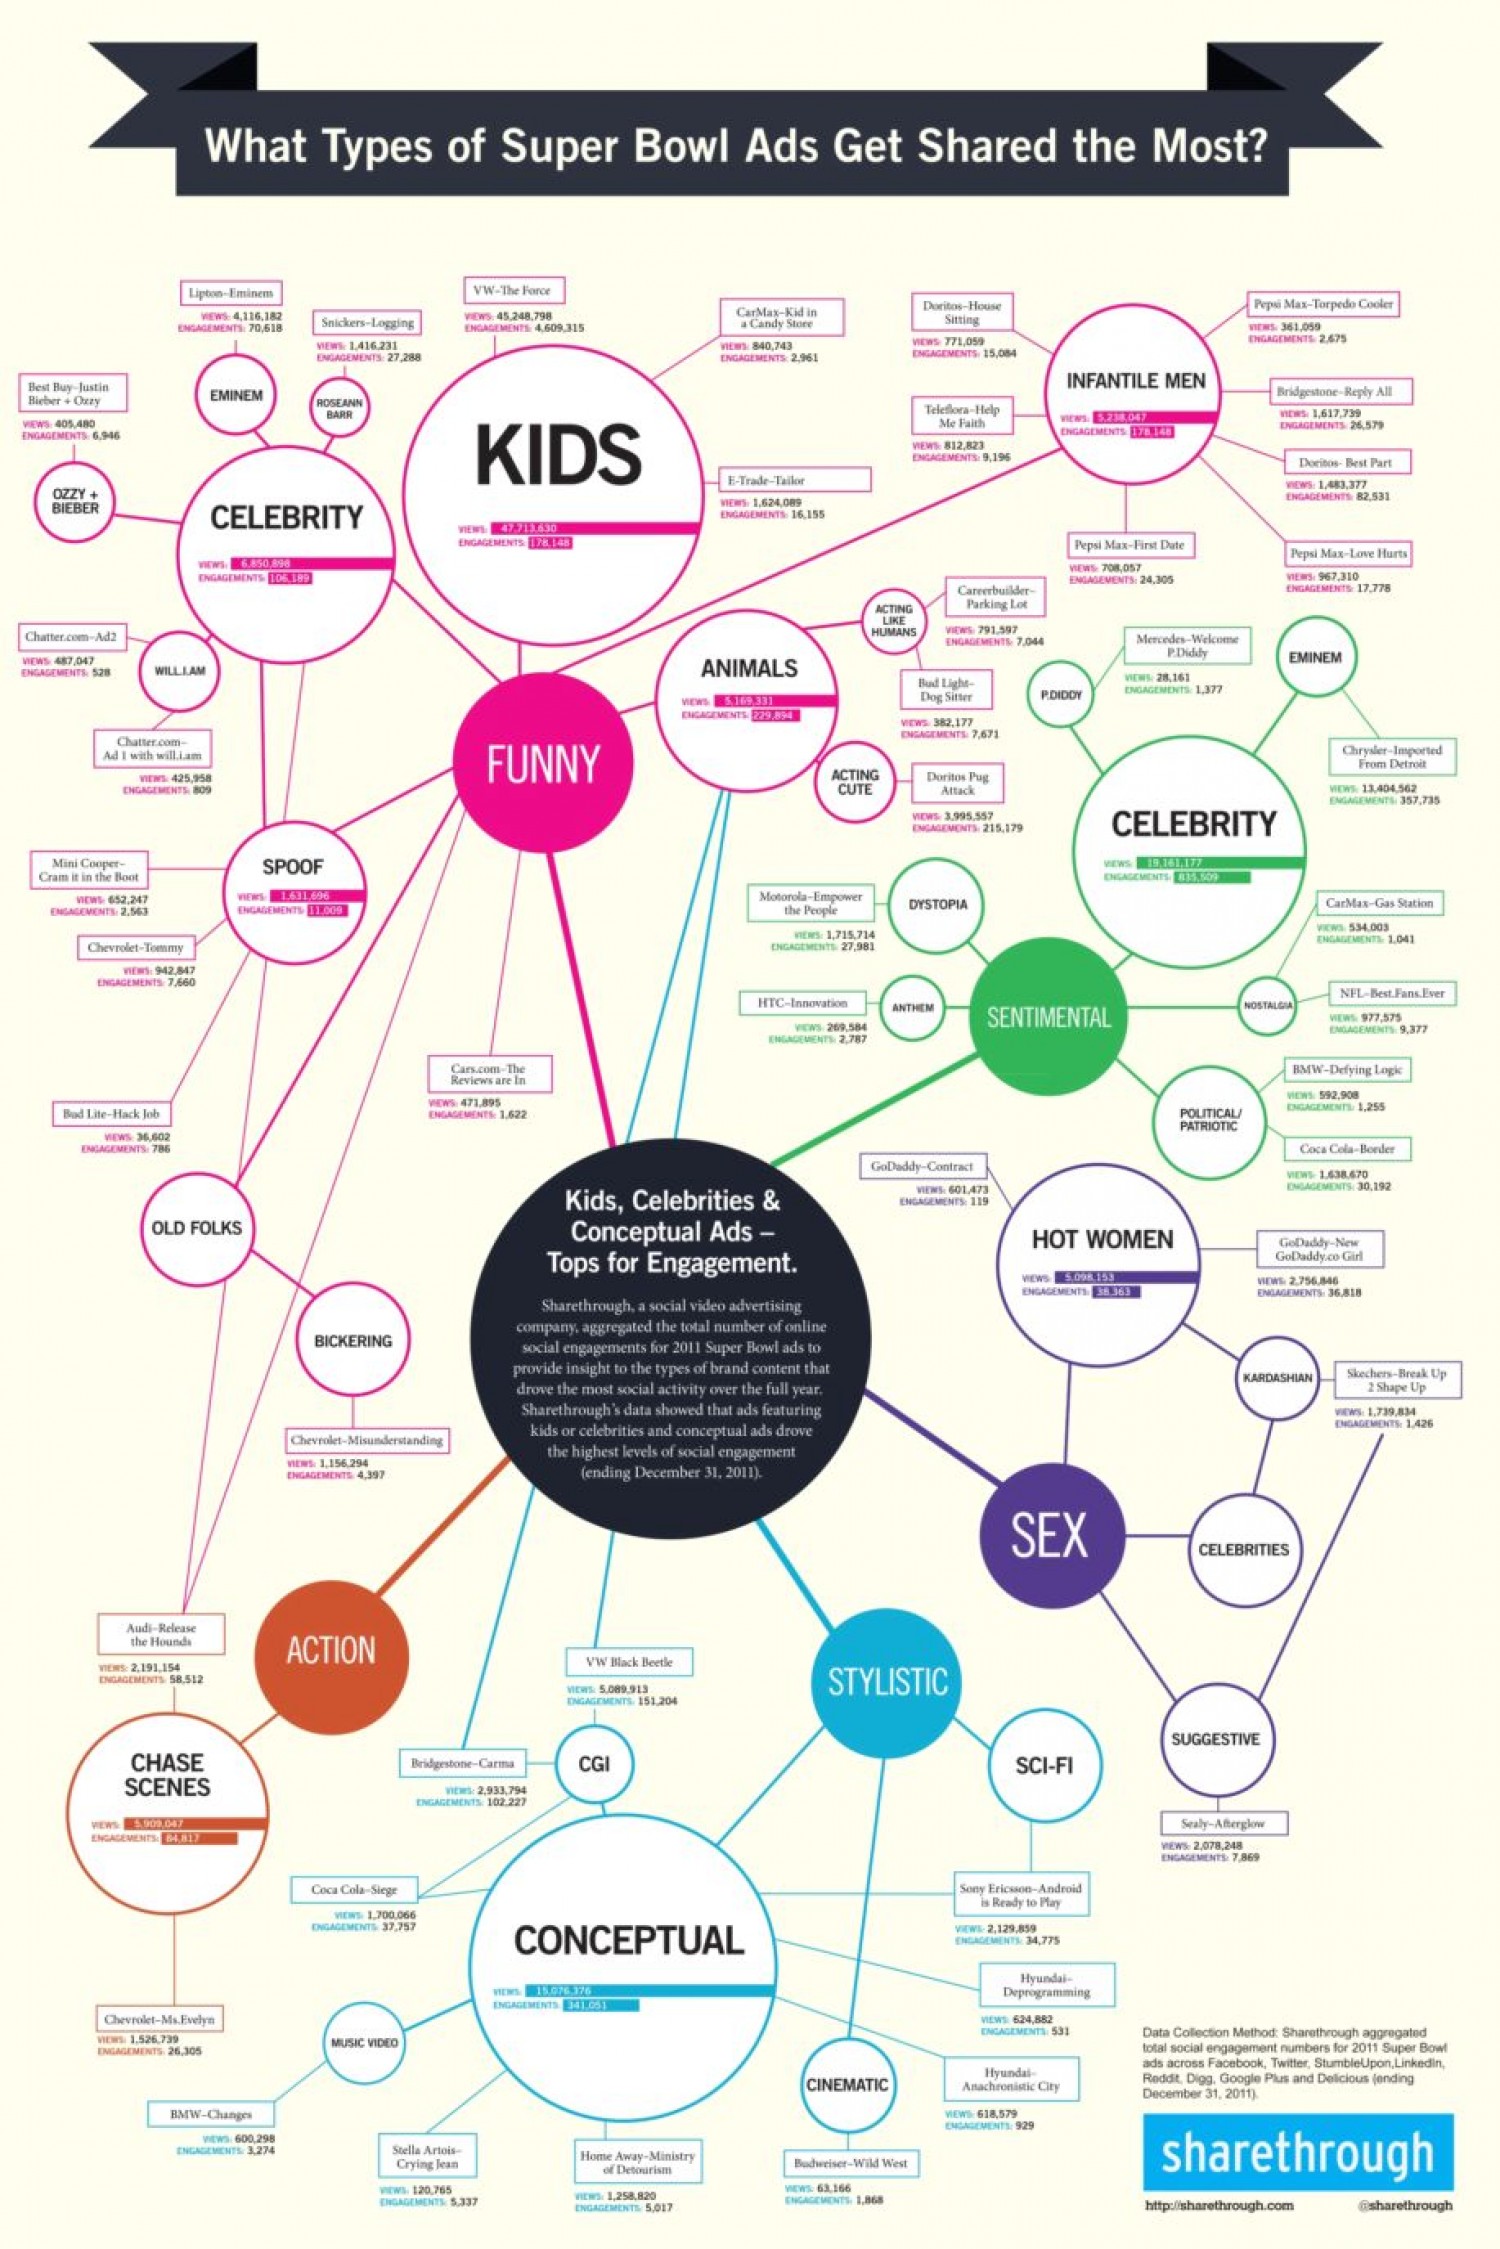
8. What Types of Superbowl Ads Get Shared the Most?
source: Visually
9. How big is Super Bowl
source: TvTome

#Featured
#Business
#Featured
#Ideas
#Science
Harnessing the Power of 30cm Satellite Data for Construction Mega Projects
#Environment
#Featured
#Science
Revolutionizing disaster response with very high–resolution satellite data tasking
#Featured
#Fun
#Ideas
The Geo Geek Gift Guide: 10 Christmas ideas for the geo geek in your life





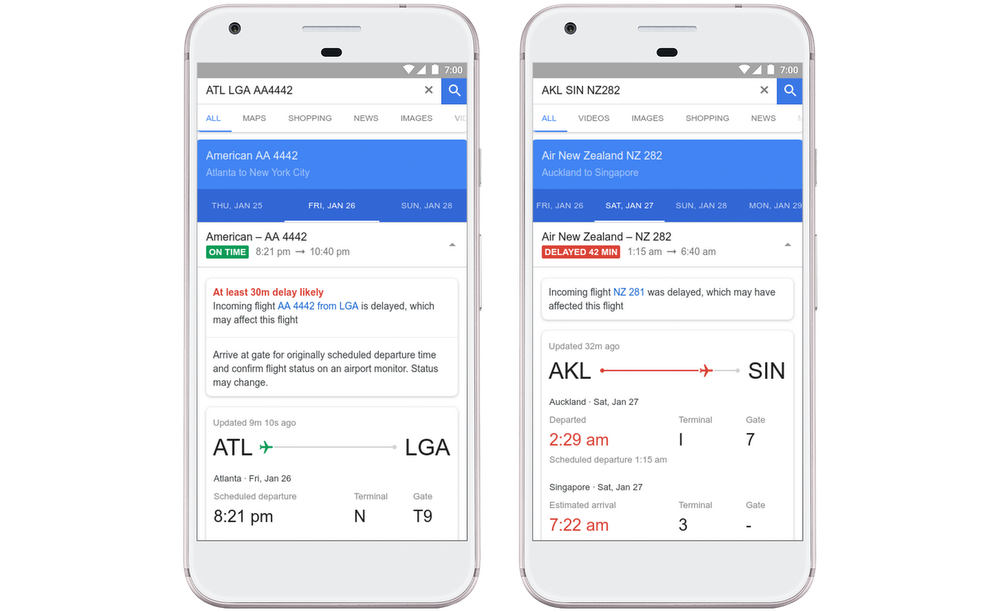

 The algos will comb the data to see what parameters are common between delayed flights – location, weather conditions, aircraft arriving late from the previous destination, etc. Once Google is at least 80% sure that these factors are conspiring in a manner that an airplane will be delayed, it will flag that information to the Flights app, and also specify the likely reason for the holdup – without waiting for or depending on the information coming in from the airlines.