
Every February 14, across the world flowers, chocolates and gifts are exchanged between loved ones, all in the name of St. Valentine. There are a number of Saints called Valentine who are honored on February 14. The day became associated with romantic love in the Middle Ages in England but the origins of the day goes back to Roman times when the fertility festivals where held all over Europe as the winter came to an end.
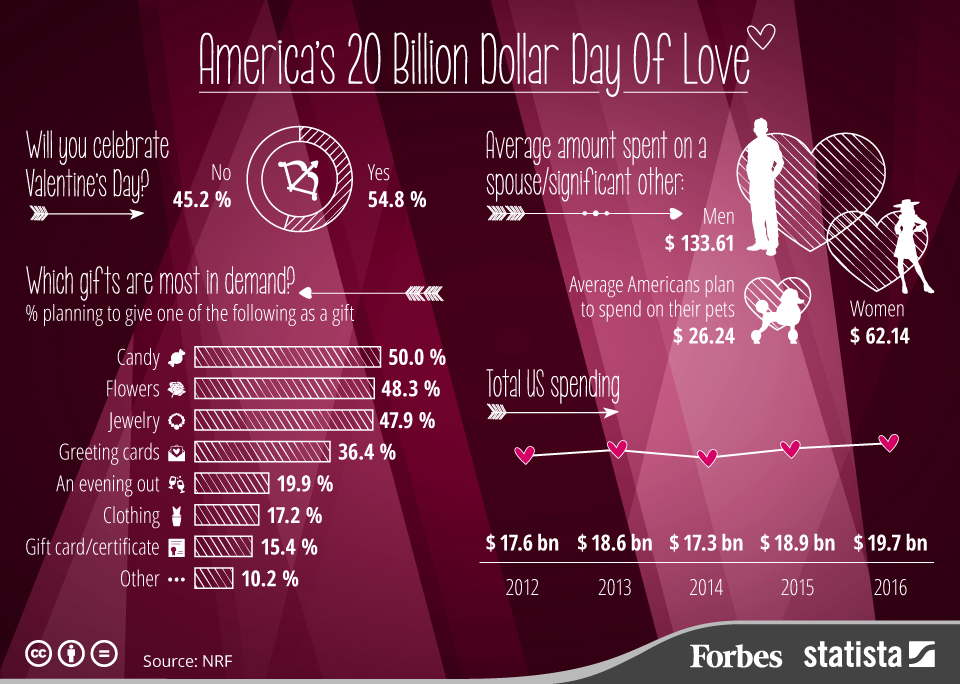
1. America’s $20 Billion Day Of Love
source: Forbes
2. The most popular Valentine’s Day Gift in the US in 2015
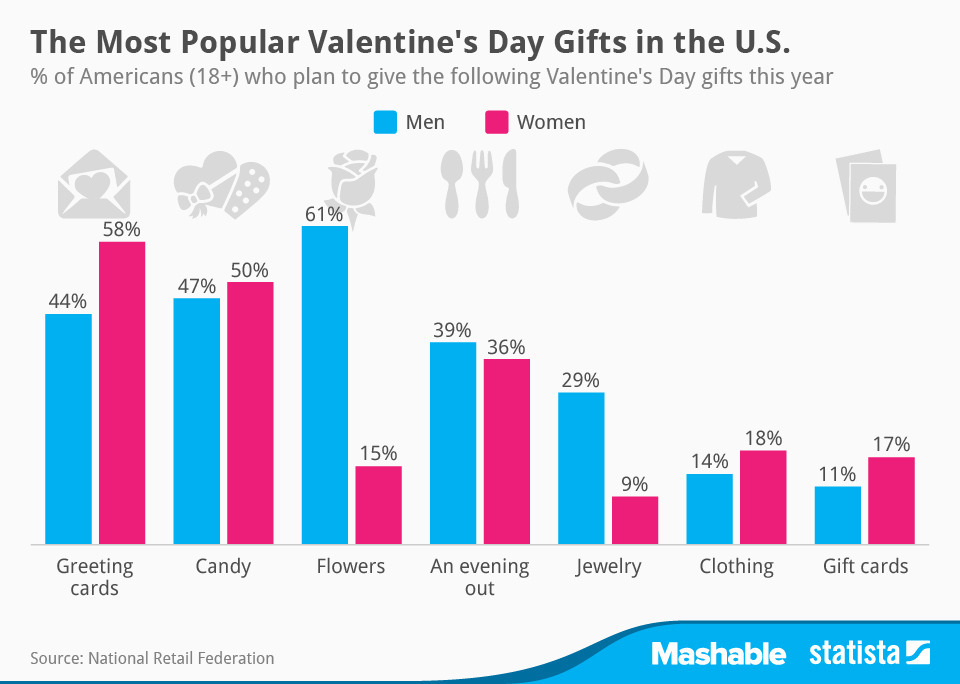
source: GoldenFleeceOnline
3. Valentine’s day spending in the United States
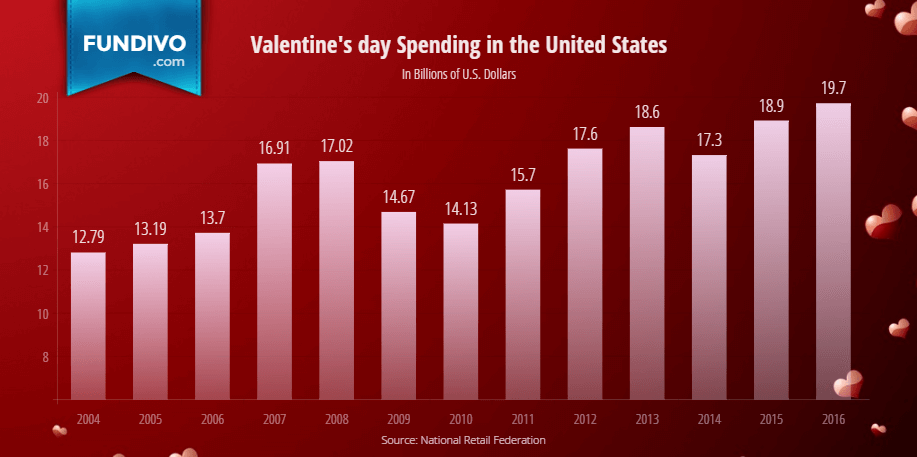
source: Fundivo
4. Map Shows the Most Googled Valentine’s Day Gifts in Every State
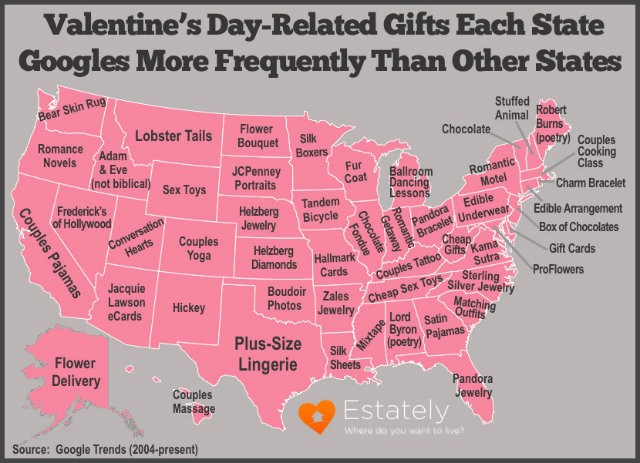
source: WideOpenCountry
5. Each state’s most popular romantic comedy
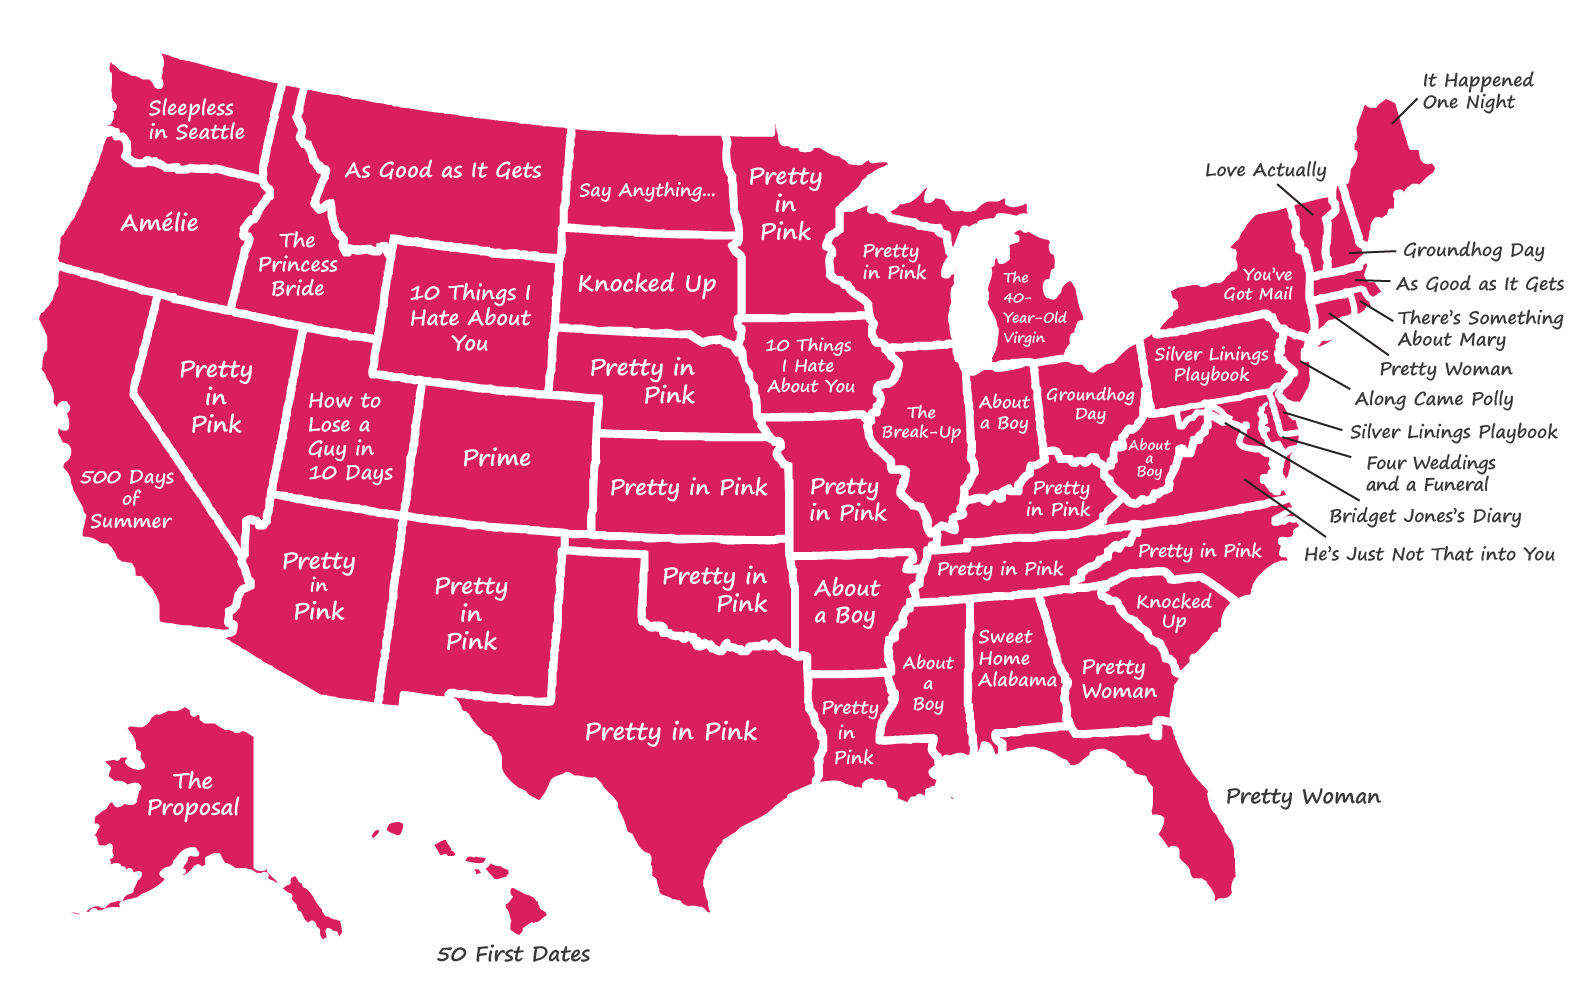
source: Seattle Times
6. What’s the point of Valentine’s Day
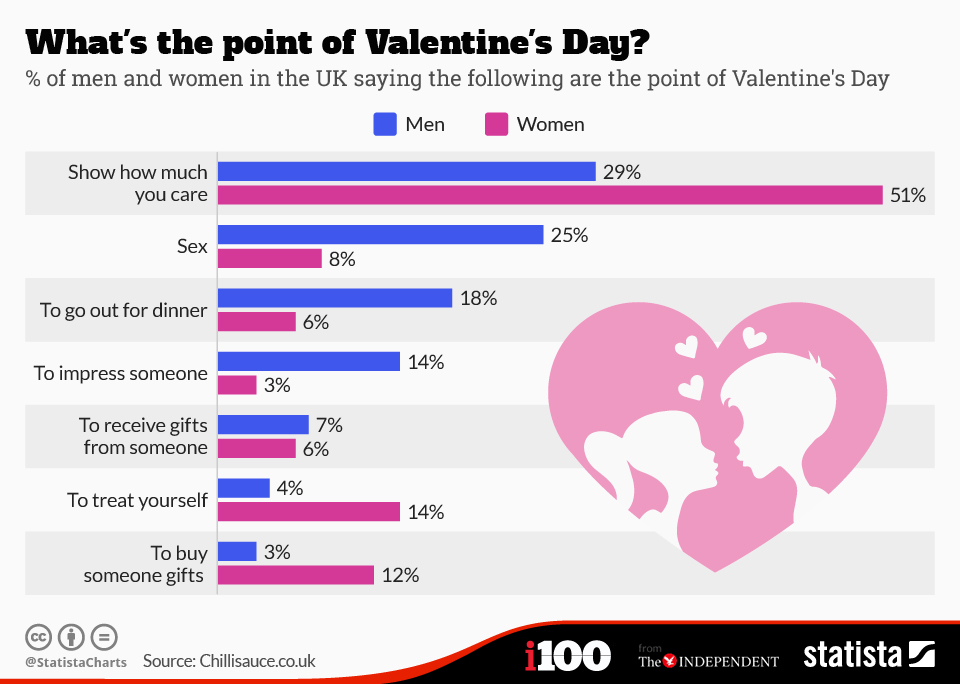
source: Statista
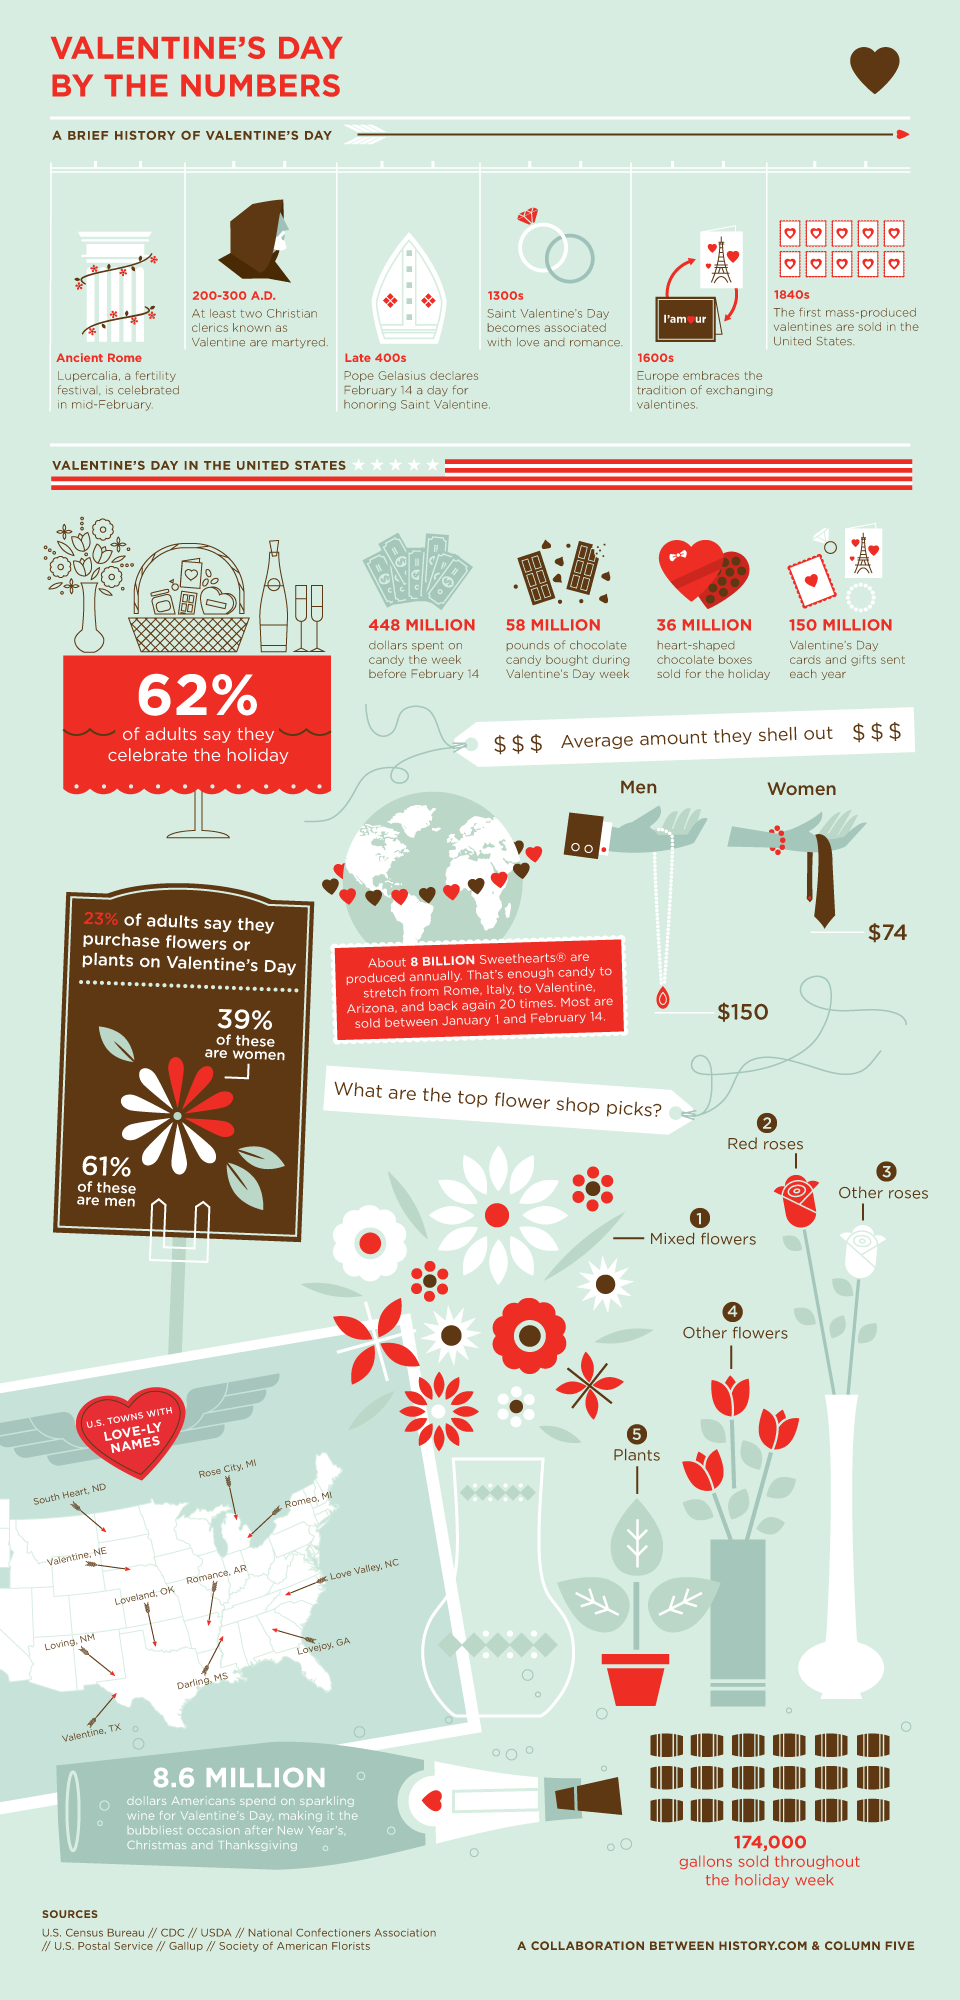
7. Valentine’s Day by the Numbers
8. Valentine’s Day Around the World

9. How to say ‘I love you’ around the world
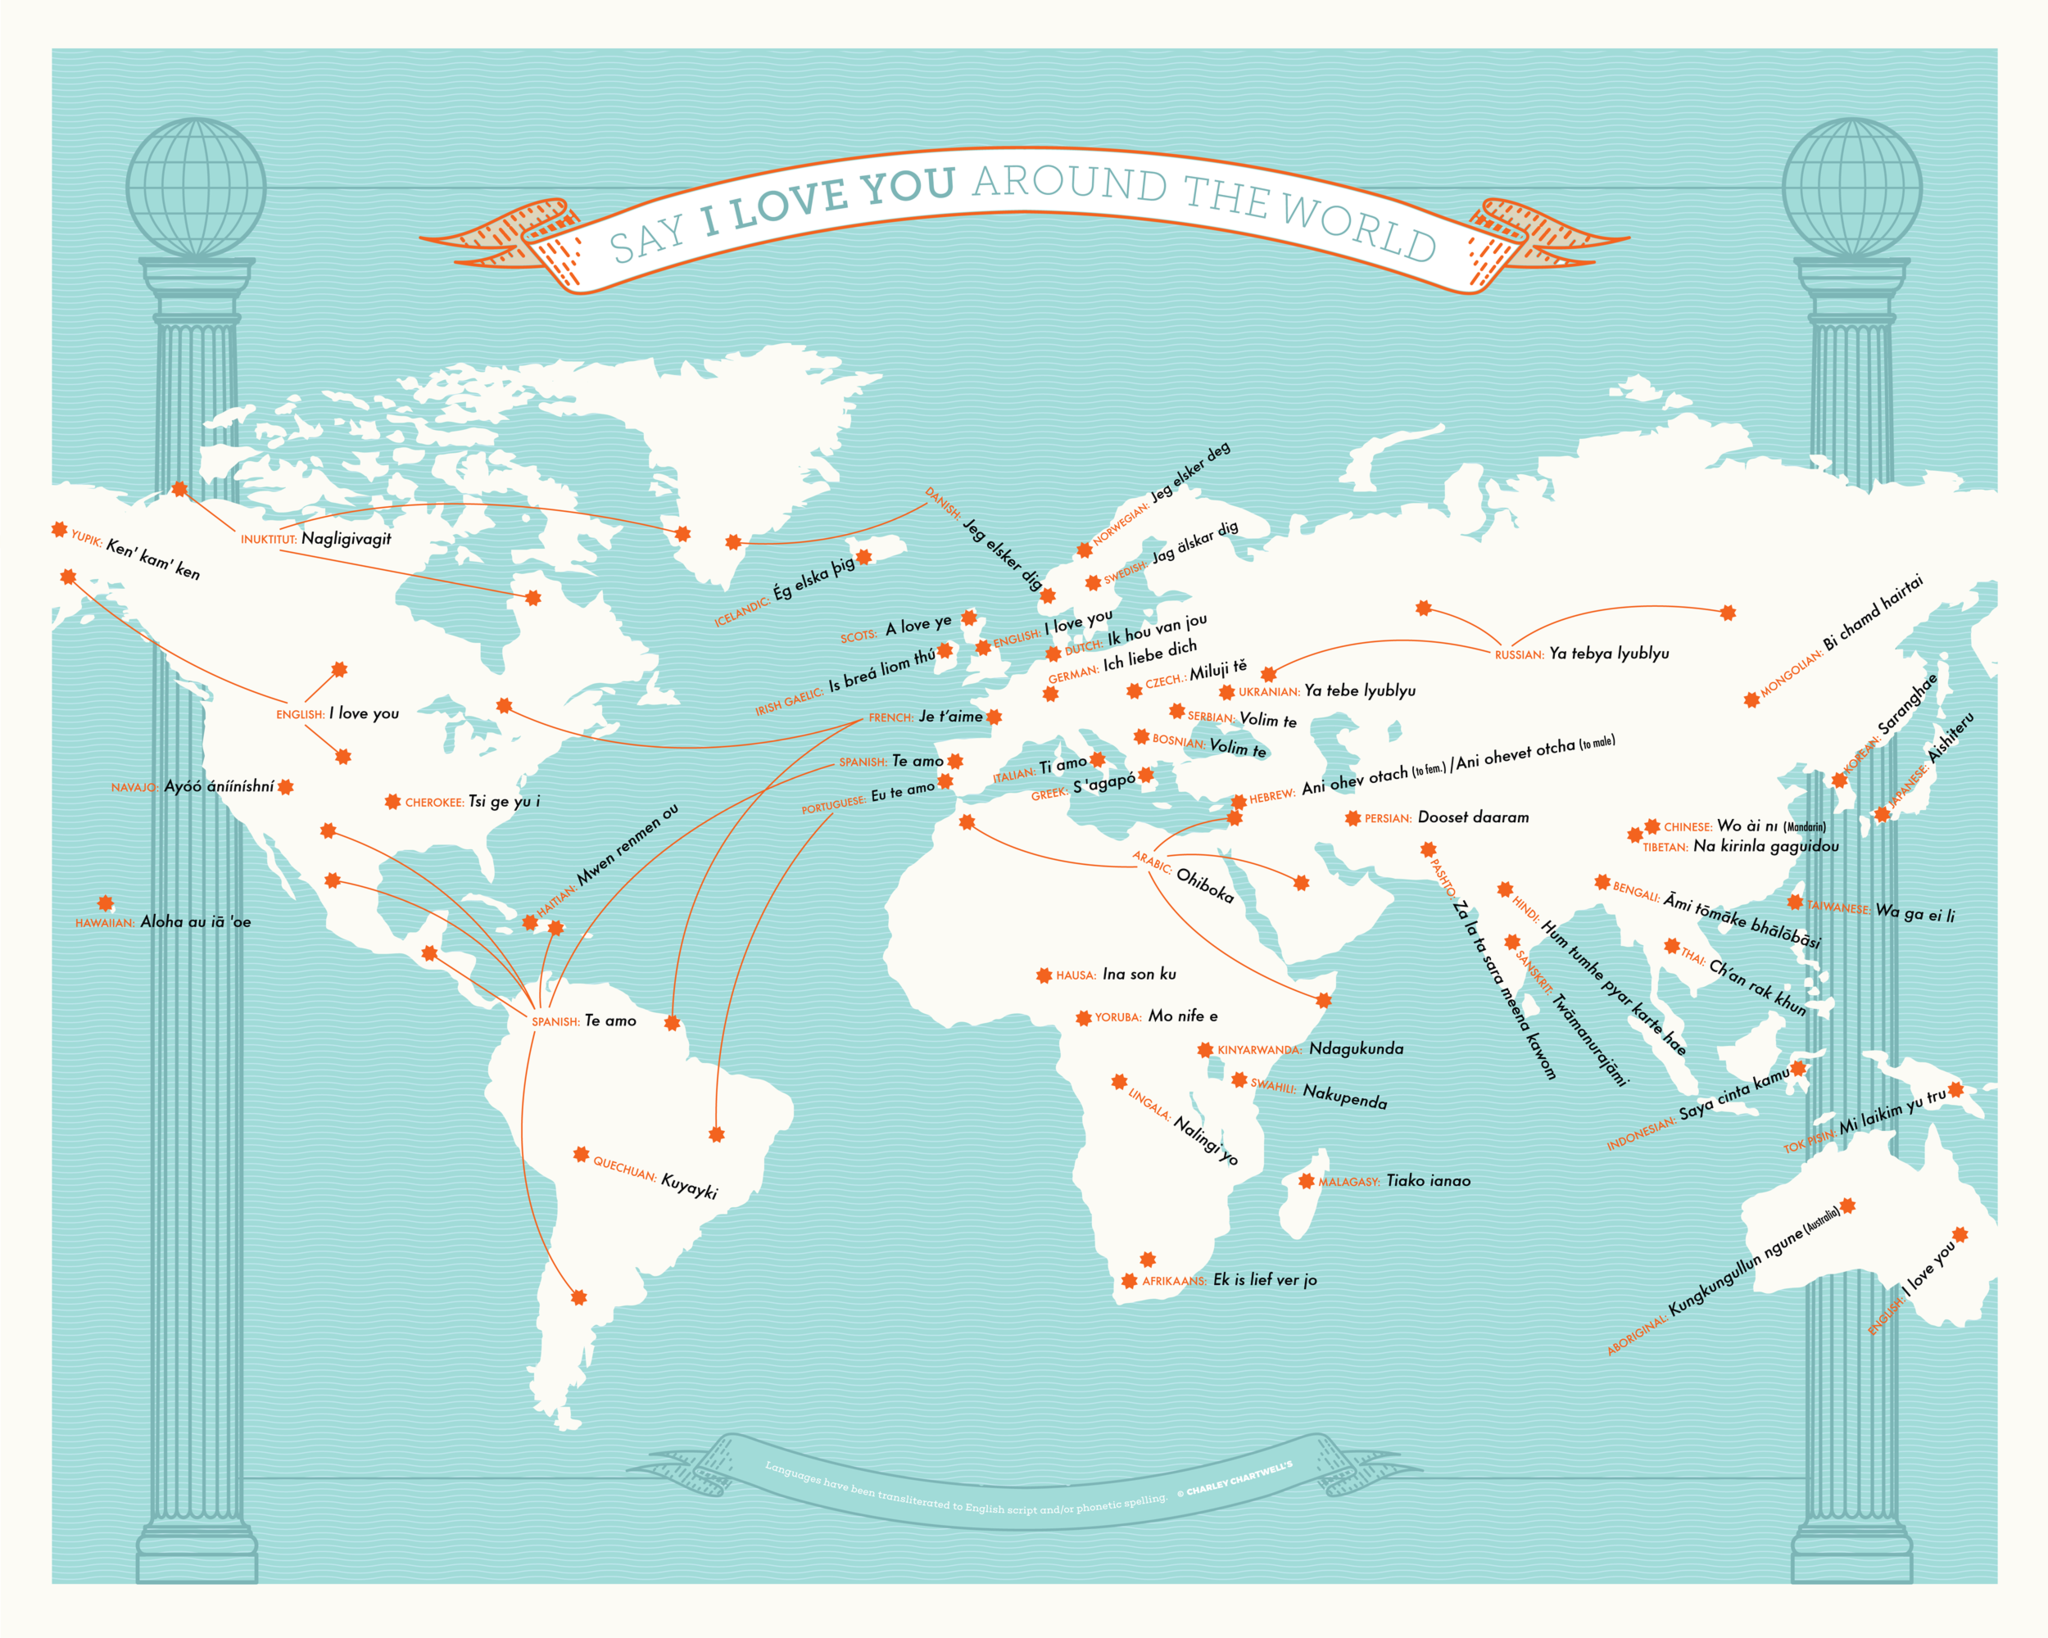
source: Charley Chartwell
10. The geography of chocolate
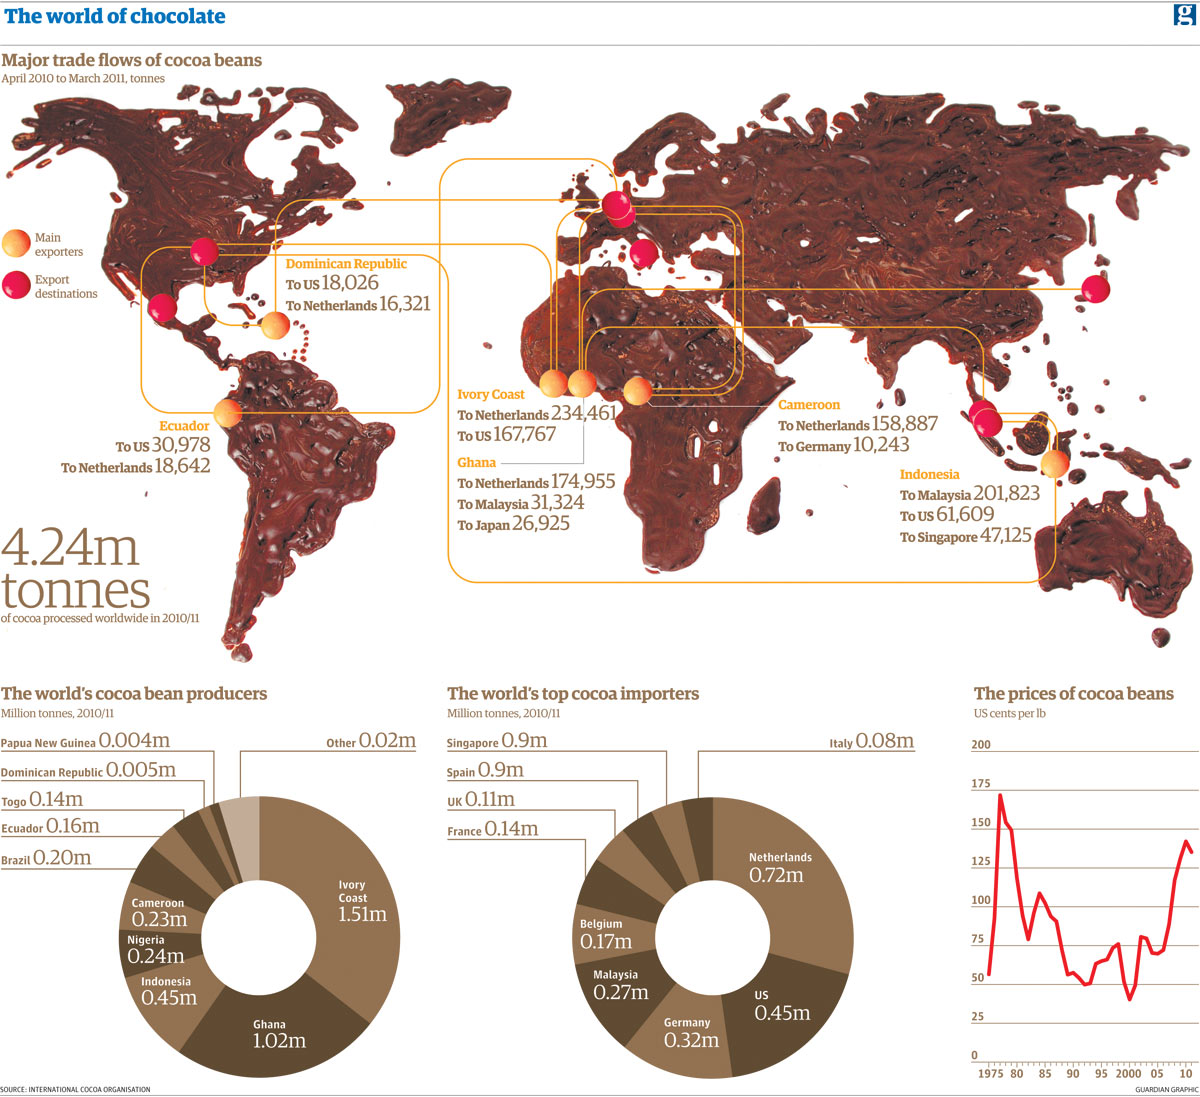
source: Guardian
11. Global flower production and trade map
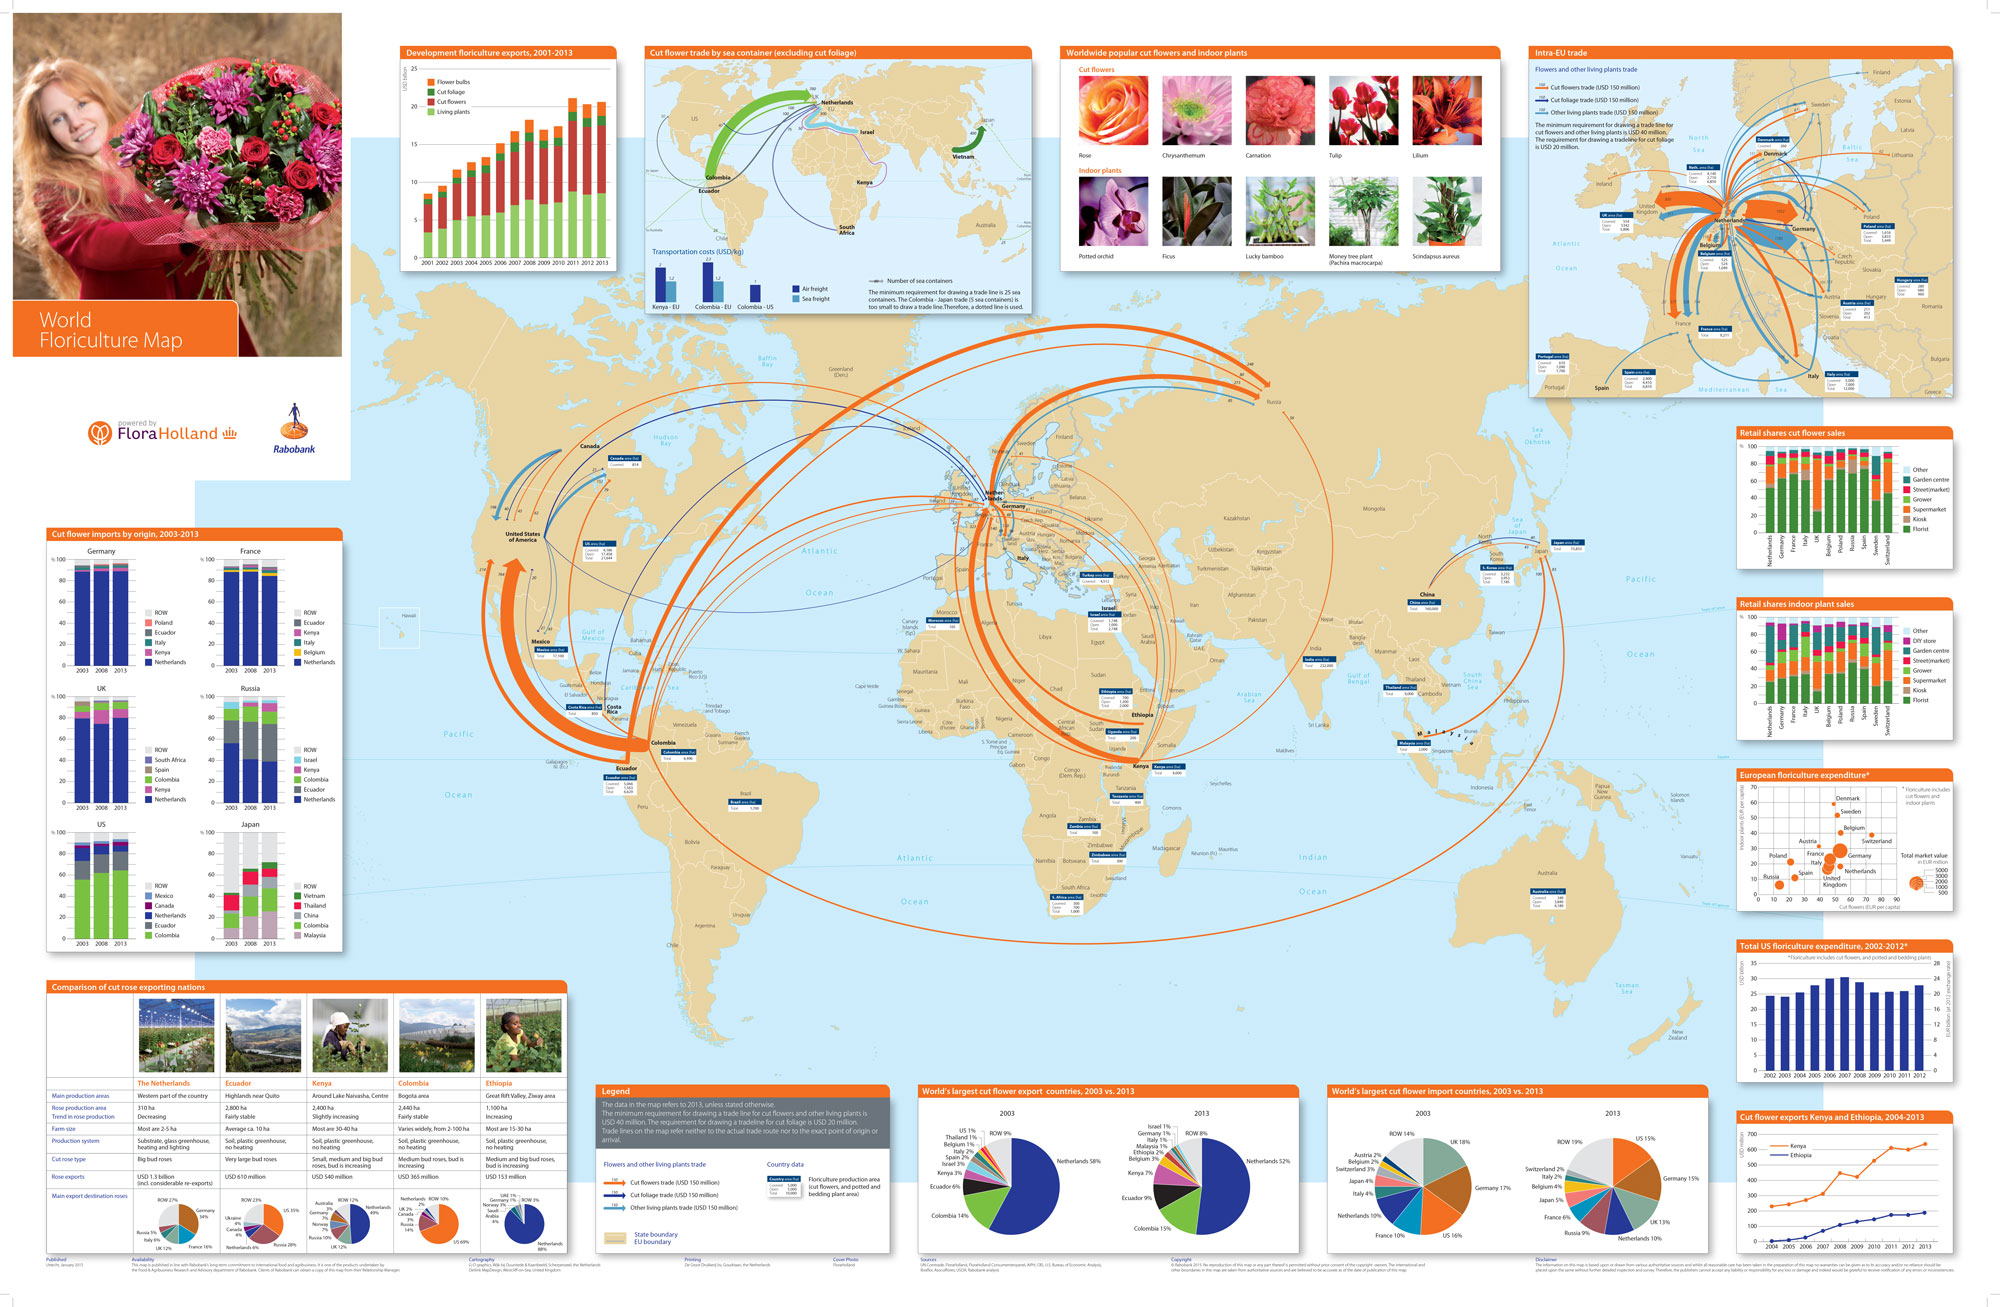
source: Rabobank
12. Most downloaded dating apps in 50 countries
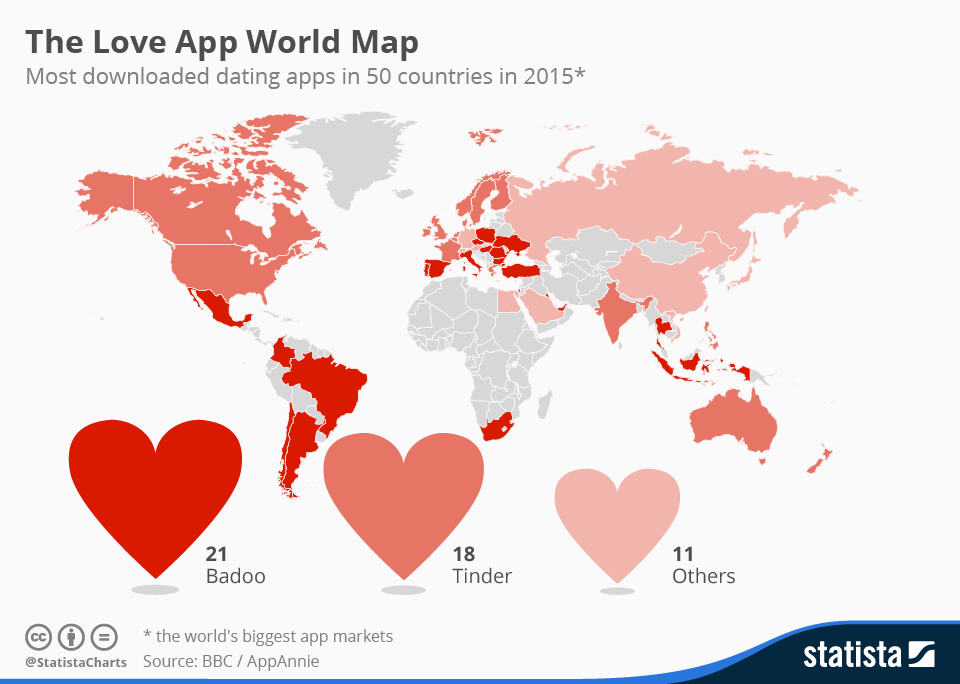
source: Agent Media
13. At What Age Do People Get Married Around the World?
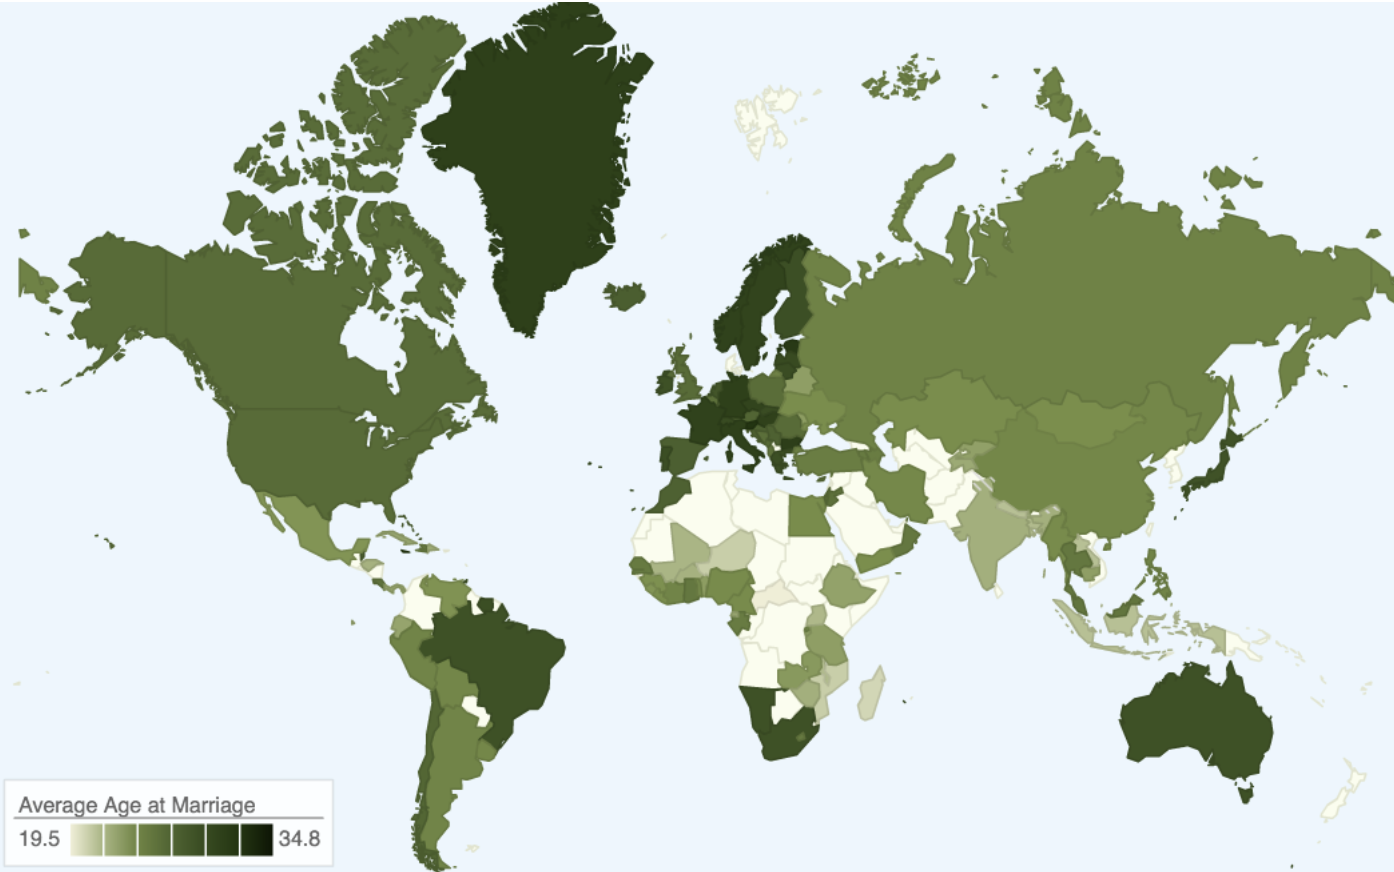
source: Pricenomics
14. How Your Hometown Affects Your Chances of Marriage
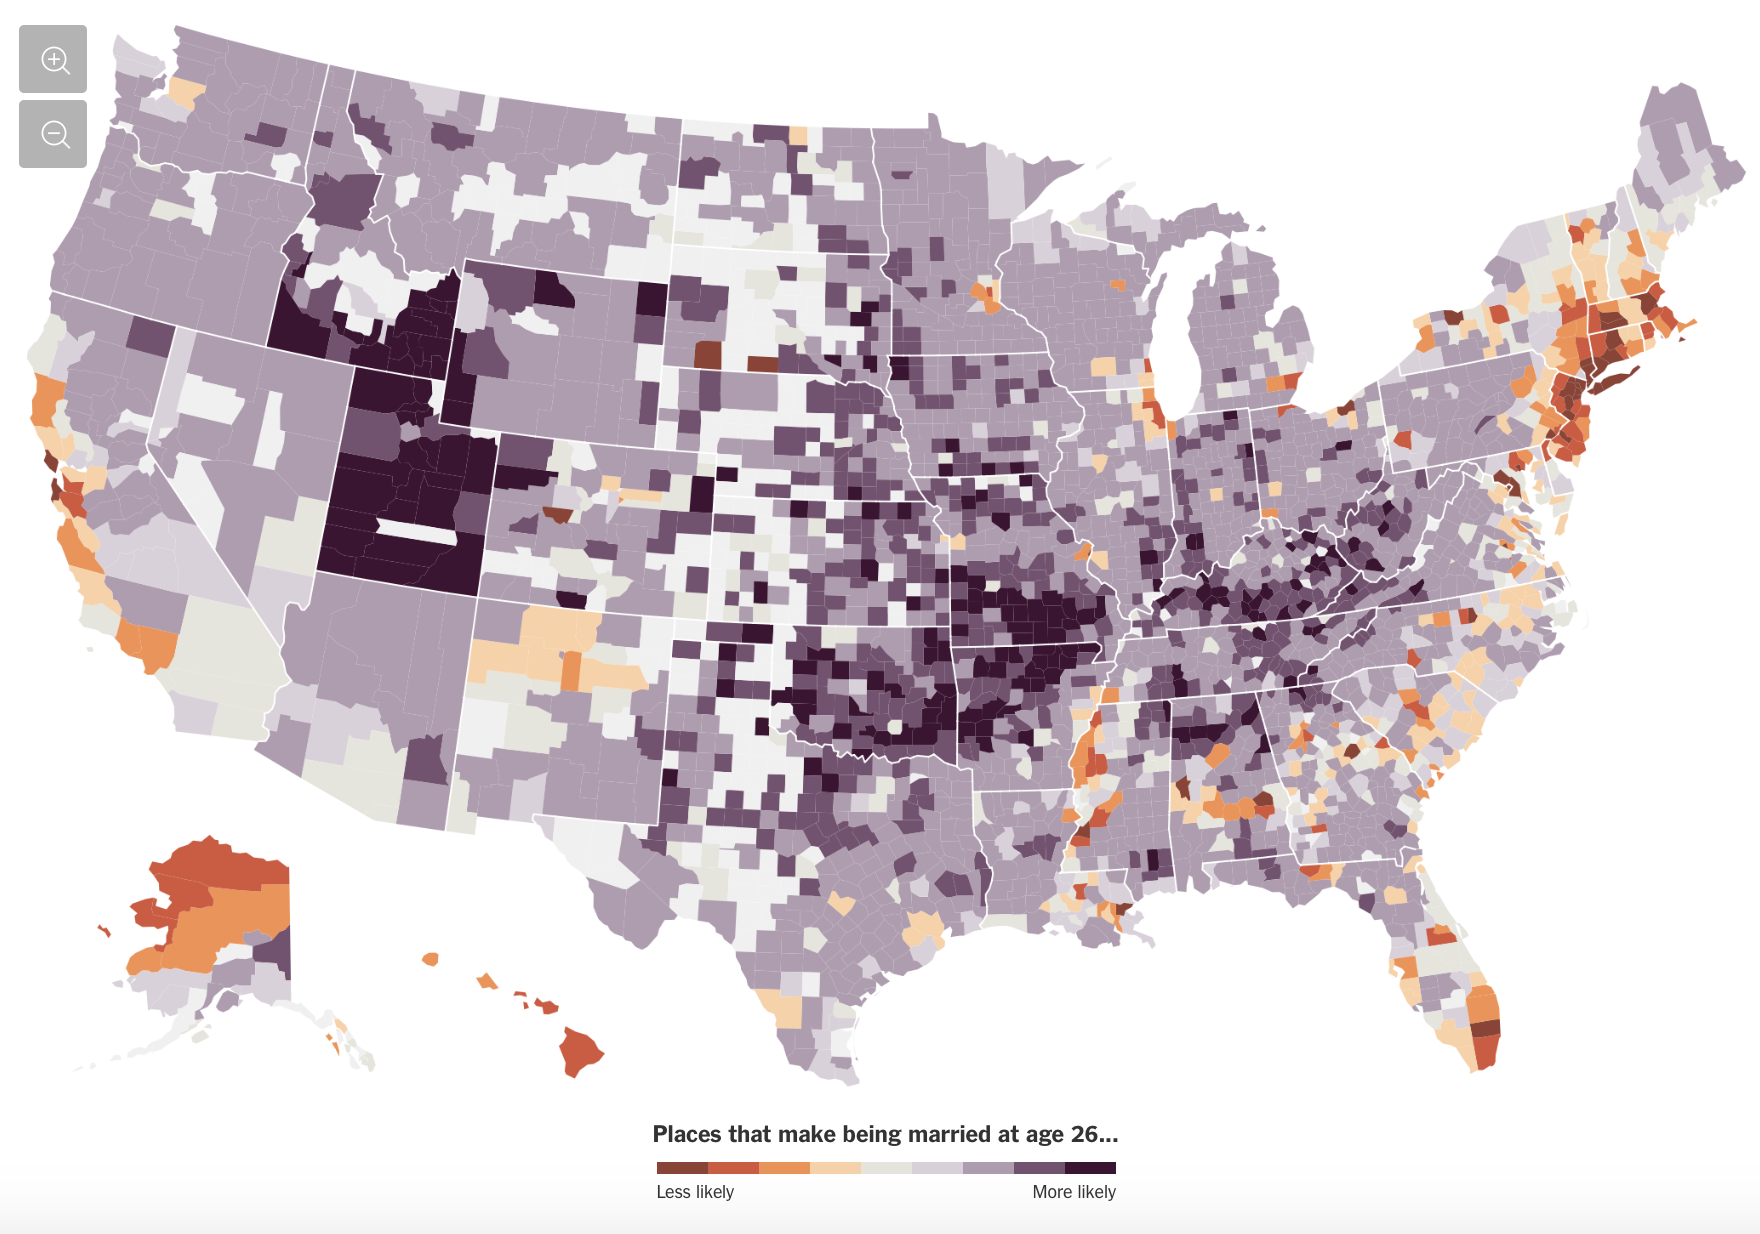
source: NY Times

#Featured

Next article

Before the games begun, meteorologists had predicted that 2018 Winter Olympics could be the coldest in the history of the games. They weren’t wrong. It is so cold in Pyeongchang, South Korea, events are getting delayed, spectators are leaving midway, and even the most experienced athletes have been left fazed. But while the frigid conditions on the ground may be punishing for humans, the view from the top is quite spectacular. See the Winter Olympics 2018 from the eyes of earth observation satellites…
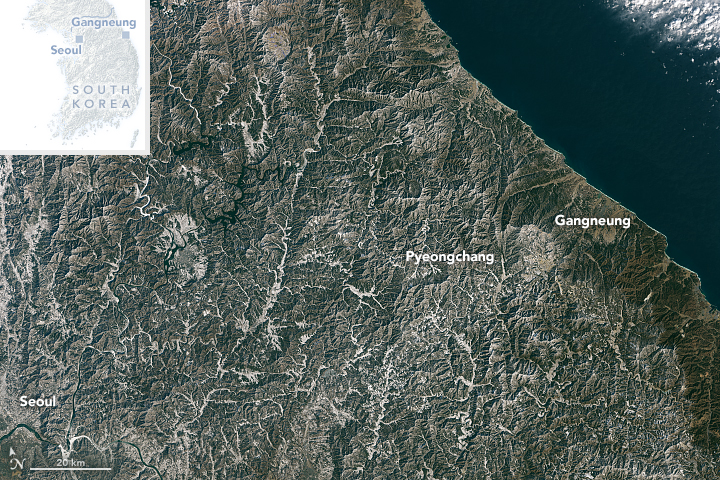
While all of the skiing and snowboarding events (as well as the opening ceremonies) will be held in Pyeongchang, Olympic ice events like hockey, speed skating, curling, and figure skating will be held in Gangneung. The natural-color image below, acquired by NASA’s LANDSAT 8 satellite on Jan 26, 2018, shows both the cities:
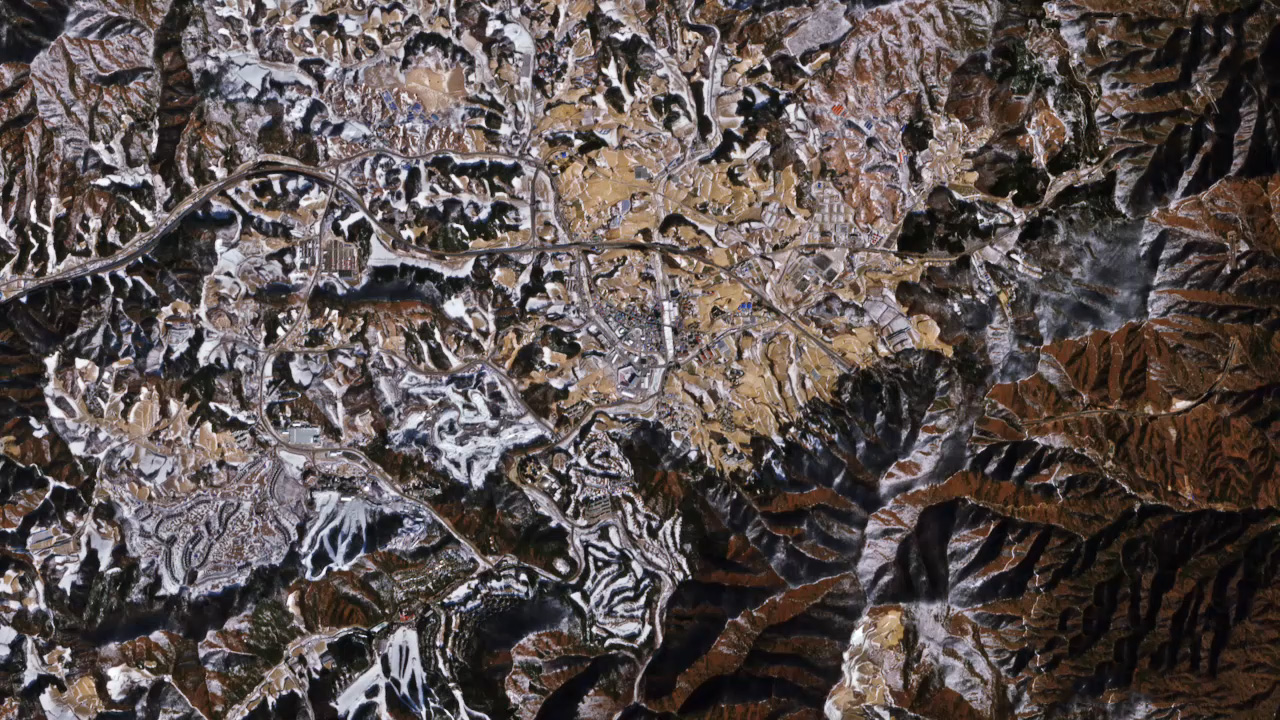
The image below was captured by ESA’s Copernicus Sentinel-2 mission on Jan 30, 2018. It shows the stunning view of the topography of the city of Pyeongchang:
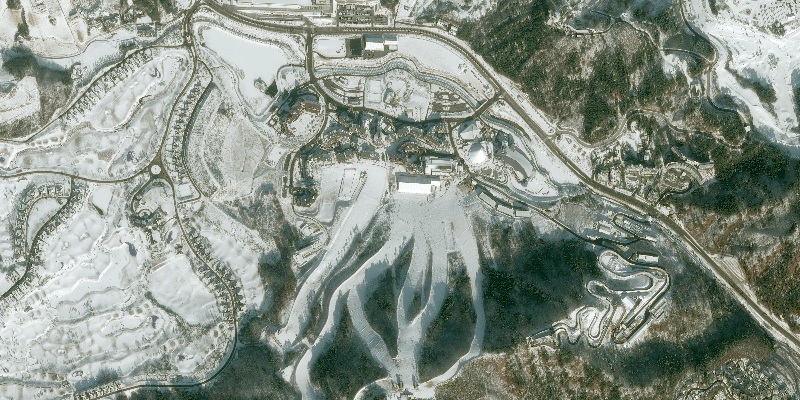
An Airbus Pléiades satellite caught the following four images immediately after the first snowfall in Pyeongchang in December 2017. Here you can see the sports facilities of the Alpensia Resort which are hosting Nordic, alpine and ice sports events:
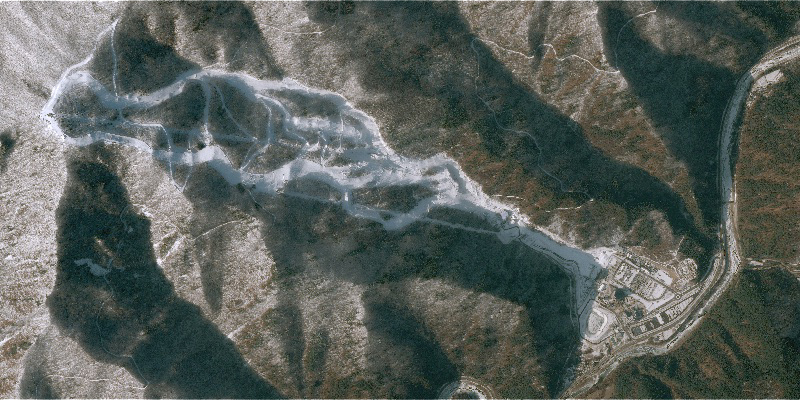
Below, the Jeongseon Alpine Centre is organizing the Super-G and combined events. An altitude drop of more than 800 meters is required for downhill ski events, over a length of 3.5 km. Check it out:
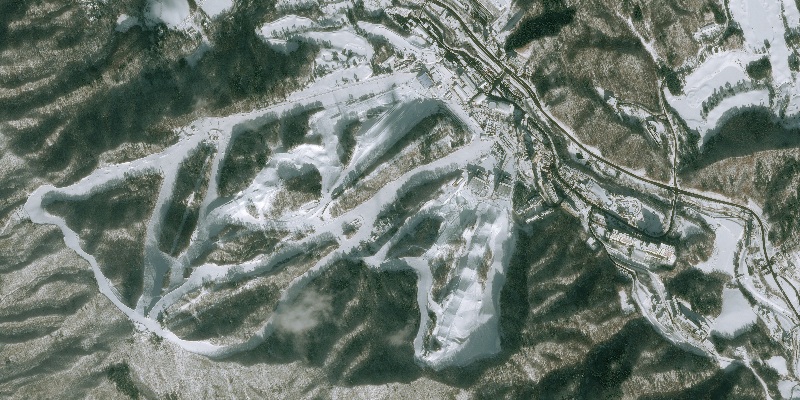
In the following image, you can marvel at the slopes of Bokwang Phoenix Park, one of the ski resorts closest to the South Korean capital of Seoul. Bokwang Phoenix Park is playing host to the freestyle skiing and snowboard competitions:
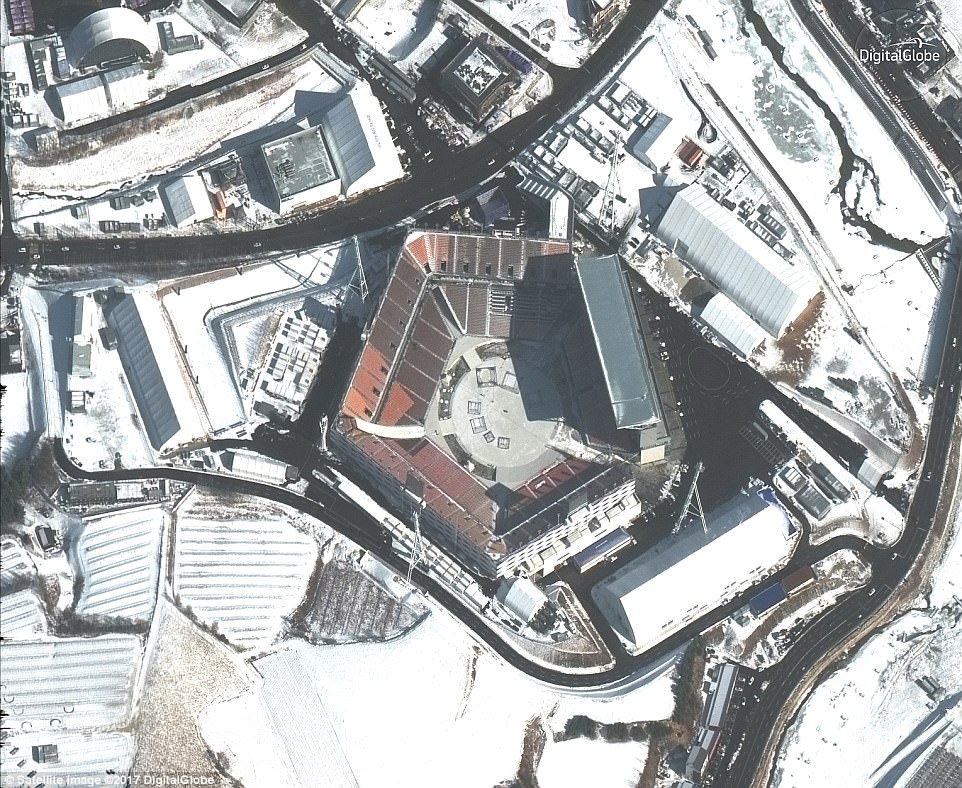
The image below was captured by DigitalGlobe’s WorldView-3 satellite. It shows the stadium where the opening ceremony was held. Since the stadium was built without a roof, the organizers had to bring in several measures to keep the spectators and athletes warm:
But for now, it’s Chill-1, Humans-0.