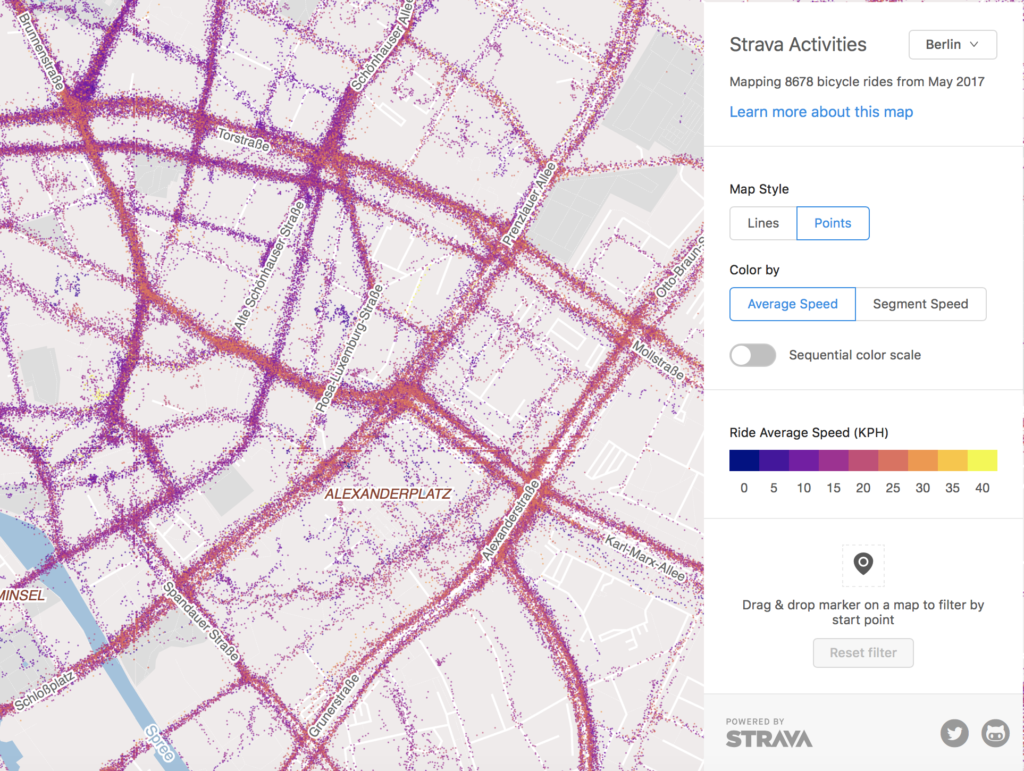


Strava is a popular cycling and running app that is known to the mapping community from its awesome heat map of rides and runs. It’s a great and useful tool, but it shows only a density of activities which can be interpreted as a popularity of a given location.
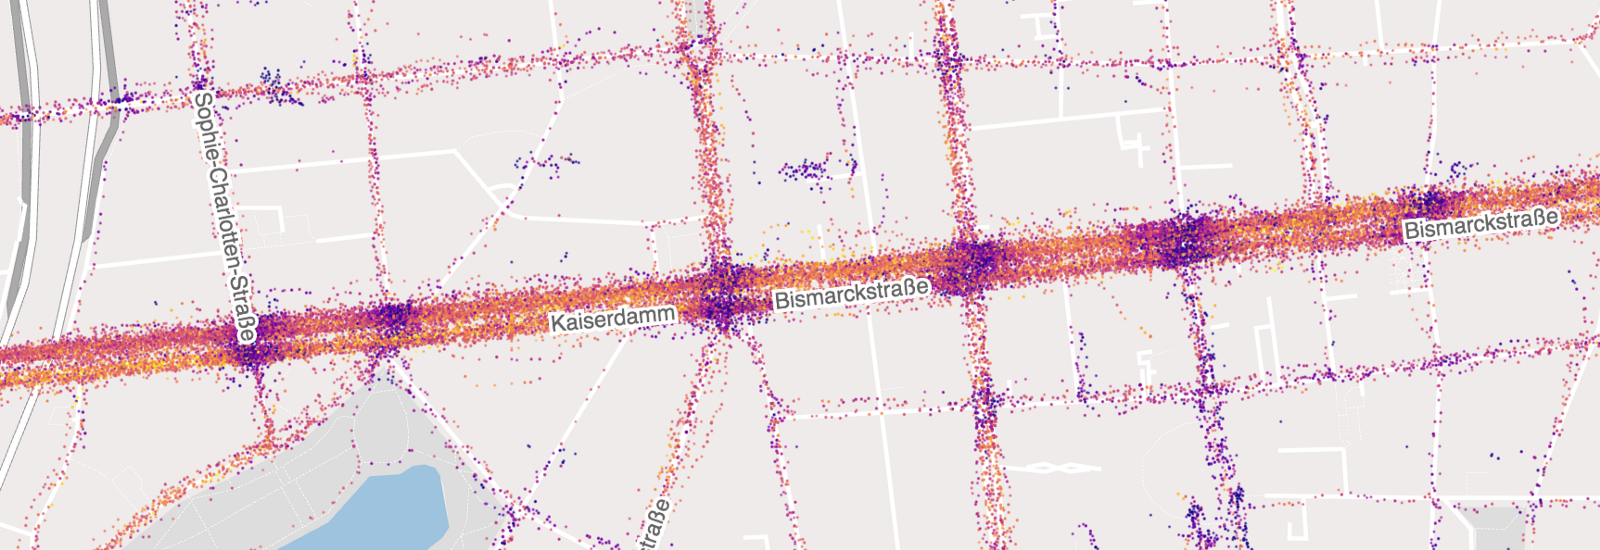
Vova Bilonenko – developer and cycling enthusiast, decided to explore what else could be extracted from GPS data available via Strava API. The result of this exercise is a map showing an average speed of all activities for any given place. On the example below you can see every traffic light on the way.
On the example below, you can see every traffic light on the way.
For now the map is available only for Berlin and Brussels but Vova is looking for suggestions for other cities to be added. Certainly a cool project.

#Ideas


Next article

Our planet is continuously in motion. Continents are floating on tectonic plates at different speeds from 1 to even over 10cm a year. Recently Australia had to shift its geographic coordinates by 1.5m (4.9ft) as the global GPS coordinates didn’t match the real world (Australia shifts 7cm a year north-east).
The idea that continents drift dates back to the beginning of XX-th century when German geophysicist Alfred Wegener noticed huge similarities between fossils found on various continents which suggested that the land masses might have been connected. Additionally, he could clearly see that shapes of Africa and South America were fitting together really well.
At that time there was no evidence to support Wegener’s continental drift theory and few people liked it. It was only in 1950s and 60s when the geoscientific community accepted plate-tectonic theory after discovering underwater mountain ranges and validating seafloor spreading phenomena.
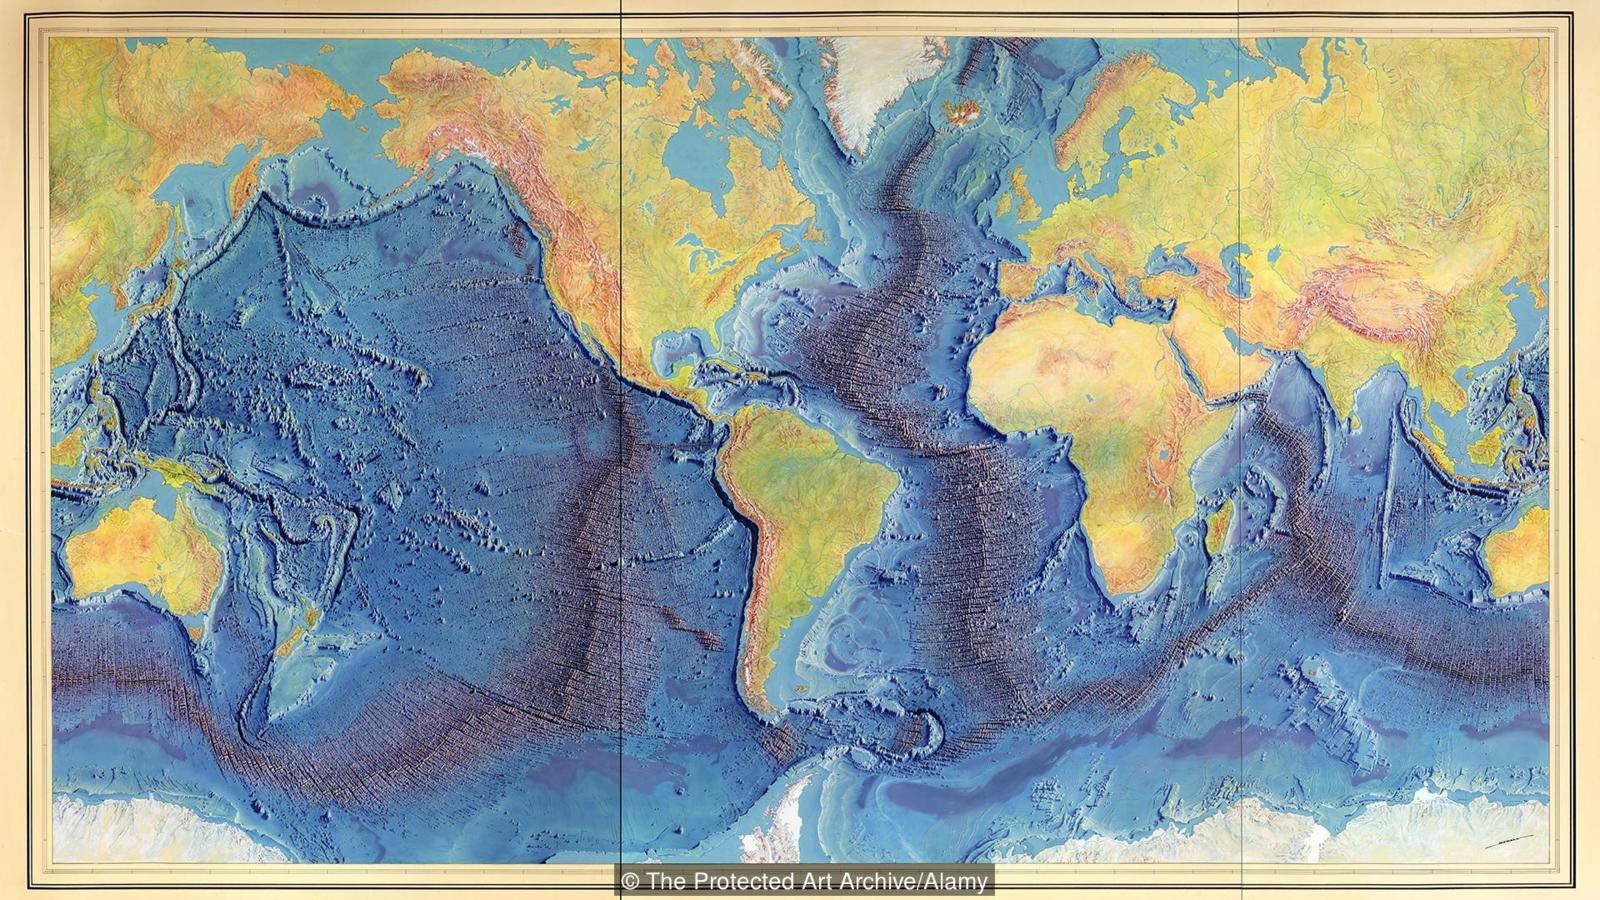
The ocean floor map (Credit: The Protected Art Archive/Alamy)
Studying the contemporary movement of the land masses, scientists concluded that approximately 175 million years ago a single supercontinent (named Pangea) begun to break apart and the process continues until today.
Now researchers try to model how the continents will look like in the future. There are a few theories but most of them have similar conclusions: all continents will collide again and form another supercontinent. Take a look at these visualizations:
It’s also interesting to see how Earth’s continents looked like millions of years ago: