

From keeping an eye on large forest fires to tracking clouds and watching dust storms to predict the weather, or even mapping the growth of cities to plan for sustainable living, remotely sensed data helps to improve our lives in countless ways.
See: How earth observation data and analytics is helping tackle climate change
The era of observing the Earth through satellites began more than six decades ago when the former Soviet Union launched the world’s first artificial satellite, Sputnik 1. Hundreds of remote sensing satellites have followed ever since, providing reliable and scientific information about our planet’s surface, oceans, atmosphere, et al.
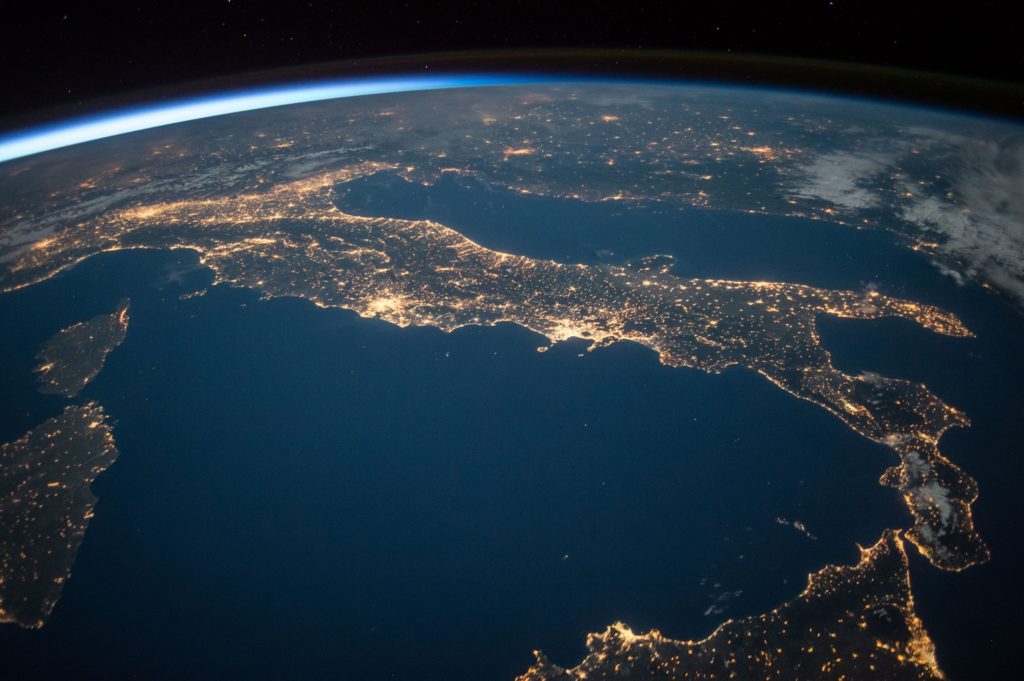
And let’s not forget how seeing the earth from space, and getting an unexpected look at humanity, has totally changed the way we perceive our planet.
The growth of the earth observation industry has also been pretty incredible, to say the least. We have come a long way from capturing low-resolution imagery of select areas (mainly for military purposes) to cover the entire planet in high-resolution, on-demand, and in near-real-time.
And yet, when a recent project sent me looking for high-resolution satellite data, I was surprised to see that there are no resources that provide a comprehensive list of all EO satellites or a way to query them. Even Wikipedia failed to help me get a complete picture!
- How many Earth Observation satellites are there?
- What are the spatial, temporal, and spectral resolutions?
- Which data is available for free and which is commercial?
I simply couldn’t find a definite answer to these questions that should primarily be a part of any GIS professional’s basic geospatial knowledge.
This is why I decided to take the challenge on myself and compile a list of all Earth Observation satellites systems and their parameters in such a way that no one would ever need to spend long hours searching for that data again.
All the data that I have compiled can be downloaded for free from the Google Sheet below and you can use it for your own purposes and research.
Most importantly, this is an Open Source project, so everyone is welcome to contribute. I’m happy to rectify any errors and fill the gaps.
I’m hoping that having access to so many data sources in one place will help researchers and businesses alike to find valuable planetary insights for specific causes and build more effective products from satellite data at scale.
I would like to thank UP42 for supporting this article as it required a lot of work from the Geoawesomeness team.
If you are also looking for powerful processing algorithms to extract insights from the data or an easy way to integrate satellite data and analytics into a custom application, I recommend you check out UP42.
It’s a really cool open platform and marketplace for Earth data and analytics where you can access and analyze a large number of satellite data listed below, including MODIS optical data, Landsat 8 full scenes, NEXTMap DSM and DTM, Pléiades 1A/1B imagery, and Spot 6/7 imagery. This is in addition to other first-class geospatial data sources such as aerial imagery and AIS data.
I recently did a cool machine learning remote sensing project using their platform to analyze the local impact of Covid-19 and I highly recommend every geospatial and remote sensing engineer to check it out. Particularly, I was amazed at how UP42 took the complexity out of sourcing and processing satellite data, so I could focus on the actual task at hand. With UP42’s flexible infrastructure, that allows you to scale as you grow, I can only imagine how quickly and easily businesses will be able to develop and launch innovative products.
Here is the Google Sheet which has all the all Earth Observation satellites available and here is the version in XLSX format. Please note that there are two sheets available: the first one with optical and the second one with radar satellites.
I’m looking forward to your feedback and comments! You can contribute by putting a comment in the Google Sheet with the list.
Did you like the article? Read more and subscribe to our monthly newsletter!

#

Next article


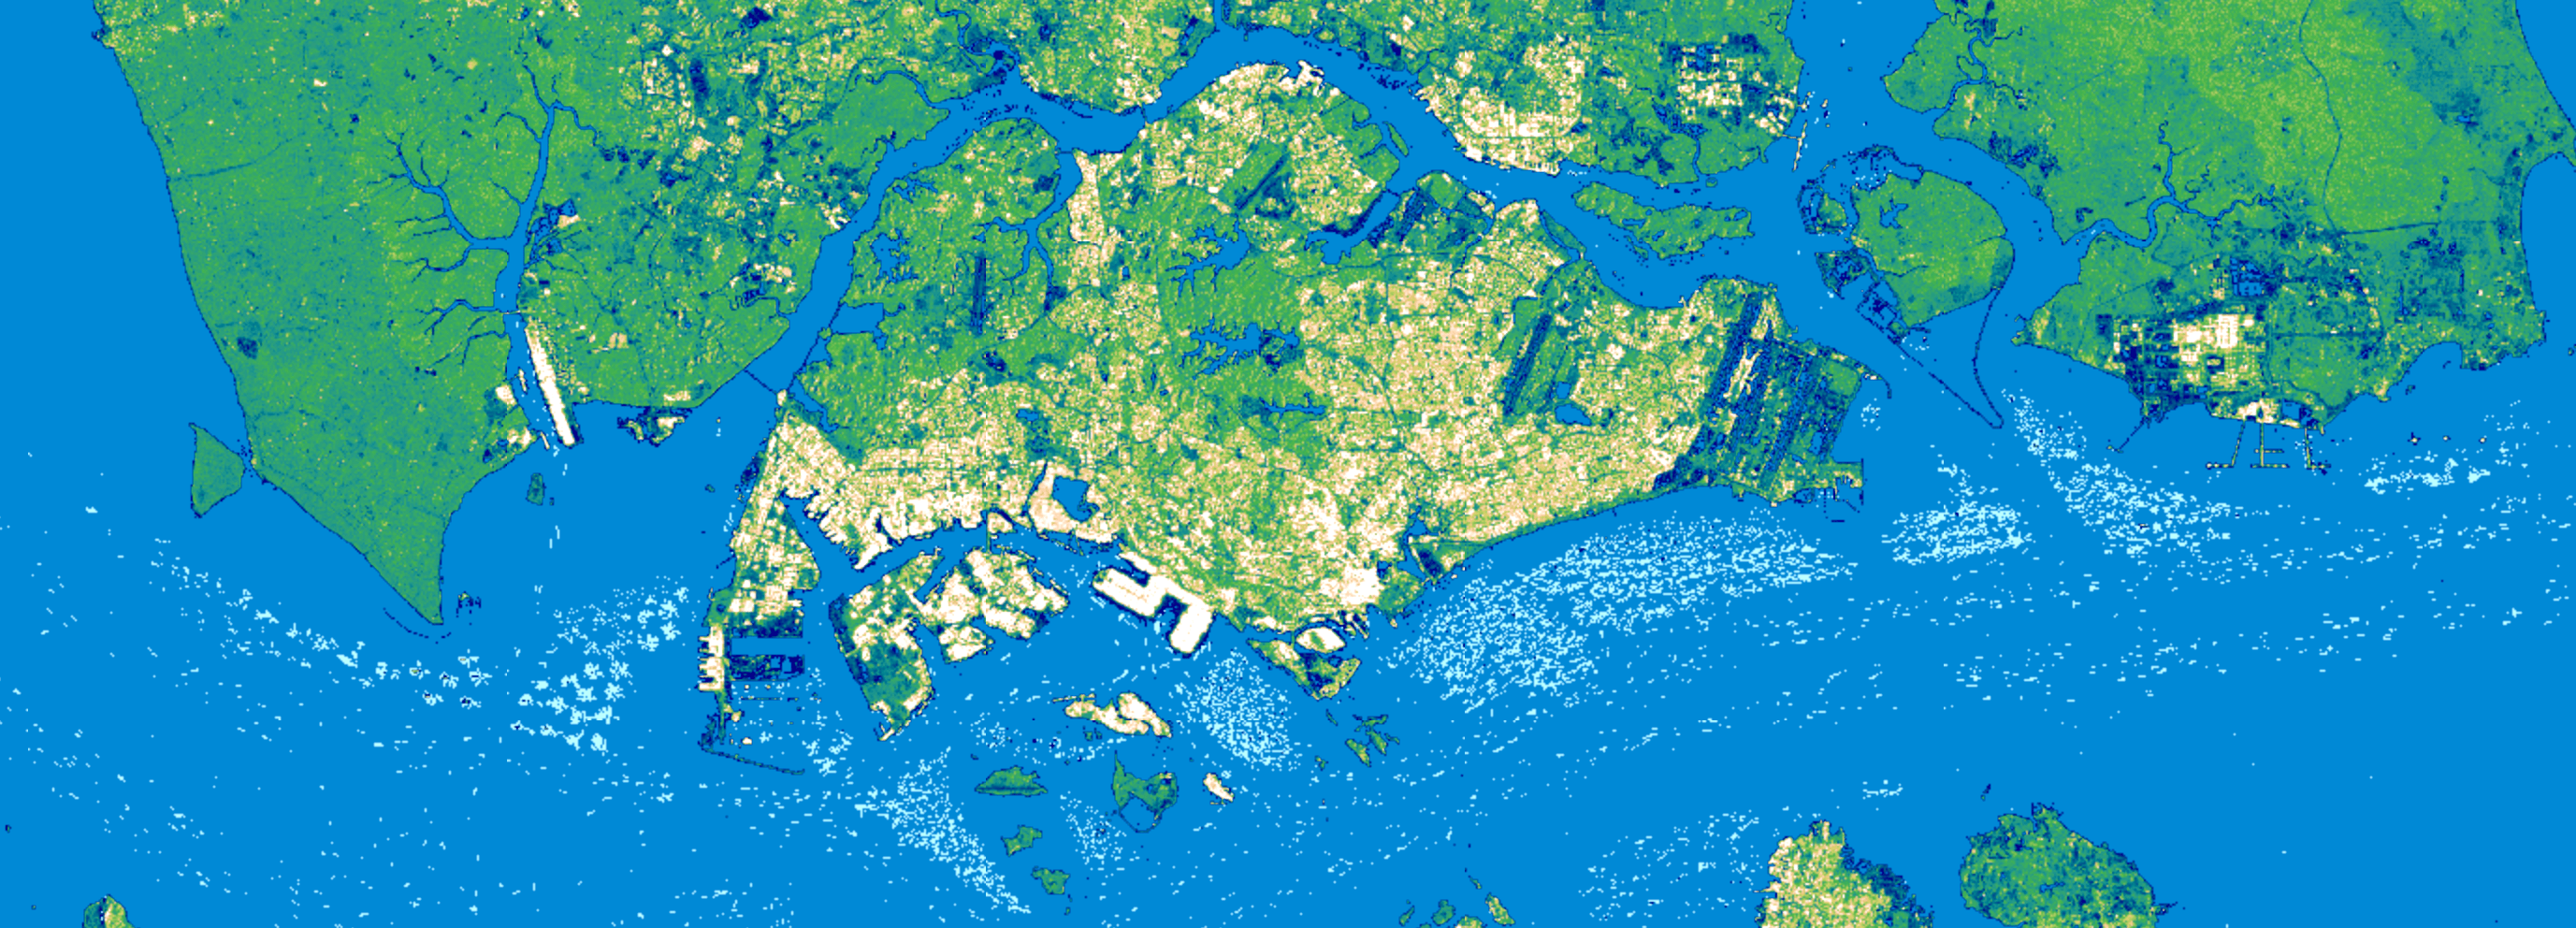
A three month Sentinel-1 SAR composite over Singapore with lighter colors capturing activity on land and at sea, via Descartes Labs
The economic disruption induced by the COVID-19 pandemic is affecting raw materials and product flows worldwide. Freezes and disruptions at borders and ports are creating a strain on the way goods are produced, assembled, and delivered. The brunt is especially hard on non-digital native industries, such as shipping, retail, manufacturing, oil and gas, etc.
To tackle this challenge, geospatial analytics company Descartes Labs has launched a new tool that would use signals from space to estimate the recovery of supply, demand, distribution, and logistics on a global scale post-COVID.
The company says that its Economic Activity Signals (EAS) quick-start package would give businesses the ability to zero in on specific locations and monitor the demand and production across the supply chain. The core areas that EAS will focus on are:
- Mobility Activity: To track the movement of people in aggregate
- Commercial Activity: To track the pulse of production
- Maritime Activity: To track the flow of ocean transport
- Regional Pollution: To track pollution within political boundaries
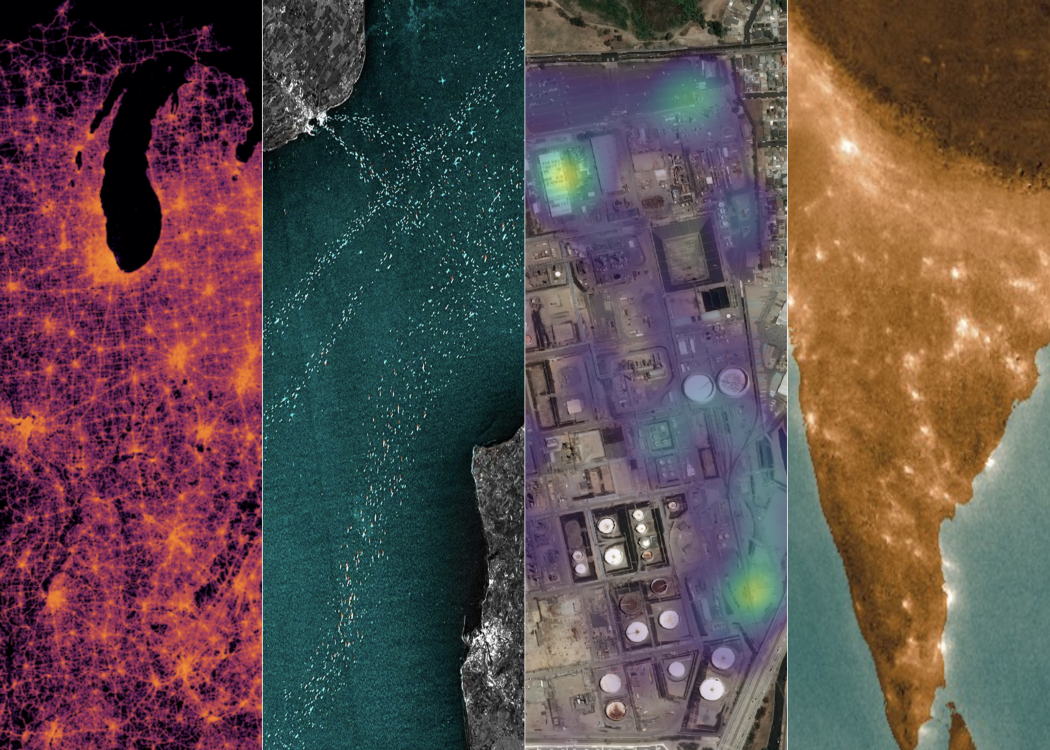
Visual representations of economic activity signals from space. Left to right: mobility activity, maritime activity, commercial activity, and regional pollution activity
“Using location data, businesses will be able to stop guessing about the timing and impact of disruption and instead use our signals to make data-driven decisions about supply, production, and demand across key sourcing and distribution networks,” Mike Warren, CTO and Co-Founder of Descartes Labs, tells Geoawesomeness.
Mike stresses that having the correct forecasting tool will help business leaders shift from a “just in time” to a “just in case” mindset, allowing them to stay afloat in a continuously uncertain economy.
“By combining cutting-edge technology with geospatial data in order to monitor changes to the physical world, EAS builds a complete picture of daily activity around a diverse set of supply and demand networks. EAS will help businesses identify weak spots across their entire supply chain, offering visibility from tier 2 and 3 suppliers all the way to ports and warehouses,” he says.
This intel, the company hopes, will help business leaders answer questions such as:
- Where’s the demand? When will it come back?
- When should I restart hiring and ramp production?
- When should I reopen my stores and how many staff members will I need?
- Where is inventory being held up?
- What are my competitors doing? How is my market share shifting?
Did you like the article? Read more and subscribe to our monthly newsletter!