
By now you must have heard about the power of GPU. Previously associated mainly with gaming, Graphics Processing Unit started to play a considerable role in deep learning and starts to be more and more critical for general-purpose computing. One of the major benefits of GPUs is that it applies the concept of parallelism. In simple terms, CPU consists of a few cores optimized for sequential processing while a GPU has a massively parallel architecture composed of the thousands of smaller cores designed for handling multiple tasks simultaneously.
The technology started to play an important role also in the area of databases. GPU-optimized Big Data environments can query and visualize information more than 100x faster than other systems and this applies also to geospatial data.
MapD is a San Francisco based startup that created GPU-powered big data analytics platform focused on location-based information. Guys at MapD were one of the first startups leveraging the massively parallel computing capabilities of GPUs to execute SQL queries over multibillion row datasets with millisecond response times and render the results using the native visualization capabilities of GPUs.
The story of MapD started a few years ago when CEO Todd Mostak was waiting hours and sometimes days for a single query to process patterns in hundreds of millions of tweets for his Harvard thesis on the Arab Spring. Frustrated that he couldn’t access a cluster of computers to perform his computations, he created his solution by pairing off-the-shelf video game GPU cards with a new design for parallel databases. The effects were so amazing that Todd decided to pursue this technology as a researcher and funded MapD back in 2013.
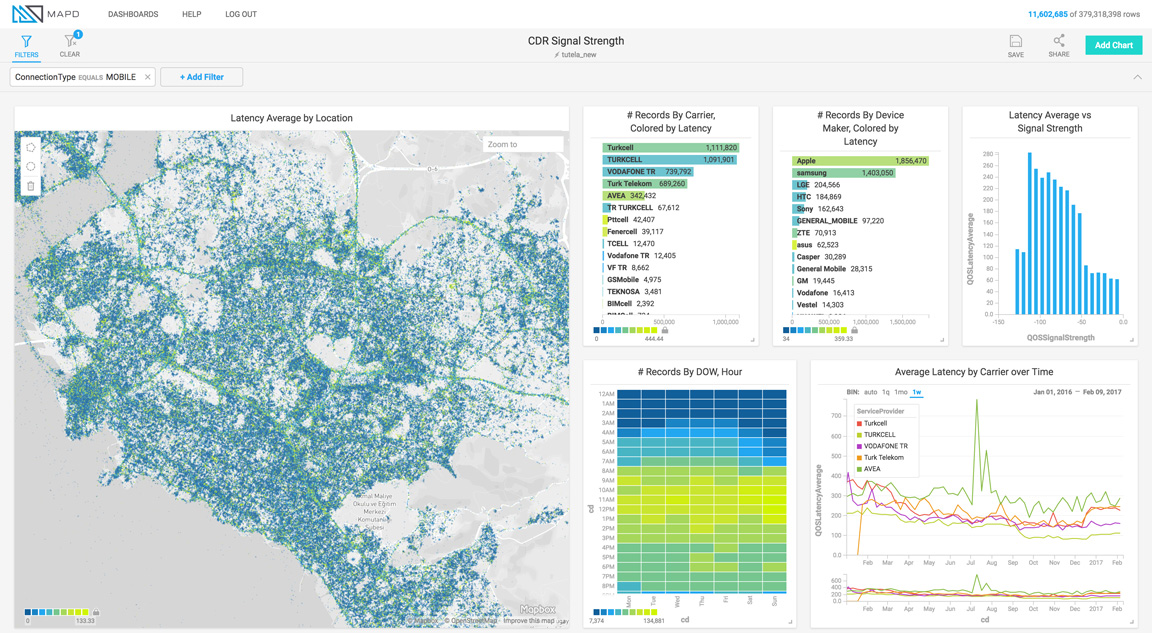
On the top of their unique architecture, MapD launched MapD Immerse data visualization platform that enables working with huge geospatial datasets like never before. The company has several demos on their website, and I recommend you to play around with it. Without any tricks, hacks, aggregations, and generalizations it querries massive databases and immediately shows the results using Mapbox engine. It’s very impressive.
MapD’s products are well suited for a range of big data use cases, including GIS, location intelligence, and social media analytics among others. Early adopters have included Fortune 500 companies in the telecom, retail, finance and adtech sectors.
The capabilities and GPU-powered data analysis and visualizations and MapD’s platform on the top of it are amazing, and it will sooner or later become the industry standard. Geospatial industry must wait a bit for the raster data support by MapD but the effects available today with vector data are promissing.

#Business


Next article

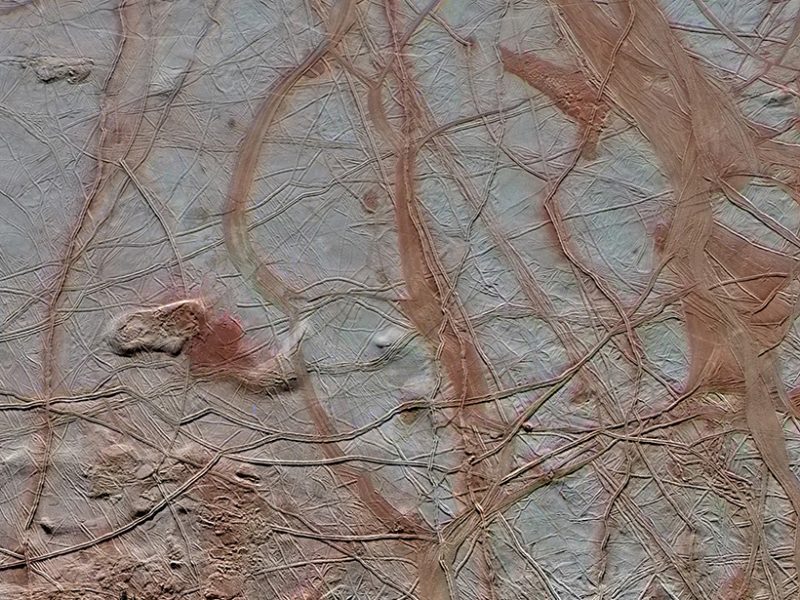
Credit: NASA/JPL-Caltech/SETI Institute
For the scientific community, Jupiter’s icy moon Europa is as puzzling as it is fascinating. One of the most geologically complex satellites of our solar system, Europa is believed to be hiding a saltwater ocean beneath its icy crust. Naturally, NASA wants to conduct a detailed investigation of the moon to find evidence of the water and gain insight into the potential habitability of this mysterious world.
The Europa Clipper mission, which is already in formulation, plans to do just that. Only, before an orbiter or lander can be sent to this moon which is only slightly smaller than ours, NASA needs to know where to land its spacecraft on surface covered by bounteous cracks, ridges, bands, etc. In other words, they need a map. And now, they have one, courtesy D. Alex Patthoff of Planetary Science Institute and his colleagues at UCLA, Wheaton College, and NASA’s Jet Propulsion Laboratory.
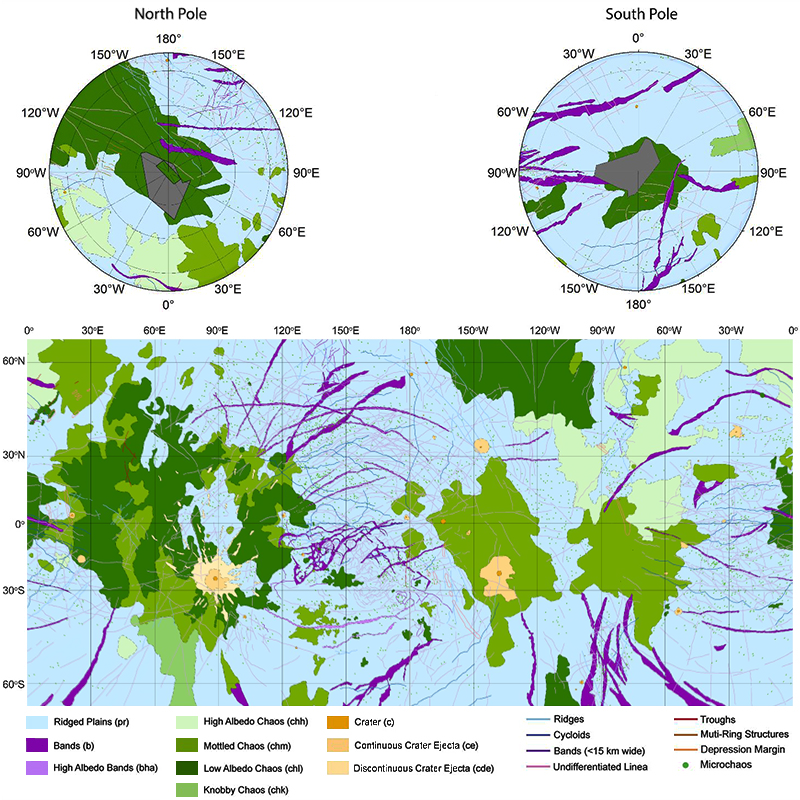
Credit: NASA/Erin Leonard, Alex Patthoff, and Dave Senske, building on work by Ron Greeley, Thomas Doggett and Melissa Bunte
The map, which was unveiled this week at the annual meeting of Geological Society of America, is a result of the imagery collected by the Voyager and Galileo missions. After stitching together more than 100 images from these missions into a mosaic, it took weeks to ascertain and catalogue the various structural features of the satellite, the authors told Eos.
Creating the geological map was especially challenging because in addition to the complex surface of the moon, the variable lighting conditions and image resolutions from the Galileo solid state imager (SSI) data set made it difficult to differentiate between features like a ridge and a crack. But now, the finished product not only identifies individual units like chaos, bands, ridged plains, and craters, it also depicts structural features like ridges, cycloids, undifferentiated linea, crater rims, depression margins, dome margins, and troughs. The map has been created at the scale of 1:15 million.