At the turn of the 20th century, the building of colonial railroads and the discovery of minerals was the key driver for urbanisation in Zambia—formerly known as Northern Rhodesia.
The railway line was used to transport minerals from the Copperbelt Province in the north—through Lusaka—to the border town of Livingstone in the south. The growth of the mining industry led to the development of settler, administrative and mining towns along the North-South “line of rail”.
Currently, the population is concentrated in the urban centres along the “line of rail” with Lusaka City being the largest urban centre. The lure of better economic opportunities, infrastructure and services, and natural population growth drives the increase in Zambia’s urban population.
Zambia’s Urbanisation Challenge
This urban growth is not without challenges, among them a strain on the existing infrastructure. Other challenges include:
- City boundary encroachment on agricultural and customary land
- Proliferation of informal settlements
- Environmental degradation
Zambia’s urban population is on the rise and will reach 12 million by 2030—double its urban population as of 2015. Furthermore, in 2018, the UN Habitat reported that 40% of the Zambian population are in urban areas with an estimated 70% living in informal settlements.
While significant social, economic and environmental problems characterise informal settlements, they’re also centres of economic activity and employment. Considering that Zambian cities account for 80% of the GDP, urbanisation should be viewed as an opportunity for economic growth rather than a challenge.
To this end, the International Growth Centre (IGC) has been working with UN-Habitat to support the Zambia Ministry of Local Government to promote prosperous and inclusive urban settlements. They’re working to ensure that Zambia’s towns and cities are resilient to support economic growth.

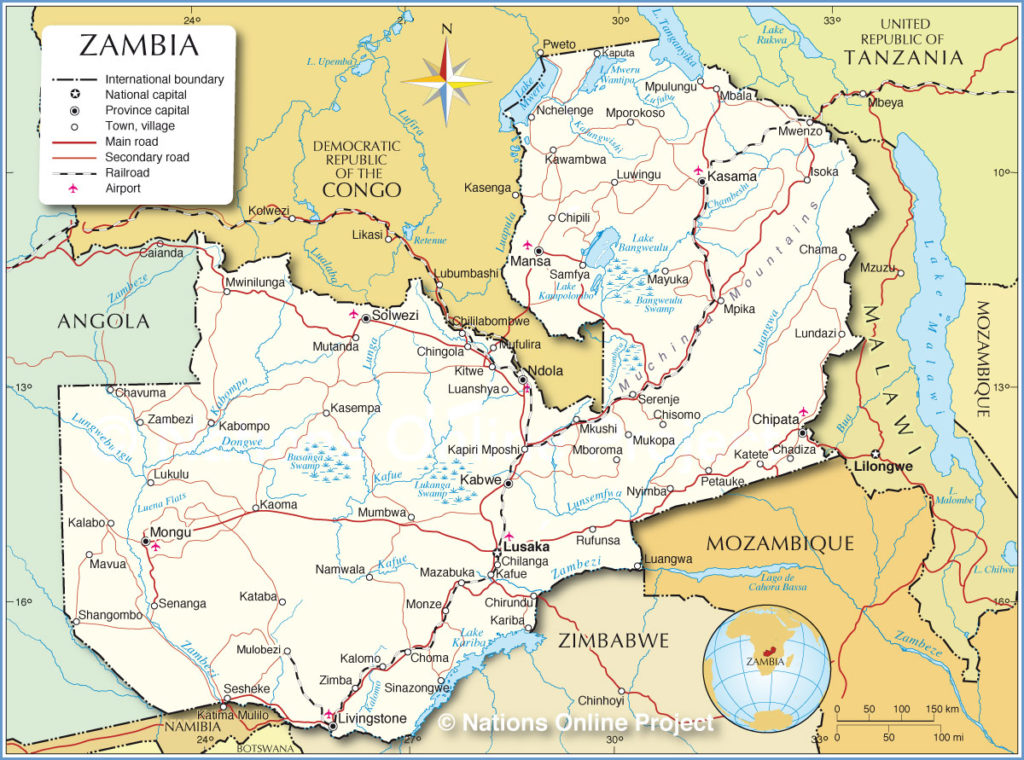
Political map of Zambia (Source)
One way of addressing the urban growth challenge is by adopting efficient urban planning practices that allow for expansion. Urban planning should be based on up-to-date quality data and information. Unfortunately, Zambia faces a digital map gap. There is a lack of sufficient spatial data needed for better planning for urban expansion and public service delivery.
The other problem is that traditional data collection and mapping techniques cannot keep up with the high rate of urban sprawl in Zambia’s capital, Lusaka.
Therefore, how might we best address these obstacles and improve the availability of mapping data for better spatial planning in Zambia’s towns and cities?
Addressing the Digital Map Gap
Luckily, with advances in Artificial Intelligence (AI) technologies, mapping can now be done at a higher speed, and more cost effectively. Indeed, mapping that would normally take months—if not years—can now be done in weeks.
With this in mind, Ordnance Survey collaborated with the Commonwealth Association of Architects (CAA) to create an inaugural digital base map of Lusaka from aerial imagery. The base map—which focuses on the identification of informal settlements—will help to:
- Identify the size of informal settlements
- Compute an estimate of the number of people living in informal settlements and the population density—based on the number of buildings
- Identify access to roads and public services within formal and informal settlements
- Predict the growth of informal settlements
Furthermore, the base map will find application in poverty reduction, land management, housing, basic and social services, infrastructural development, and coordination of large-scale investments. It will also help to avoid future disasters resulting from unplanned urban growth.
Creating the Digital Base Map of Lusaka, Zambia
In this project, Ordnance Survey (OS) used AI to map an area covering 420km2 of Lusaka, Zambia.
To do this, they first obtained aerial imagery from the Zambia Survey Department in the Ministry of Lands and Natural Resources. The aerial imagery had a spatial resolution of 20cm. They then identified different feature classes on the imagery, i.e. buildings, roads, trees, grass, water, natural surface, sealed surface, etc.
Next, they preprocessed the aerial imagery and determined the best training method. After that, they labelled the imagery to be used as training data and then trained the model. Afterwards, they applied the trained model to the rest of the imagery covering all of Lusaka City for classification.
Lastly, they post processed the resulting map to clean up any major issues e.g. enforcing building corners at 90 degrees.
Statistical Overview of the Base Map
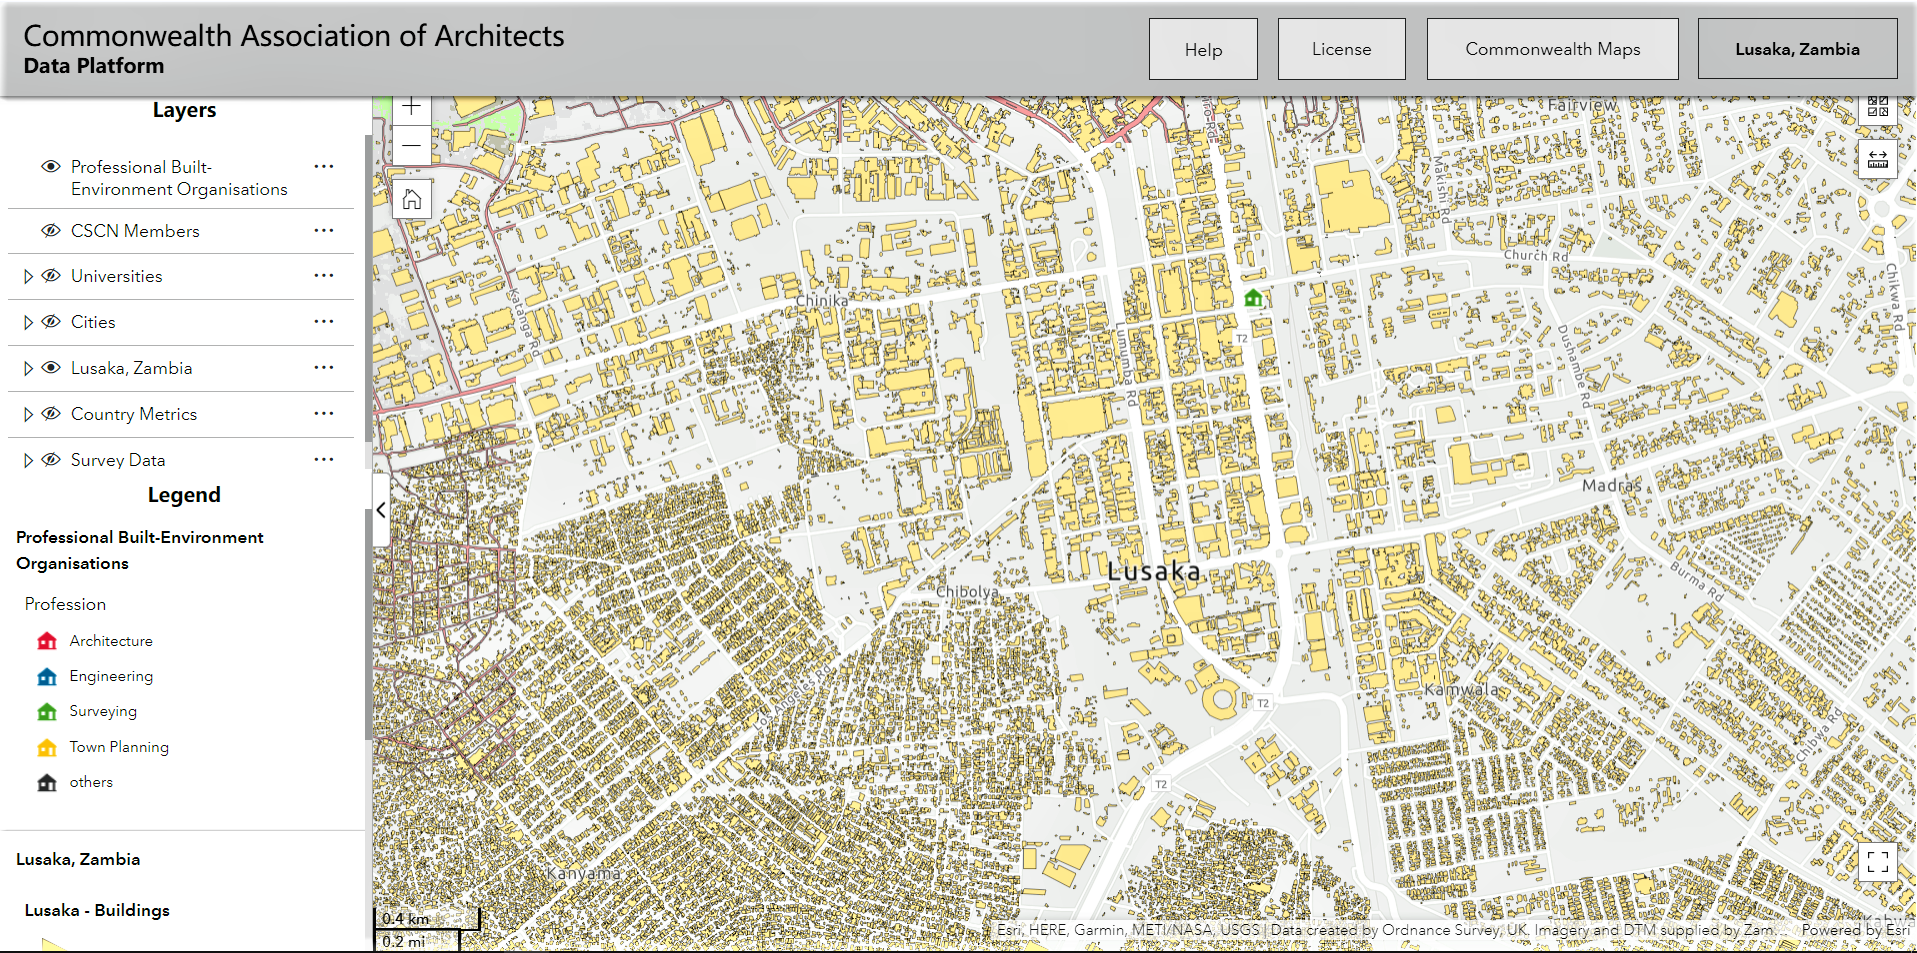
Screenshot of the Base Map (Source)
Here’s a statistical overview of the resulting base map:
- Buildings occupy 11% of total area mapped
- The number of individual building features captured was 256,480
- 82,389 other structures were mapped—including buildings under construction. These cover 1.5% of the total area mapped
- Trees cover an area of 74.4km2 (18% of the total area mapped)
- 4,067km of road links were mapped
- The length of rail links mapped was 34km
- 65.1km2 or 6% of the mapped area is covered with grass
A Look at the Challenges
The African urban landscape differs significantly in makeup and appearance from urban areas in America, Europe or Asia—which also have more data on which to train AI models.
From rural suburbs to urban areas, Lusaka has a diverse and rapidly changing landscape. It has varying vegetation cover and building types, ranging from informal settlements to large commercial and industrial buildings. When training the model, the training data had to represent this diverse landscape, which was a challenge.
Additionally, while the model correctly identified walls and other permanent structures, it failed to identify buildings which were under construction because they were roofless. Nonetheless, these were classified under ‘other structures’.
What Comes Next?
Leveraging on the lessons learnt in this project, Ordnance Survey will improve the model, making it more applicable in mapping other regions.
“This programme will promote the value associated with accurate and relevant spatial data. The rapid delivery of a scalable and replicable national digital base map is not only relevant to cities such as Lusaka, but also has far reaching benefits at national and regional scale. OS data will provide the evidence and information to support critical decisions when upgrading existing informal settlements and planning future infrastructure to promote economic prosperity.” Andy Wilson, Africa Region Director, OS
Need more information about this project? Please email internationalenquiries@os.uk
View the base map: Commonwealth Data Platform Experience – Lusaka (arcgis.com)
References