
Editor’s note: This article written by Claire Krumm is part of the “Young and Geoawesome” series. The series aims to encourage young professionals to share their passion for all things geo and thereby build a more diverse, inclusive and welcoming geospatial community.
The railroad less traveled
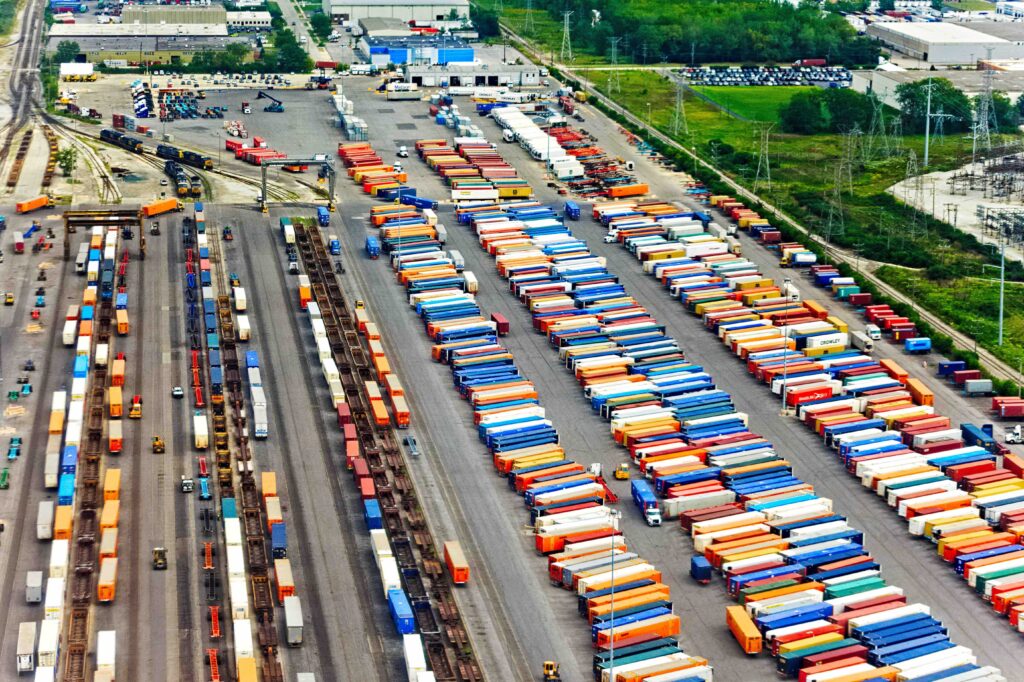
The noon sun floats like a cooked yolk in what feels like a boiling bowl of udon soup. I’m wearing wrap around safety sunglasses, a too-large safety vest, and khakis that are overflowing with packets of earplugs. The large expanses of asphalt interspersed with flat, dusty land radiates heat into our pink-accented steel toe boots. I’m with five other women, an uncommon group in the San Bernardino intermodal yard.
‘Intermodal,’ at its core, means moving freight by two or more modes of transportation. San Bernardino, like most intermodal yards that include rail transport, is a long, rectangular, multi-acre piece of land. The scale of the yard’s operations is immense. Enormous gantry cranes straddle idle trains, gliding to pluck off their shipping containers and stack them elsewhere under the precise direction of a skilled operator. It’s like a claw machine, except the teddy bear weighs tens of thousands of pounds.
For me, however, the rail network is even more impressive from the sky. From a satellite view, the rail lines converge in intermodal yards like strings through a bead, fraying out on either side. They weave and braid around mountains and over rivers, forming this complicated pattern rooted in history and geography. If anything, it made me appreciate the precise planning required for each of my Amazon purchases to make it to my doorstep.
An unlikely internship
I joined BNSF Railway in 2019 as an Environmental Project Controls and Real Estate intern. I was majoring in Environmental Science and had recently added “Geospatial Information Science & Technology minor” to my resume. In my experience, GIS inevitably becomes a talking point in interviews, even if they aren’t explicitly looking for someone with GIS experience. Although it’s still a nebulous topic for many, the questions I’ve gotten about GIS are always inquisitive and enthusiastic. People usually don’t know how it works, but they know it can solve a lot of their problems.
Because of my skillset, I was given access to the company’s property Shapefiles. An exciting moment for the team was when I gave them the total area of property they managed. Something as simple as knowing how to navigate to “Calculate Geometry” in ArcMap produced a key statistic for the department.
The makings of a good mapmaker
I know that reading that statement gives any good mapmaker pause: Would I learn anything doing GIS at a company that doesn’t specialize in it?
I’ll admit that a reservation I had about working in the private sector was that I feared I wouldn’t be doing a “real” job in the environmental or GIS fields. Many of my peers were doing cool research projects on wildfire impacts using Landsat imagery or agricultural analysis at the Environmental Defense Fund. I worried that an established company would be unwilling to adopt new tools for processes they’d been doing for decades, or, in the case of America’s railroad industry, centuries.
But it wasn’t all registering coordinate systems and generating simple maps. My biggest project was designing a scoring methodology for managing environmental risk on the company’s leased properties. This program helps the department prioritize sites and follow a clear plan of action for next steps. My manager and I agreed that a property’s location in relation to federal lands and other sensitive receptors should factor into the scoring, but this information isn’t available on a lease agreement or an inspection report. It sounded like a good opportunity to make a map.
Connect the dots you have
Sometimes, saying “We can do this now by connecting these dots, but we could do that later if we collected those dots” is still value added.
I’m a firm believer that there is almost always a spatial element to every problem. I think back to “My First GIS Story,” a tale of John Snow, a map, and some cholera. You can read more about this classic here. It’s a simple story, but it always reminds me how powerful this type of work can be.
Like John Snow, I couldn’t resist the opportunity to create an ArcGIS Online app. I wanted to plot every property and create this detailed table showing intersections and proximities between land types and links to inspection reports. In reality, it wasn’t the streamlined, totally automatic tool I was hoping for. The hard truth is that spatial data — regardless of whether it’s from a company or a nonprofit or a government agency — is rarely collected in the way you want, organized in the way you want, or shared in the way you want.
I learned to accept these limitations and meet in the middle. My final version of the app used a manually inputted coordinate pair to find a property and generate a report showing its proximity to different land types, which could then be attached to the scoring sheet. Sometimes, saying “We can do this now by connecting these dots, but we could do that later if we collected those dots” is still value added.
You’re off to great places
This skillset has allowed me to step into the pharmaceutical, transportation, and, now, energy sectors. In my current position as the Carbon Analyst at Kevala, Inc., I am the product owner for Kevala’s carbon tracing product and subject matter expert on how to best estimate the greenhouse emissions associated with grid electricity. While we build the Total Carbon Accounting methodology, I collaborate with our data science and design teams to decide how to best represent the grid’s infrastructure, illustrate the flow of electricity, and communicate carbon intensity at different spatial levels.
My early career has shown me that the data we collect, the analyses we perform, and the tools we build as GIS professionals don’t have to (and probably won’t) be perfect, but they are still incredibly helpful for the people who need them. And those people are everywhere, in the most unexpected places.
? Connect with Claire on LinkedIn. Cover photo by Sam LaRussa on Unsplash.

#People


Next article


Editor’s note: This article written by Siu Jione is part of the “Young and Geoawesome” series. The series aims to encourage young professionals to share their passion for all things geo and thereby build a more diverse, inclusive and welcoming geospatial community.
GIS is an amazing tool. Given the right data and accessibility to tools, it can help us transform the lives of communities affected by climate change and disasters. When I started in this field, I was unaware of the volume and type of data collected by different organisations. I was also unaware about how some projects could not access or use this collected data. In some instances, some of the communities had limited to no access to their own data. Little did I know, that I would be using GIS to support communities for climate change and disaster risk management initiatives.
The beginning of my GIS career
I started my GIS career as a Junior Technical Research Fellow at the University of the South Pacific in 2014. Over the course of the four years working in this position, I was responsible for the management of all the GIS operations and provision of technical support to the University of the South Pacific/ European Union-Global Climate Change Alliance (USP/EU-GCCA) project team.
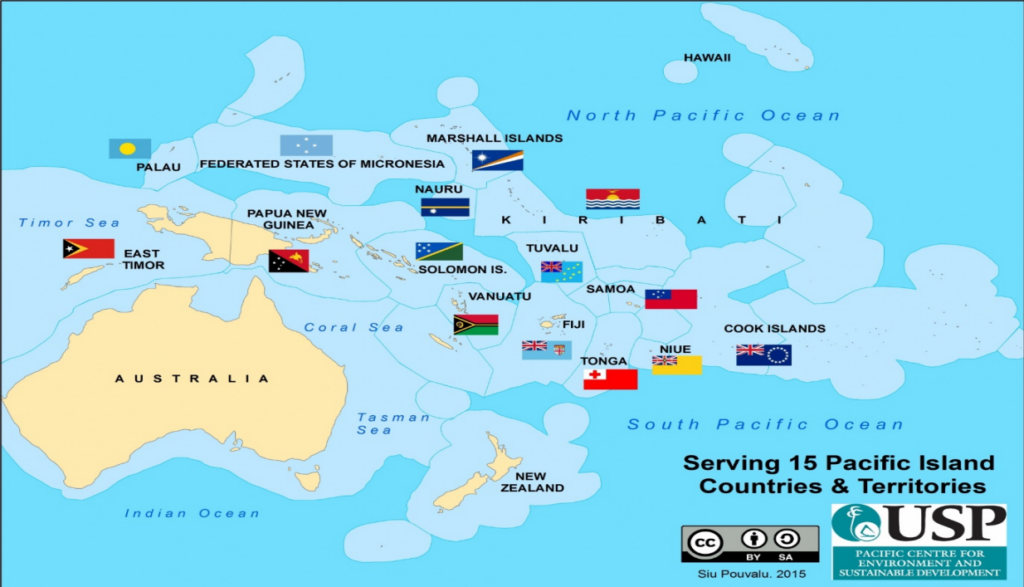
The main aim of the USP/EU-GCCA project was to improve the level of understanding of climate change in the Pacific region. The project had three main components: research, capacity building and community engagement. We worked with over 40 communities from 15 Pacific Island Countries and territories (PICTs). In reality, each community that participated in our project experienced the impacts of climate change and natural disasters at varying degrees.
In the implementation phase of the project, communities with water shortages had water tanks installed. Communities with food security issues had seeds and livestock brought in. Some communities were provided with technical workshops. Many communities that experienced floods, king tides etc had sea walls constructed. Spatial data was collected and analysed to determine areas and households at risk and identified resources etc. I noticed that our project and other organisations collected so much data of the same communities. For some communities, there were data duplicates. Each organisation had specific objectives to meet. Therefore, the data and methods of data collection, processing and dissemination were specific to that organisation.
This created a collection of incompatible datasets with different file structures and formats that did not support or encourage spatial analysis. At the end of each project, the data was only accessible to the implementing organisations and donors. Not even the community whose data had been collected accessed their own data. It was a classic example of data everywhere but unusable to everyone, particularly the ones whose data had been collected. Surely, there had to be a better way!
Participatory Geographic Information Systems
To overcome this problem, our Project team came up with the idea to develop a community disaster risk mapping toolkit. Basically, the aim was to ensure that communities will always have access to their own data. In fact, providing a tool that communities can use to drive their own initiatives is the essence of community empowerment.
Firstly, I carried out some research and learned about Participatory GIS (PGIS). PGIS is a participatory approach that involves data collection and mapping for community driven initiatives. The approach empowers communities by encouraging them to identify their own risks and prioritise issues based on their values. Next, I looked at how PGIS can be used to support climate change and disaster risk management initiatives. Interestingly, many of the communities we worked with had existing decision making bodies that led the community. Also, some had poor internet access. So, the toolkit was designed specifically for the context of these communities. After leading a small team to develop and pilot a community mapping toolkit, we launched the toolkit within six months. It aimed to encourage communities to have a direct involvement in understanding and providing solutions to issues that threaten their livelihoods and security.
A PGIS toolkit for climate change and disaster risk management initiatives
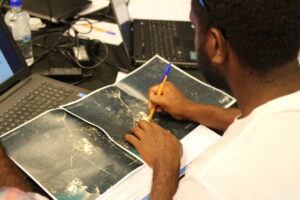
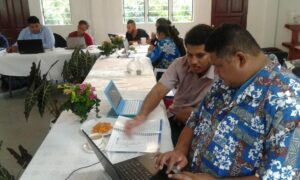
Basically, the toolkit is a step by step guide for communities on how to collect data, process, carry out some simple spatial analysis and present it on QGIS. It consists of a printed step by step manual, a flash drive that contains a soft copy of the manual, QGIS software, Apache Open Office, VideoLan (VLC) media player, spatial data for learning tutorials and google images of their community. At the time of development, many communities had no access to GPS devices. Free data collecting apps such as QField had not been available at the time.
So, instead of providing GPS devices, each toolkit included a printed satellite image of each community for data collection. A soft copy of the image was included for georeferencing, data entry and digitising in QGIS. Basically, this was to ensure that communities had the resources and skills to carry out any project in the future. Open office and VLC were provided because many laptops and computers in Pacific communities often did not have Microsoft Excel or media players. These software were provided as a backup for users to be able to have spreadsheets for data entry and a media player to access the video tutorials.
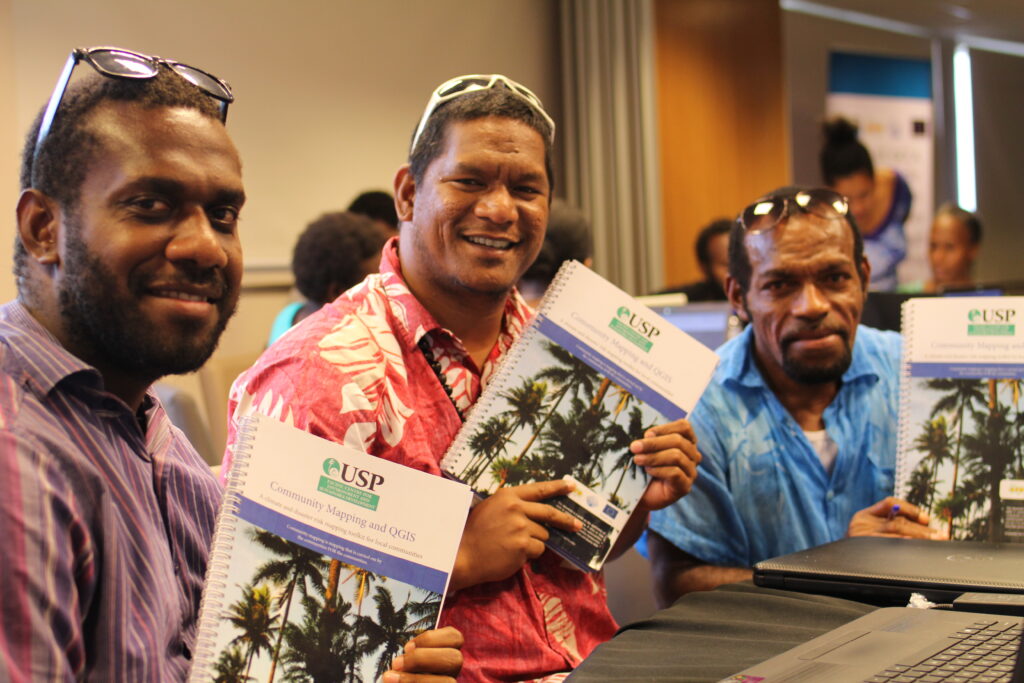
Country coordinators with the toolkit at the EU-GCCA Regional workshop, Vanuatu.
How community mapping can validate rapid assessments
The toolkit was developed as a stand alone tool. However, our project used it to complement and validate rapid vulnerability assessments. Rapid assessments determine the areas that the project will focus on or areas that needs strengthening. Our project used the Integrated Vulnerability Framework (IVA) to obtain a baseline for either vulnerability assessments or identifying priority areas for adaptation or development initiatives.
Data collection for the GIS component went side by side with the rapid vulnerability assessment. Generally, communities were trained to use the IVA and GIS. Participants identified their community’s five livelihood assets (Natural resources, Infrastructure & services, Finance, Human Resources and Institutions & Governance). Additionally, they identified their seven human security objectives (ecosystem health, community health, security of place, water security, food security, income security, energy security). After that, they rank their vulnerability based on their experience and knowledge.
Additionally, the toolkit teaches them how to collect data without GPS devices. It also uses methods that are suitable for communities and to rectify the findings of the vulnerability assessment. Data processing and analysis was carried out in QGIS and presented alongside the IVA results. Between 2015 to late 2017, I trained our country coordinators and community members from the 15 PICTs. In due time, they trained stakeholders in their country to support their climate change and disaster risk management initiatives.
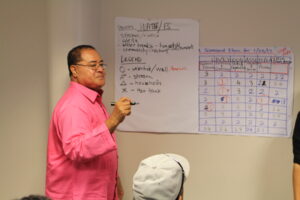
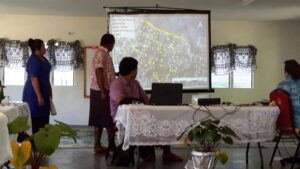
In one of the workshops in Tonga, three farmers from Nakolo village attended. All had never used a computer before but were keen to learn. At the end of the workshop, they presented the results of their vulnerability assessments. They highlighted that food security was the major issue faced in their village. However, when they presented their resources and risk maps, the presenter learned that food security was not the main issue. The village had large agricultural plots of yams, pineapple, banana, watermelon and mixed cropping. Interestingly, the three farmers reached the conclusion that food security was not a priority area! This is the essence of PGIS!
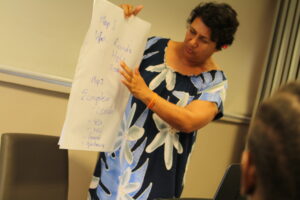
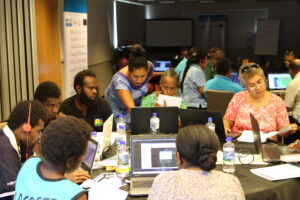
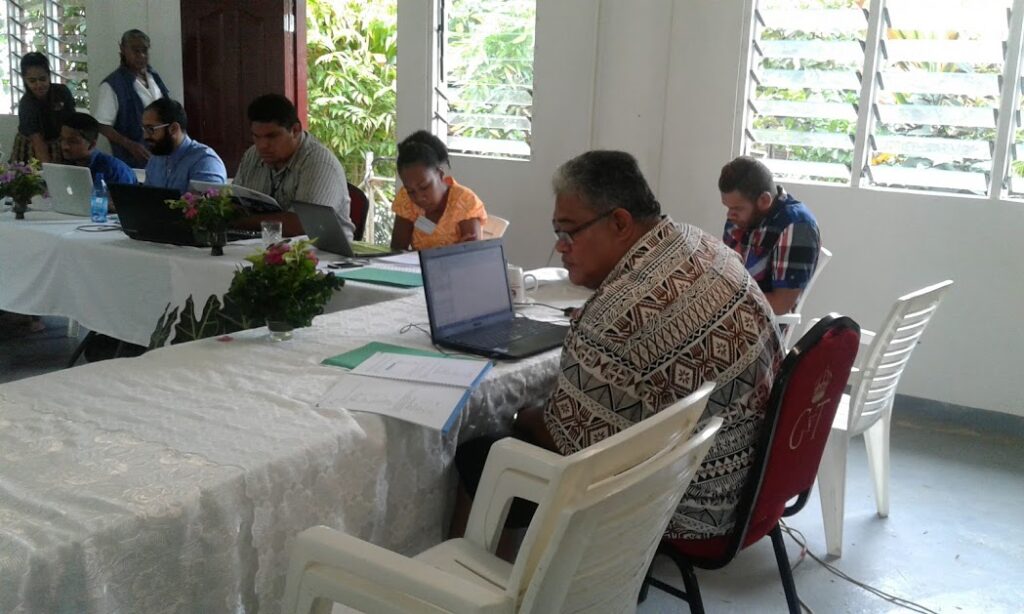
USP-EUGCCA regional workshop training of trainers. Vanuatu 2017
As a result of these workshops, the toolkit gained interest from stakeholders in Fiji, Nauru, Vanuatu, Tonga and Tuvalu.
The communities weren’t the only ones that gained from this project, I also benefited as well. In 2015, I was the proud recipient of the University of the South Pacific Vice Chancellor’s award for Innovation, for the development and implementation of the toolkit. I also pursued and completed a MSc in Climate Change with the aim of testing the effectiveness of the toolkit as a participatory approach.
How have communities used it?
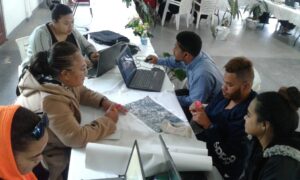
In 2017, I collaborated with UNDP to facilitate a workshop to support the GEF5 Ridge 2 Reef project in Nauru. The workshop consisted of civil servants, practitioners and community members from 5 districts in Nauru. Participants included, youth, men, women and elderly. One of the highlights of the workshop was seeing how the community members organised themselves. The more tech-savvy youth carried out the data collection and analysis. Whereas, the older men and women shared historical knowledge of their natural resources.
In one of the groups, A 71 year old retiree, carried out the mapping in the first two days. However, as the level of difficulty increased, he returned with his grandson who then carried out the rest of it. At the end of the workshop, the 71 yr old presented their map. It showed a before and after map of coastal sites where a rare octopus species was once abundant but now very rare. As a result, they developed an action plan of which they intended to mobilise their community to establish a marine protected area.
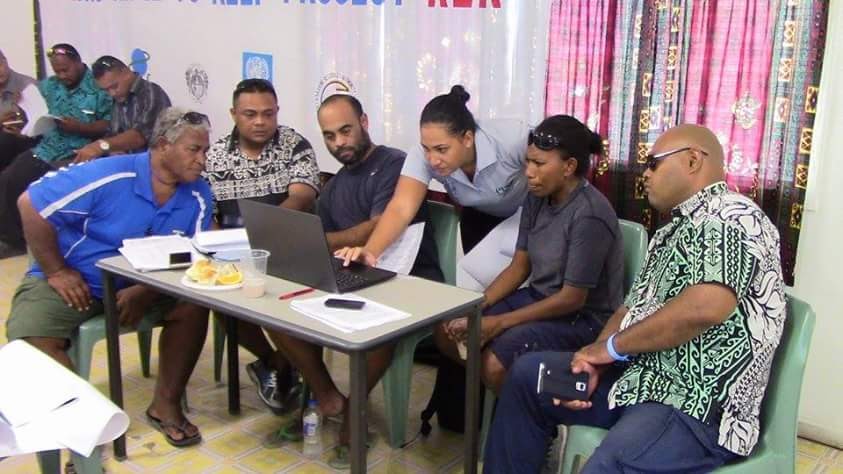
Community Mapping workshop, Nauru.
Subsequently, I collaborated with the Anglican Diocese of Polynesia and co-facilitated a two week workshop. The workshop focused on building resilience within the church youth, with emphasis on climate change and disaster risk managament. The workshop was held in the Fasi moe Afi parish in Tonga with participants from Fiji, New Zealand, Tonga and Samoa. Participants included youth and men, women and members of the clergy of the Fasi moe Afi parish. The first part of the workshop covered the vulnerability assessment and the second part focused on the community mapping toolkit.
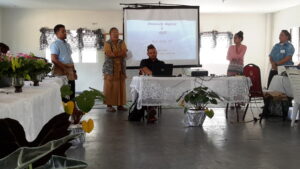
Capacity building workshop on climate change and disaster risk managemet. Anglican Church of the Diocese of Polynesia. Tonga 2017.
Applying skills pre and post disaster
In February 2018, Tonga was hit by Category 5 severe Tropical Cyclone Gita (TC Gita). Before TC Gita hit Tonga, the group that had been trained in the CIVA and GIS in Tonga carried out a vulnerability assessment. They identified houses within their communities and provided reinforcements or evacuation sites to move to. Homes that were occupied by elderly people or people living with a disability and provided assistance. TC Gita caused a lot of damage to infrastructure and agriculture and many homes.
The Fasi moe Afi Anglican group, carried out a post disaster assessment, mapping and categorised at-risk areas into low, medium or high. A damage assessment report was submitted to their head office in New Zealand. As a result, they received 2 containers of supplies and relief and was distributed to the affected homes. More on this story can be found here. The knowledge and skills from our workshop have empowered the young Anglican youth to present at the Pacific GIS/RS User Conference in Suva Fiji and the Moana Water of Life conference in Lincoln UK.
“I was born and raised here in Fasi moe Afi and I grew up in this parish. A few years ago, I was the priest looking after this community. Not once did I know that my neighours had no water supply. This workshop has opened my eyes. I have seen on these maps the many issues that people in this community are facing. We will take this information and present it to our leaders so that we can do something about it”. Father Sione Uluilakepa.
Father Sione Uluilakepa participated in the workshop. Tonga 2017
GIS is a very powerful tool. Communities can use it to building resilience against climate change, improve their livelihoods and for disaster risk management. We only need to simplify it!