From millions of satellite images to deforestation alert: Answering the 3 most frequently-asked questions

At Satelligence, we help companies and NGOs around the globe to end deforestation with satellite-based information. Reliable, real-time, and relevant. When we talk about deforestation detection, 3 questions always pop up:
- How do you use satellites to detect deforestation?
- How are you able to monitor the entire world?
- How do you turn that data into usable information?
Basically, what they ask is how we move from a satellite image to a deforestation alert that is relevant for their business.
We believe it’s important to be transparent about how we work. This blog explains how deforestation alerts are created from satellite images. How does a satellite see the world? How does Iterative Bayesian Updating detect forest cover change and how are these detected changes converted into relevant deforestation alerts?
How a satellite sees deforestation
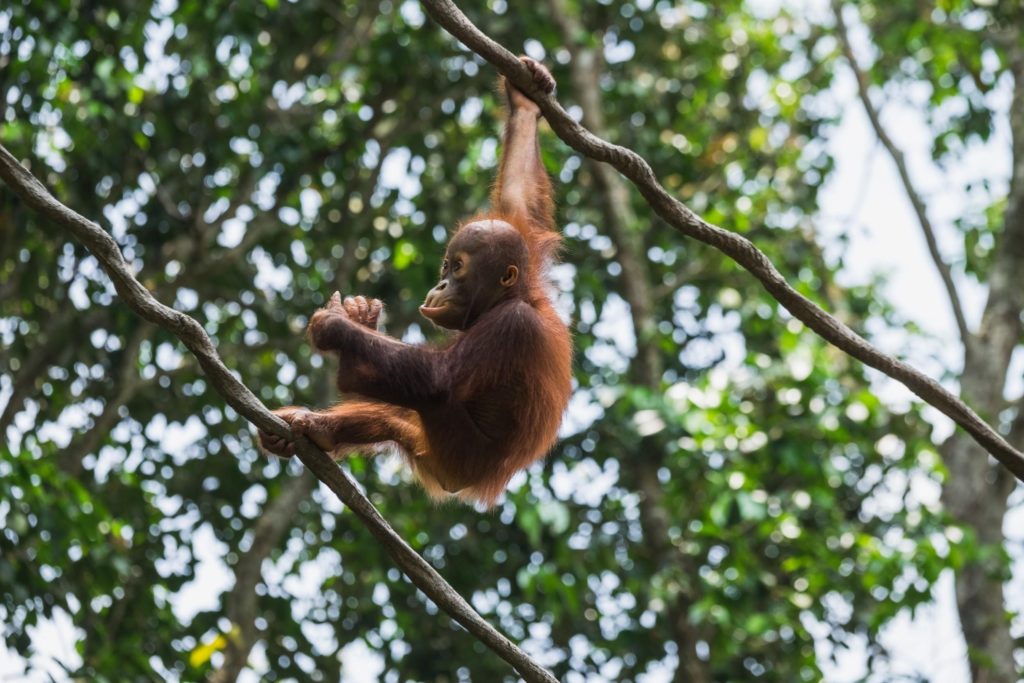
Let’s say you are interested in detecting deforestation in the Leuser National Park, on the island of Sumatra, Indonesia. The region is known for its biodiversity and its most famous inhabitant: the orangutan. In the pictures below you can see two optical satellite images (Sentinel-2) that are taken on the edge of Leuser National Park. The picture clearly shows that some areas have changed between January and December 2019.
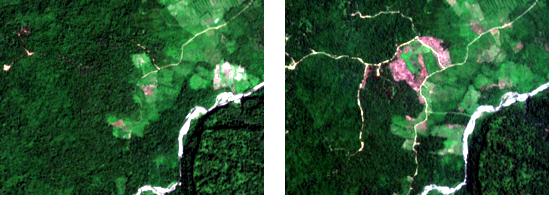
Left: Before (September 2018) Right: After (January 2019)
Satellite images (Sentinel-2) showing forest (green) on the left picture, going to deforested patches and roads on the right picture. The deforested patches look red/brown (typical tropical soil color) and roads look white/yellow.
Photo signals
Let’s take a closer look at how a satellite ‘sees’ forest changes. Satellites ‘take photos’ of the earth’s surface and transform them into signals. In the figure below you see the signal from a radar satellite called Sentinel-1 through time. This type of satellite is perfect for working in tropical areas, because it can look through the clouds, unlike satellites with optical sensors like Sentinel 2 or Landsat.
Radar backscatter from forests is stronger than backscatter from deforested areas. Knowing this, you can see when the trees in this area were cut. The figure below shows a radar signal for a pixel in the area shown above.
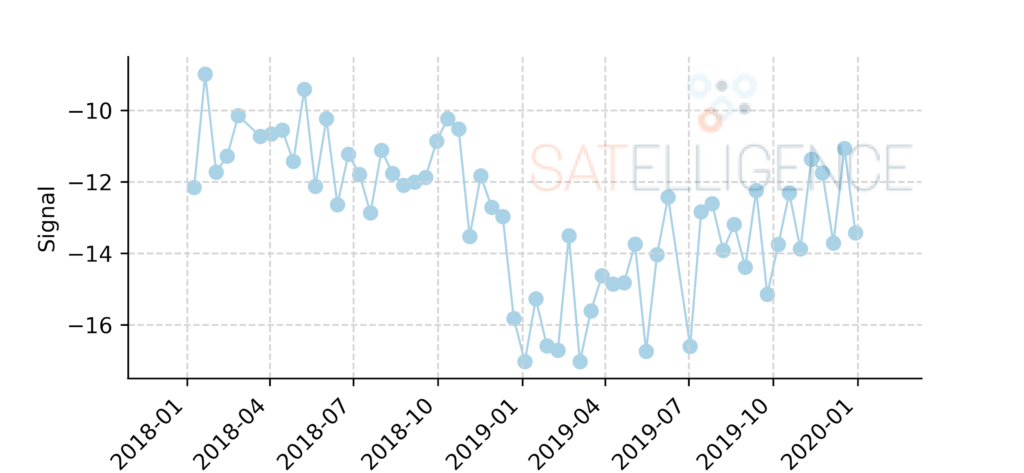
Signal of a Sentinel-1 radar satellite through time over a deforested area
Probability analysis
Just as we can see the change in the signal, so can an algorithm. The algorithm we use is called ‘Iterative Bayesian Updating’; a method that was first applied to radar satellite images for deforestation detection by Wageningen University, in collaboration with Satelligence1.
In short, this method calculates the probability that an area is deforested and “stacks” these probabilities in an iterative way to have a higher degree of certainty about the deforestation event. The method first ‘flags’ pixels as possibly deforested, which can be confirmed or rejected with a later measurement. When we apply the Bayesian Iterative Updating method to the deforested area near the Leuser National Park we can see it in action.
Bayesian Iterative Updating in action
In the animation below we see the values as measured by the satellite for the individual dates. We can also see what these values mean in terms of probability of deforestation (P Deforestation) and the probability as determined by the Bayesian Iterative Updating method (P Bayesian IU).
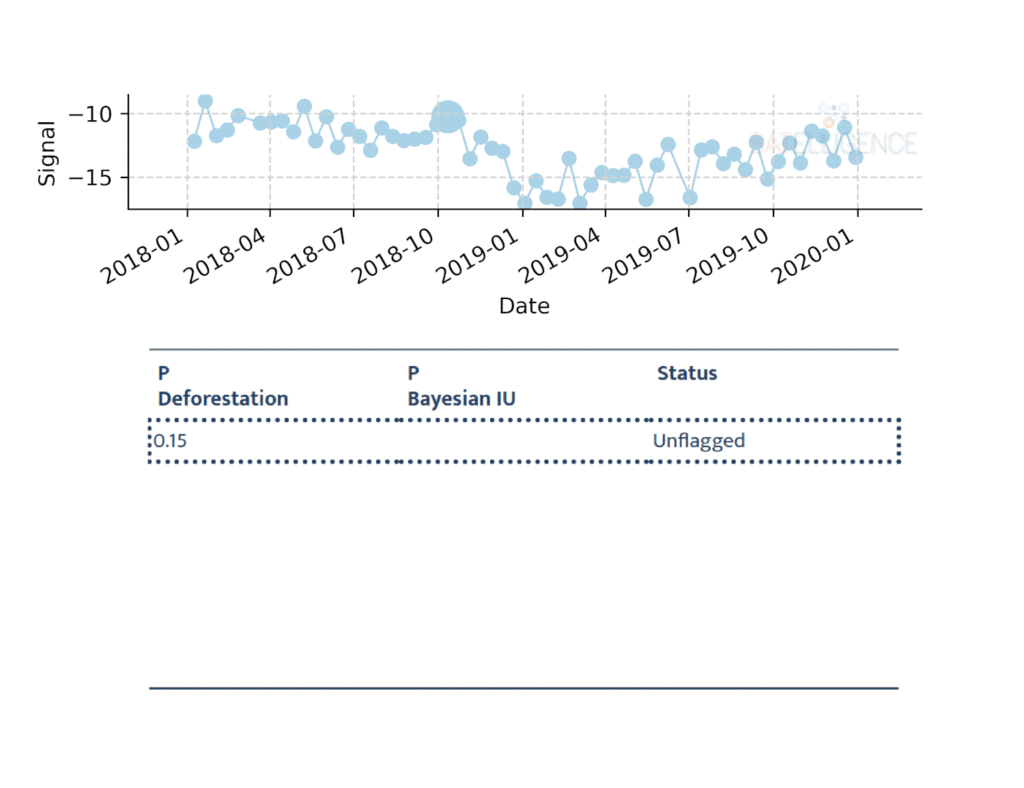
In the third row, the algorithm flags the value as a possible deforestation event, but it is not sure yet. In the next measurement, it seems as though the signal has increased again, so there might not be deforestation. In the following two measurements, however, we see the signal decrease again, and this time the algorithm is sure there has been deforestation; it confirms the deforestation event. We use the flag date as the date of deforestation, because that is the first time we saw the change. In this case, we know that the area was deforested before November 29, 2018.
The example in this blog only uses Sentinel-1 (radar) satellite data. However, the same method can be used on other satellite data as well, such as Landsat (5,7,8) and Sentinel-2. Because all of the outcomes produce probabilities, these can be combined to have even more measurements resulting in even more timely and confident change detection.
How to monitor the entire world
Imagine a single pixel from a satellite having a 100 square meter surface area (10x10m). The total surface area monitored for soft commodity related deforestation in the tropics is upward of 3 million square kilometers. A quick calculation shows that more than 3 billion pixels need to be processed on a near-real-time basis. These large scale calculations can not be done on laptops or on-premise servers, so we need to move one step higher: The Cloud.
Cloud processing
To get from raw satellite data to pixel-level change detection, hundreds of thousands of single satellite images are preprocessed, aligned and then processed with the change detection algorithm. This involves processing terabytes of data in parallel and requires a lot of computing resources. We do this, using an open system called Kubernetes.
Kubernetes allows you to use anything from a single computer to thousands of computers simultaneously. For example, pre-Kubernetes it would take more than a month to process the island of Sumatra, Indonesia. With Kubernetes, the whole of Indonesia and Malaysia, an area 10x larger than Sumatra, is processed in a matter of hours.
What makes a detected change actionable information?
When looking at all detected change, a lot of uninteresting change is picked up as well: changes in agricultural fields, water bodies or cities. But even when we only look at tree loss, that might be deforestation, but that might also be the harvesting of pulp plantations or plantation replanting of old oil palm trees. In order to take meaningful action based on the detected change, that needs to be filtered and ordered into something that’s called prioritized alerts.
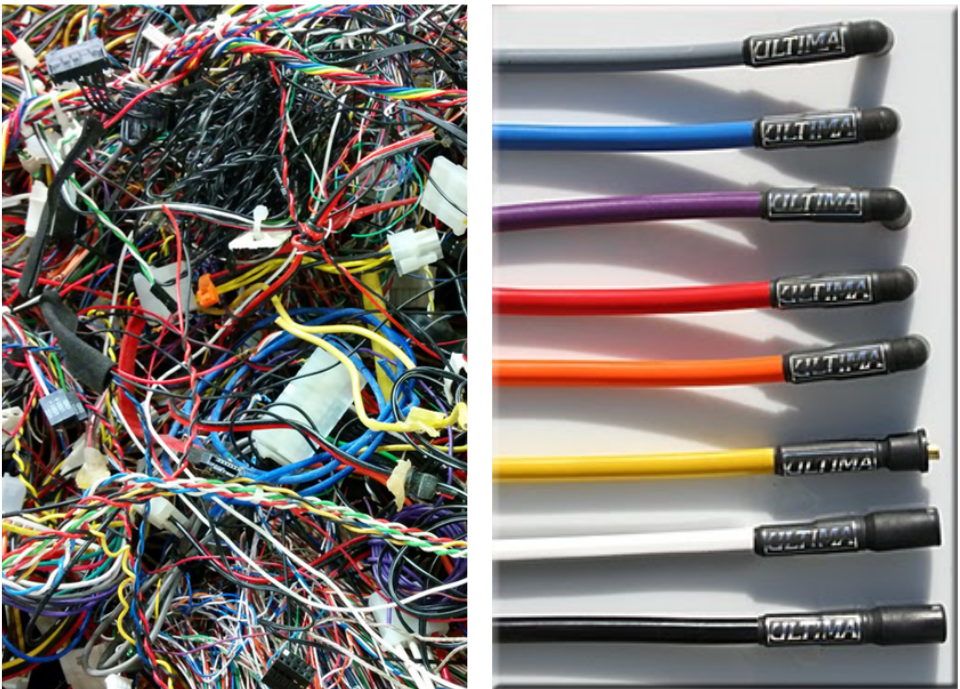
Going from all detected changes from satellite imagery to prioritised alerts is like unbundling a clutch of cables to look for a few specific ones
Prioritizing deforestation alert
At Satelligence we developed an alert prioritization framework to convert confirmed forest cover changes into actionable alerts. First of all, we define forest to be at least 1ha continuous natural tree cover. To ensure that we do not falsely classify an area as deforested, we go back to 1984 using the Landsat satellite archive and make sure that the area has never been deforested before.
Furthermore, we draft a list of alert conditions together with stakeholders. They, not us, define which type of alerts are most important. These conditions vary from a minimum deforested area to filtering deforestation that is within concessions or maybe varying area thresholds depending on whether deforestation happens inside protected areas or on peatland.
From deforestation alert to action
Prioritized deforestation alert results by themselves are useless. Action needs to be taken in order to give alerts real power. These follow-up actions involve sending in-field teams to investigate an alert and engage with parties involved. This leads to a decreased likelihood of repeated illegal deforestation by those parties.
Another measure that companies might take is to stop sourcing from particular areas because the sustainability of the commodity grower can no longer be guaranteed.
If you enjoyed this article about satellite-based deforestation alert, read more and subscribe to our monthly newsletter!


#


Next article

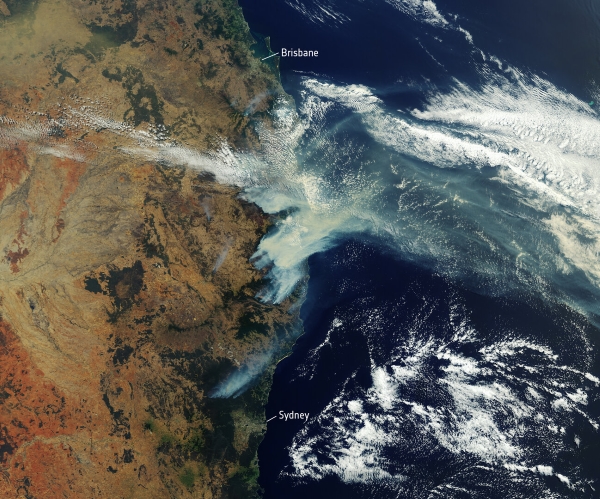
When Australia’s fire season begun in September 2019, nobody could have imaged it would turn out to be one of the worst seen in decades. The raging inferno has led to the death of at least 24 people and half a billion animals to date. More than 1,500 houses have been destroyed and roughly 15 million acres of land – about twice the size of Belgium – scorched. As the grim outlook continues, here are some satellite images that reveal just how bad the fires really are.
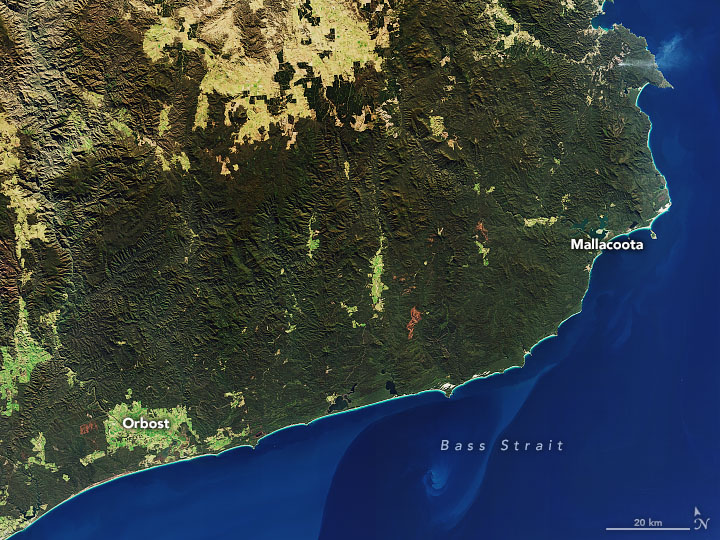
Southeastern Australia: Now and Then
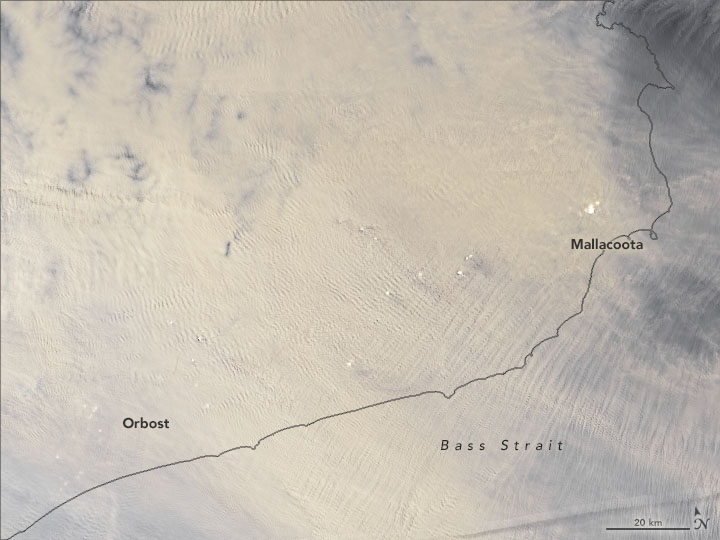
On January 1, 2020, the Operational Land Imager (OLI) on NASA’s Landsat 8 acquired a natural-color image (above) of thick smoke blanketing southeastern Australia along the border of Victoria and New South Wales. For comparison, the image below shows what the same area looked like under cloud- and smoke-free conditions on July 24, 2019.
Australia’s bushfires: Explosive fire in the state of Victoria
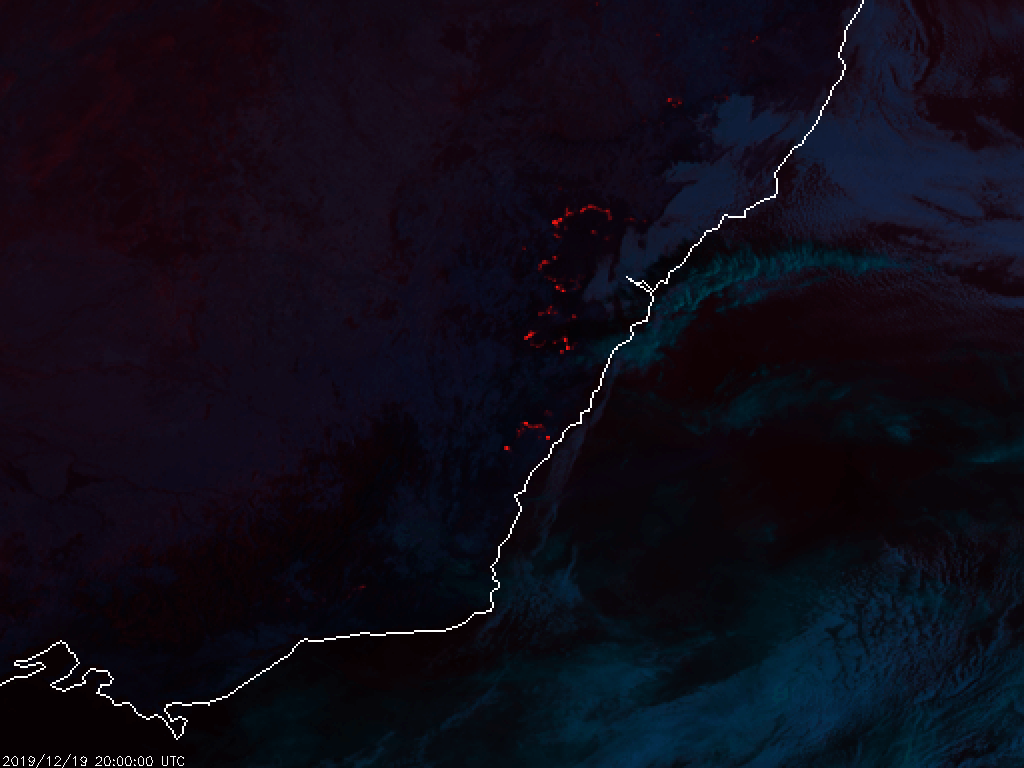
Japanese geostationary weather satellite Himawari-8 overlooks the western hemisphere and captures multi-band colored images every 10 minutes. On December 20, 2019, as massive wildfires raged in Australia, the satellite captured the below fire temperature.
Traces of Australia on New Zealand Glaciers
Acquired by NASA’s OLI, the below side-by-side comparison shows the areas of dirty snow and ice in New Zealand’s Southern Alps. While the left image shows the area on December 15, 2014, during a typical year, the image on the right was acquired on November 11, 2019, during the current bushfire season. Notice the difference in color and clarity of the images. 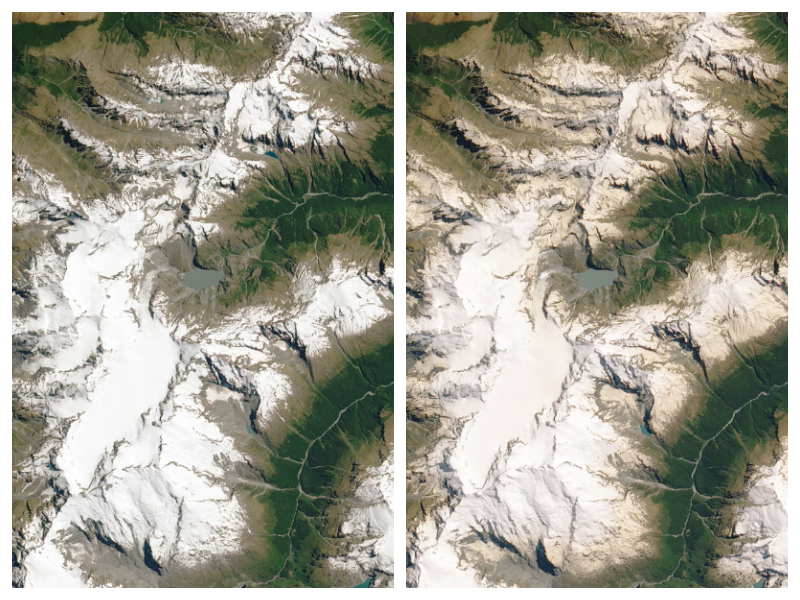
Australia’s bushfires: Colors of Fire
In this loop captured by Japan’s Himawari-8, you can see massive wildfires along the east coast. While the image on the left side shows natural fire color (aka day land cloud fire RGB), the one on the right highlights the hotspots in infrared light.
Massive Brownish-Gray Smoke
From its vantage point nearly 23,000 miles up, NOAA’s GOES-West weather monitoring satellite watches massive amounts of brownish-gray smoke from the Australian wildfires spreading over NewZealand and the South Pacific on January 3, 2020.
From its vantage point nearly 23,000 miles up, #GOESWest can see massive amounts of brownish-gray #smoke from the #AustralianBushFires spreading over #NewZealand and the #SouthPacific.
More real-time imagery: https://t.co/U2kJQTbbdy#FullDiskFriday #Australia #NSWFires #BushFire pic.twitter.com/Uv7v1MYmb4— NOAA Satellites (@NOAASatellites) January 3, 2020
Smoke Drifts over the Tasman Sea
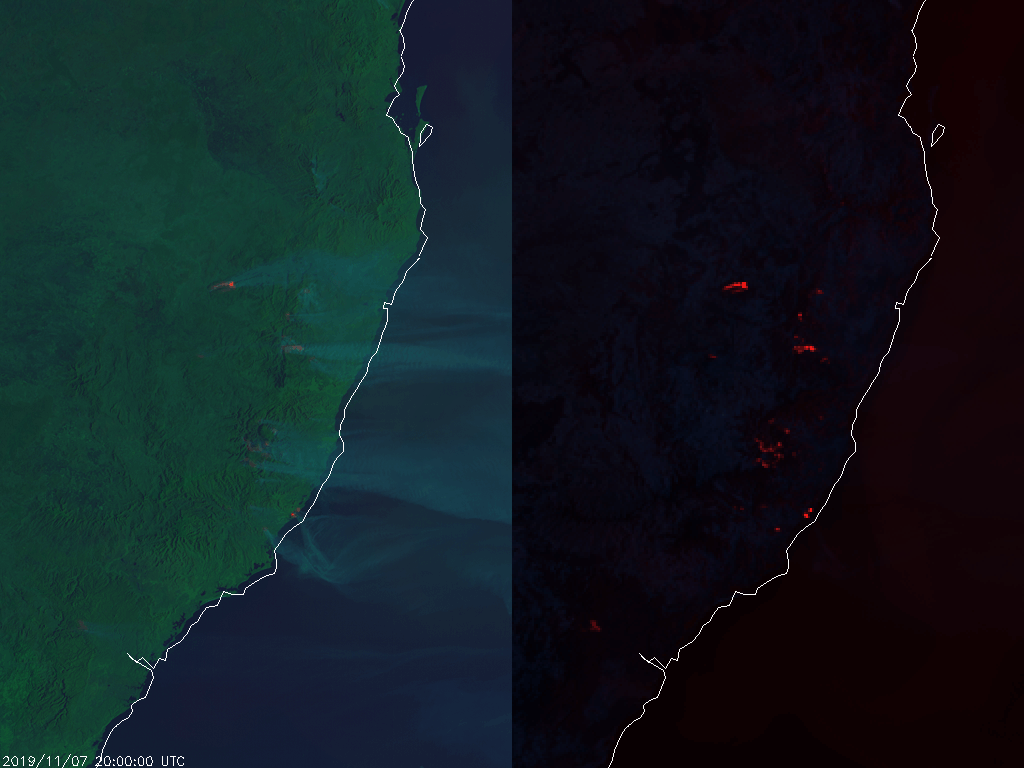
In this November 12, 2019 image, the Copernicus Sentinel-3 mission captured the multiple bushfires burning across Australia’s east coast with plumes of smoke drifting east over the Tasman Sea.
If you enjoyed this article, read more and subscribe to our monthly newsletter!