
Slot machines are one of the most popular forms of gambling in the world. Recent decades have seen a dramatic shift away from social forms of gambling played around roulette wheels and card tables to solitary gambling at electronic terminals. Modern slot machines typically feature video screens instead of mechanical reels, buttons instead of handles, and accept player credit cards instead of coins. Studies by a Brown University psychiatrist, Robert Breen, have found that this new means of gambling are far more engaging than playing cards or betting on sports. From one side this can increase playability, but on the hand may lead to gambling addiction.
From logical point of view one could imagine that areas with higher density of gambling machines are those where populations tend to be poorer, with lower than average economic activity and more people in lower income, lower status jobs. The recent research and spatial analysis by Geofutures revealed that the situation is much more complex.
Maps instantly reveal spatial differentiation, even down to find spatial scales, which together with our understanding of the differences between locations – their physical geography, their accessibility or the social and economic characteristics of their populations – can reveal previously unknown insights into phenomena. With additional analysis, data correlations observed for some studies may suggest causal factors.
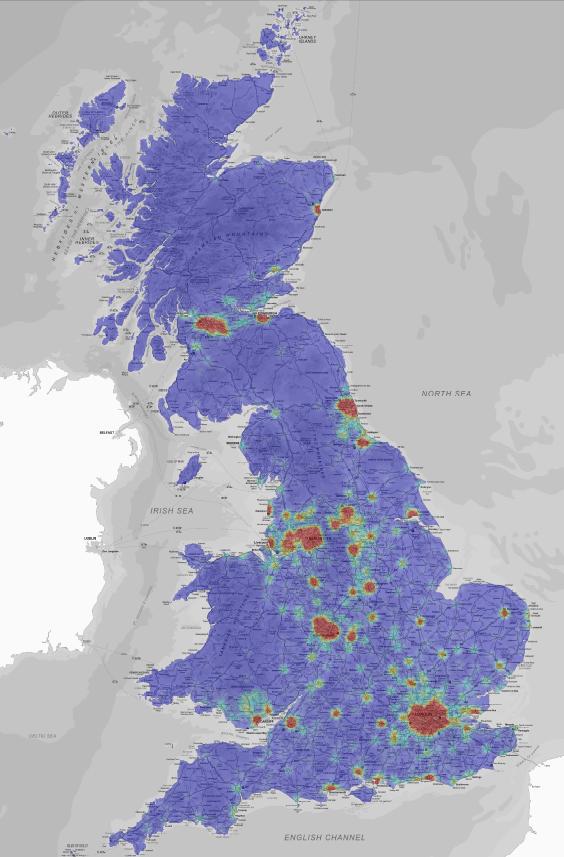
The map above shows all licensed venues, together with pubs having gambling machines, visualised as a density per square km. Centres of population stand out, as expected, but so do regional centres and seaside resorts, reflecting the geographic spread of all the leisure sectors associated with gambling machines.
But let’s look at it from a little bit higher level of detail and try to find the actual high density gambling areas. According to selected mapping approach buffer zones of 400m radius were created around every gambling machine venue. Where these were contiguous with the buffer surrounding a neighbouring venue, individual buffer geometries were dissolved into a single polygonal feature. The total number of machines for each zone were aggregated and joined as attributes to the machine zone (MZ) polygons. The total area for each MZ was calculated, in order to calculate the average number of machines per hectare (area of 100x100m). The average number of machines attributed to each location was aggregated into the corresponding MZ and the sum of the average number of machines per hectare calculated. This created our density estimate within the assumed area of 400m proximity. Individual areas with an average number of machines greater than 1 per hectare were selected and exported as a sub-set dataset and termed High Density Machine Zones.
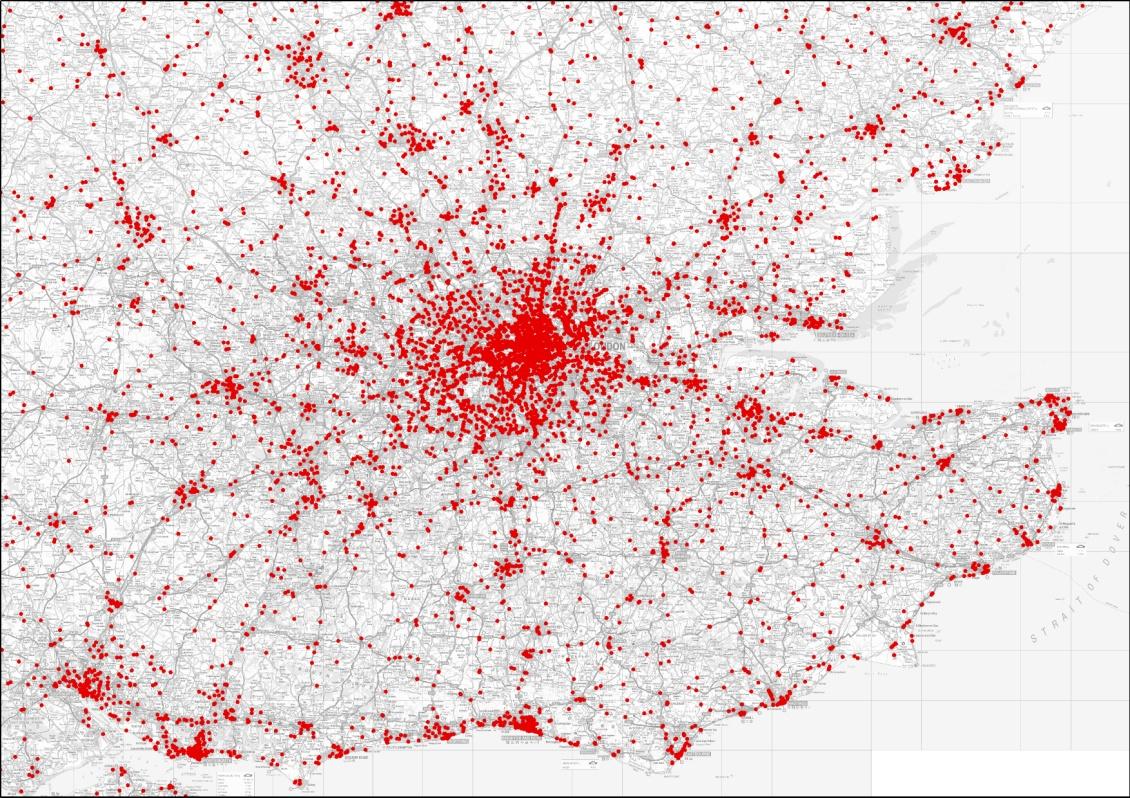
Machine Zones
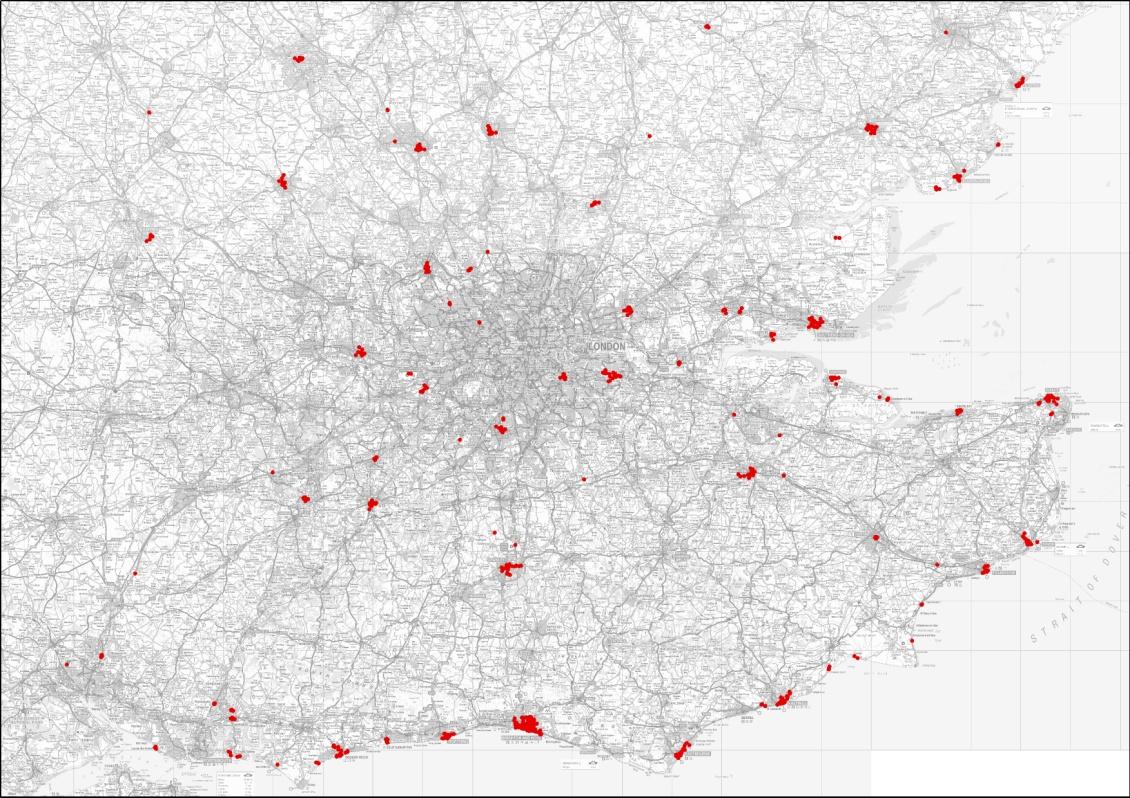
High Density Machine Zone
This map brought us to the final conclusion that gambling machine areas are not always in Britain’s poorer areas – some are in relatively wealthy parts of the country. High density zones are typically not present in very central, urban areas, but tend to be around satellite areas and towns. Central London had no high density zones. Moreover clusters of gambling machines is present in coastal, suburban or satellite towns as well as in a notable number of new towns. Finally analysing the data with demographic layer we can say that the populations of higher density zones also tend to have higher than average proportions of residents aged 16-34 and over 75.
Looking at these spatial analysis and maps makes us realize how popular slot machines are in Great Britain. Together with websites like Royal vegas online pokie games these new means of gambling are much more accessible, yet they are much less regulated than traditional brick and mortar casinos. While governments across Europe are working on proper legal regulations at the end it is us consumers who should decide to bet or not to bet.


#Business

Next article


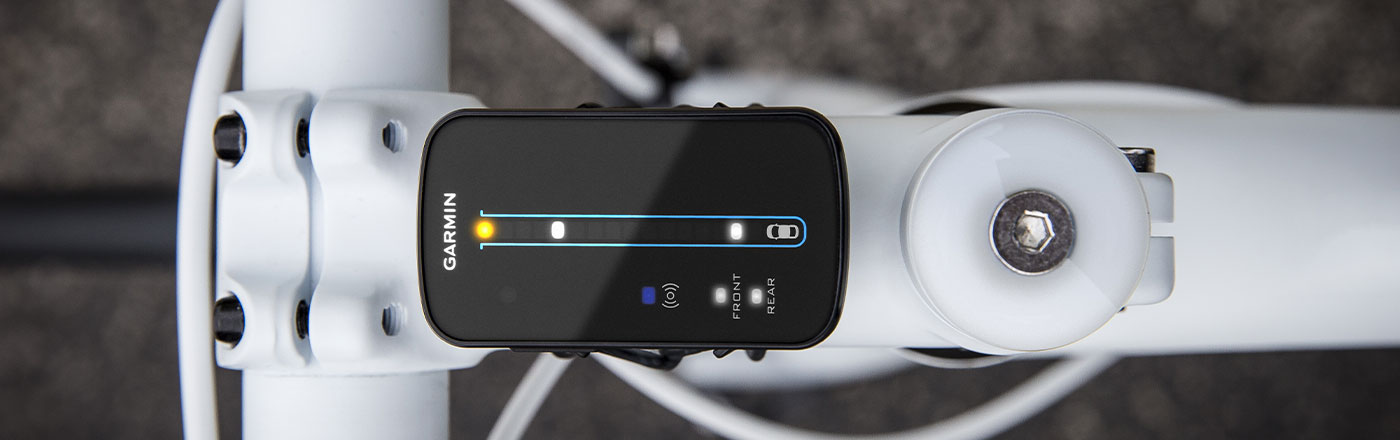 Earlier this month, Garmin released it’s new product – Varia Rearview Bike Radar, a low-energy radar sensor that scans up to 140m behind a bicycle for traffic. Varia Rearview is the result of Garmin’s acquisition, earlier this year, of a South African bike radar startup ikubu which developed low-energy radar technology for bikers called Backtracker.
The startup had made quite an impact, last year, raising over $127,000 in a crowd-funding campaign. A few months after their unsuccessful bid to be crowd-funded, Garmin acquired the company. Six months later, we have the launch of Varia Rearview Bike Radar – the world’s first bike radar!
Bike Radar System – Varia Rearview
The radar system scans up to 140m for incoming vehicles and then transmits this information to either a compatible Edge system or a standalone handlebar-mounted unit with an array of notification lights to warn you, the rider of the vehicle behind you and how fast it’s approaching, in addition to activating your back light to warn the vehicle of your presence.
The bike radar is an interesting idea and something that will definitely help the bikers. Perhaps in the future, we would see a system that also warns of collisions at intersections and other blind spots.