

Space exploration has never ceased to amaze us all and has for a long time now been the crux of many science fiction movies, the dream of many engineers and space scientists. At some stage or the other, you might have heard the saying “It’s not really rocket science” being used to clarify when something is considered to be “not so difficult”. Rocket Science is considered as one of the most difficult subjects on this planet. In case you are a skeptic, all that I can tell you from personal experience attending orbit mechanics courses is that the saying did not come into existence for nothing!
But really, how hard can rocket science be anyway?
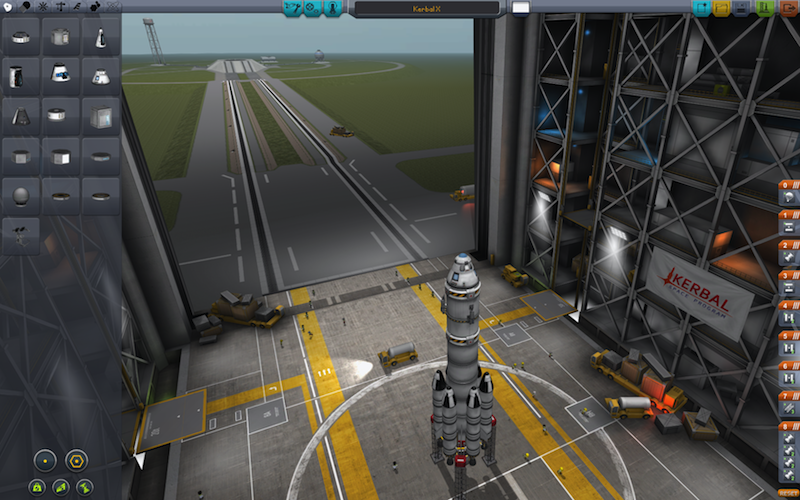
If you are one of those people who don’t want to attend a lecture to find out! How about playing a cool game where you get to build your own space station, mars mission and more! Yup, you read that right! It’s an actual PC game with really cool animation where you can build all those and more. The Kerbal Space Program is a full fledged (real) physics based, flight simulation game that is set in the fictional planet of Kerbal. The planet has all the physics of Earth i.e. the gravity and more. Take a look at the game trailer.
Version 1.0 was recently released and is priced at EUR 40 and a PS4 version is on its way. The game was in sandbox mode for a long time and underwent a lot of changes and definitely is one of the coolest, nerdiest game that I have ever come across. It is probably the first game in the domain of Space exploration and it is really worth your time!
Happy Gaming!


#

Next article

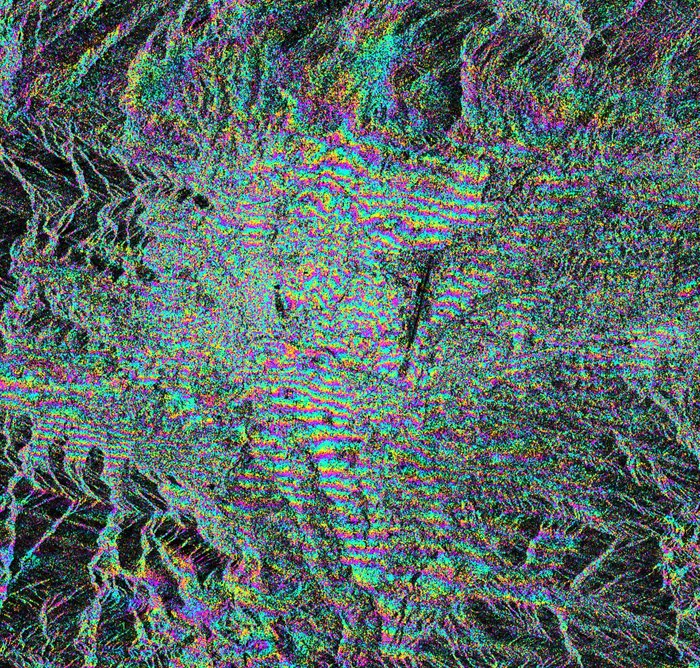
Radar images can be used to examine deformations of the land surface. Therefore an area of interest has to be recorded before and after a disruption event presuming the exactly equal orbit and inclination of the sensor. The wave patterns of the two images are combined and turned into a 3d surface. After removing topography, very small deformations (mm) can be detected even within space borne derived imagery. The technique is called radar interferometry (InSAR). It tells how much a land surface moved in relation to the satellite in orbit.
Nepal and particularly the area around its capital Kathmandu were hit by a strong earthquake on April 25 2015. The 7.8 magnitude earthquake claimed over 5000 dead people and affected millions of people living in that area.
For the earthquake in Nepal, Sentinel-1A’s swath width of 250 km over land surfaces has allowed for an unprecedented area size to be analysed from a single scan. Two images taken before and after the earthquake were combined. The resulting interference patterns reveal the extent of deformation, whereas one colour fringe refers to a deformation of around half of the used radar wave length (ca 2,8cm). Thus, colour tapes lying close together imply a high deformation whereas dispersed colour bands refer to less affected surface disruptions. Radar imagery from the Sentinel-1A satellite shows that the maximum land deformation is only 17 km from Nepal’s capital, Kathmandu, which explains the extremely high damage experienced in this area.
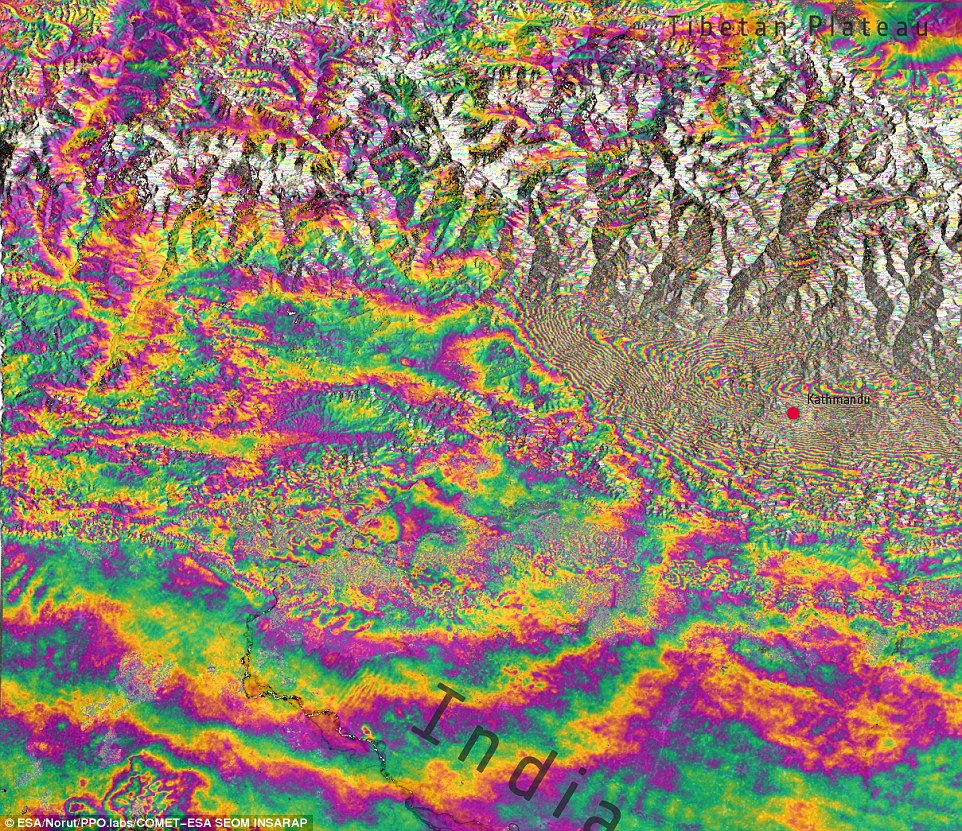
Interferogram over Kathmandu, Nepal, derived from two Sentinel-1A scans on 17 and 29 April 2015 – before and after the 25 April earthquake. Each ‘fringe’ of colour represents about 2.8 cm of deformation. The large amount of fringes indicates a large deformation pattern with ground motions of 1 m or more. Source: ESA
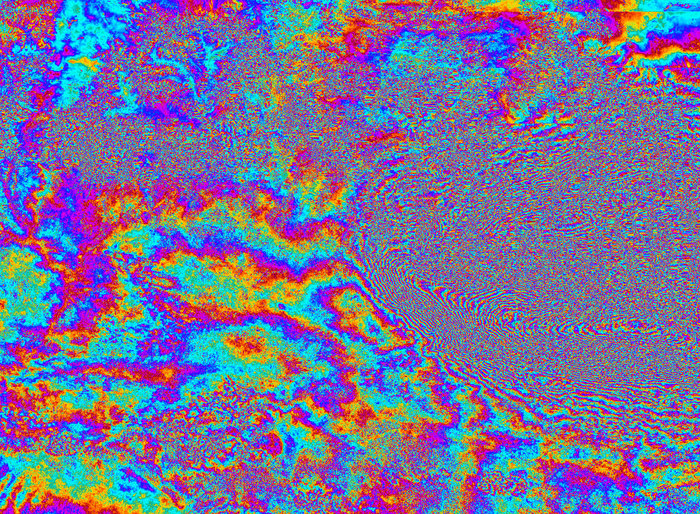
The interference pattern itself does not reveal weather the surface lifted or dropped. Scientists from the German Aerospace Agency (DLR) have used data from Sentinel 1-A to create a map that reveals how much and in which direction the land in and around Kathmandu moved in relation to the satellite in orbit. The map is counterintuitive in the sense that blue colors (negative value) indicate areas that raised, while the yellowish to reddish tone reveals areas that sagged (positive values) due to the earthquake. The map shows that the terrain in Kathmandu raised by around 0.8m, the mountainous area right in the North of Nepal’s capital thrusted skywards of up to 2m! At the same time the mountainous region farther North of Kathmandu dropped by less than a meter.
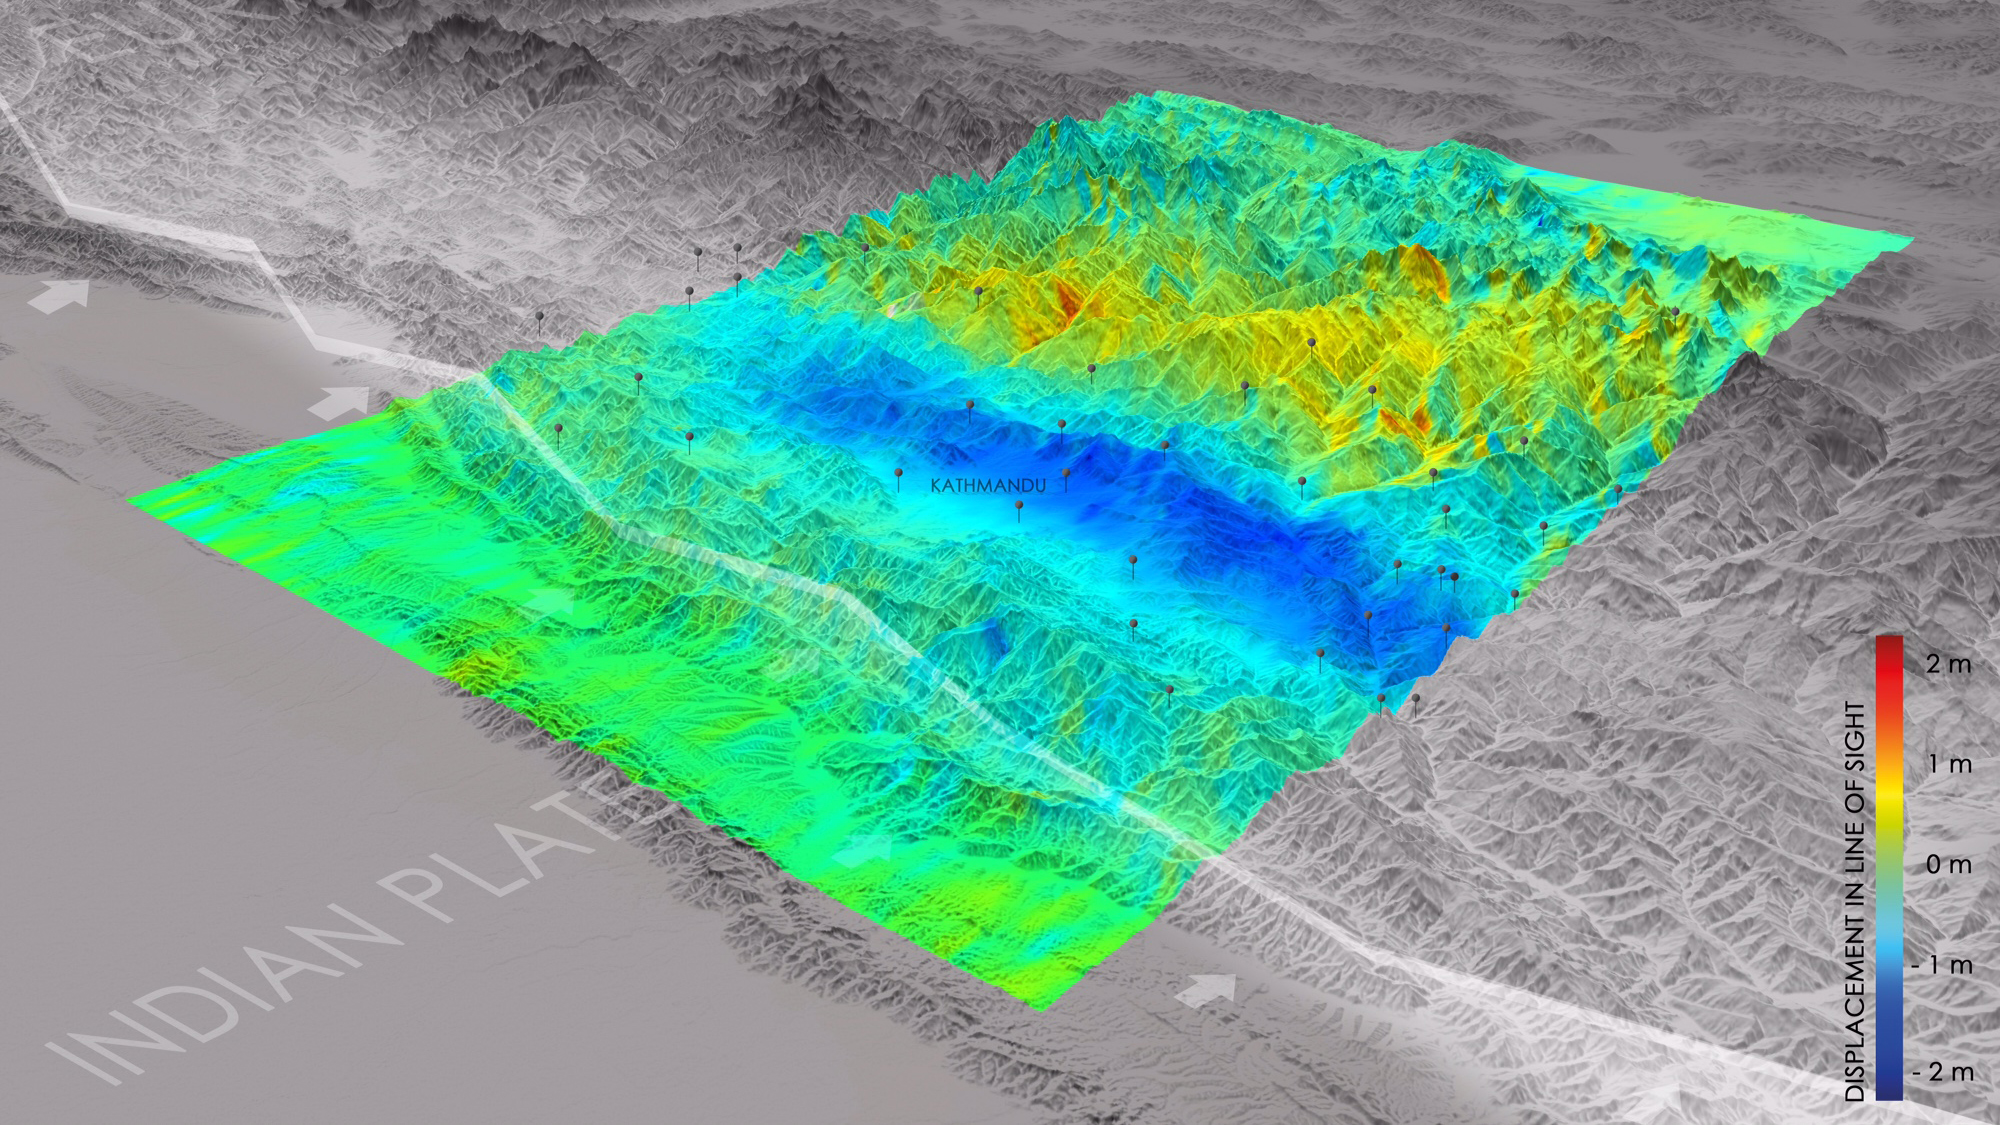
Changes in elevation and position that occurred as a result of the April 25, 2015 earthquake in Nepal are depicted in this image based on satellite data. Areas in blue were raised by about 0,8 meters, the ones in dark blue were lifted up to 2,5 meters. (Source: DLR)
Imagery from the Sentinels and other Copernicus contributing missions are coordinated by ESA to be used by the Copernicus Emergency Management Service (EMS), which supports all phases of the emergency management cycle. Sentinel-1A is the first satellite for the Copernicus environment-monitoring programme led by the European Commission. Its all-weather, day-or-night radar imagery is particularly suited to support impact assessment for many types of geohazards. The satellite is planned to provide systematic observations of tectonic and volcanic areas at global level.