
 Last year, a record 31.19 million tourists travelled to Japan. This made 2018 the sixth consecutive year to have registered an all-time high in the number of visitors to the Land of the Rising Sun. And this number is only bound to increase because later this year, Rugby World Cup is being held in Japan. And in 2020, Tokyo is playing host to Olympics and Paralympics. The government, in fact, is positive that the number of tourists visiting the nation will reach 40 million in 2020.
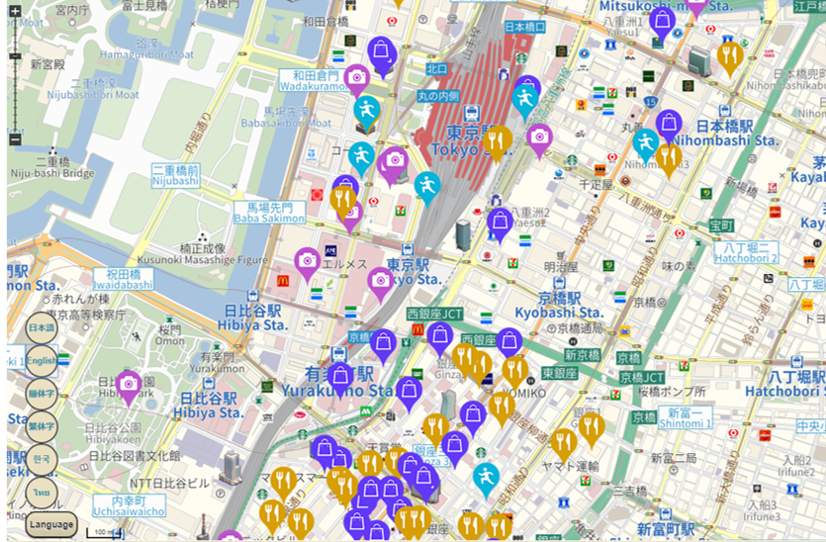
Naturally, with so many tourists visiting Japan – especially from areas like China, Europe, the United States, and Australia – the demand for local maps in mobile applications is bound to rise. And these maps not only need to be multilingual, but they must also possess a location precision so uncanny that the travellers are left impressed as well as encouraged to visit again.

The landscape of Tokyo city
This is where an accurate map database comes into the picture. Be it city map data, address data, points of interest (POI) data, road network data, 3D building data, phone number data, or voice guidance/illustration – high-quality, fresh, and accurate data is the backbone of any information system or service.
Map content provider INCREMENT P started the creation and maintenance of original map data in Japan in 1994, making 2019 their 25th year in the mapping business. Fully owned by car navigation hardware company Pioneer, INCREMENT P began its journey by providing map data to its parent organization’s in-car navigation systems, before graduating to making digital map software for PCs and map software development kits for business use cases.
By 2002, the multiple-award-winning company was starting the distribution of map data to online connected car navigation systems – a first in the world.
In 2004, when its digital mapping software for PCs had already garnered a solid fan base of 1 million users, INCREMENT P started focusing on developing map content for mobile phones. And following the first support for multilingual maps in 2008.
INCREMENT P expanded its map business into Southeast Asia. They opened the branch office in Bangkok, 2015 and succeeded to release 10 ASEAN countries map data. (Thailand, Malaysia, Singapore, Indonesia, Vietnam, Philippines, Cambodia, Myanmar, Laos, Brunei)
As for HD mapping project of Japan, INCREMENT P is one of the shareholders for Dynamic Map Platform Co. Ltd. in 2017 and involved common base HD map data for autonomous driving for expressways of Japan.
For their latest activity of the additional data to their map API, INCREMENT P will release traffic jam information through their Traffic API in this year. This enables accurate travelling time calculation for routing.
Today, there is no better company than INCREMENT P to provide the most accurate and up-to-date local “address point database” in Japan as well. Its dataset consists of five layers – prefecture, municipality, district, block, and house number. And it is so detailed that even if the same address is used for multiple buildings, these guys are able to assign an individual address point to each building. The official name and the commonly-used local names for addresses are also defined clearly to make sure tourists do not get confused by colloquial lingo.
The address polygon corresponds to reverse geocoding and can be associated with sales activity list and big data, making it perfect for marketing, disaster prevention, environmental enhancement purposes, etc. Meanwhile, postal data support ensures that tourists can easily conduct searches using postal codes as well.
And did you know that INCREMENT P has been driving all over Japan since 2005 and capturing pictures at intervals of 5-meters? The company wants to make sure it eliminates the alleys that are not suitable for driving and provide a road network data that is bang on – right from road names and signboard information to traffic restrictions and intersection information.

Another factor that makes INCREMENT P the perfect mapping database partner for foreign residents and inbound tourists is its support for multiple languages. The annotations are available in 13 languages – English, Chinese (both simplified and traditional), Korean, Thai, Indonesian, German, French, Italian, Spanish, Portuguese, Russian, Vietnamese, and of course, Japanese. Phew!
Japan may be looking at an inflow of 40 million tourists in 2020, but with the right mapping database, companies can make sure that they make the visitors feel right at home.

#Science


Next article

Changing with the times, the curb is no longer just the elevated edge along the side of the street. It is now used to describe an intermediate zone alongside a road, including transit bays, street parking, “flex zones”, valet lanes, bicycle lanes, Transportation Network Company (TNC) pick-up and drop-off areas, or commercial loading zones. The evolution of transportation technologies, infrastructure, and mobility tools means that the curb is increasingly important. As a result, the curb can—and should—be inventoried and mapped. This raises inevitable questions for OpenStreetMap: how do you manage and map the diverse uses of the curb, with specifics pertaining to size, usage, and time restrictions?
The OpenStreetMap Wiki contains a few entries for “curb” (mainly correcting to the British spelling, “kerb”) This includes Key:kerb, which is defined as the edge where a road meets a sidewalk . The entry goes on to state:
As these are transition points between different surfaces and/or elevations, the locations of kerbs are important features to pedestrians, cyclists, and especially to those with reduced mobility (e.g., in wheelchairs)
In this case, the curb is meant to be mapped as a node in a way, like the point where a sidewalk crosses a lowered or flush curb and becomes a marked crosswalk. This is the curb as a point, in one dimension.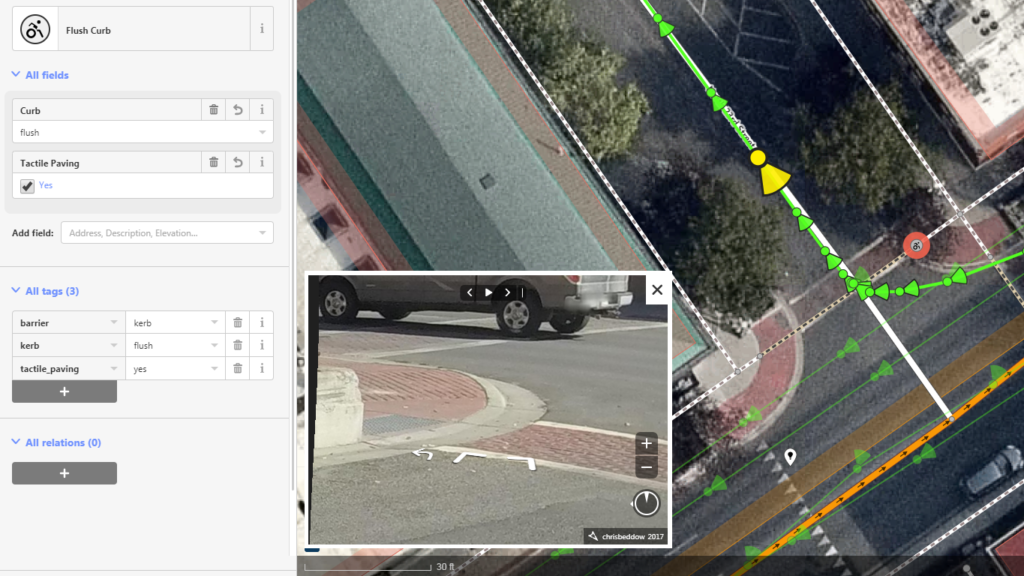
Meanwhile, the Tag_barrier=kerb entry on the wiki describes the curb as a line, but with a third dimension as well: height. The entry is very brief, and mainly consists of the following:
…barrier=kerb is a barrier for vehicles and wheelchair drivers. The height of the kerb is important and with this information, the usage by different groups can be determined. The height of the kerb is tagged additionally as height=*, if available. Right side is bottom, left side is top.
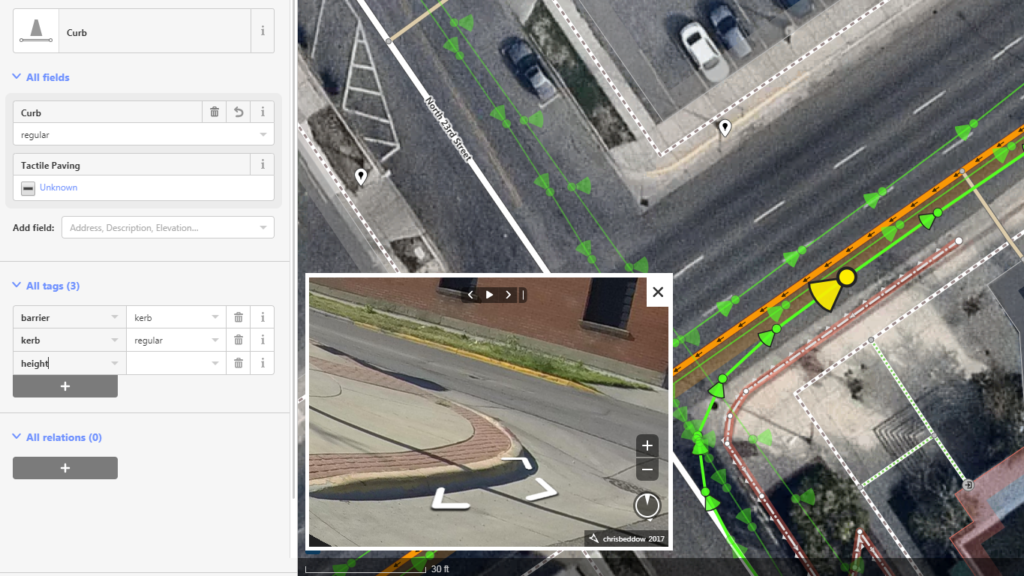
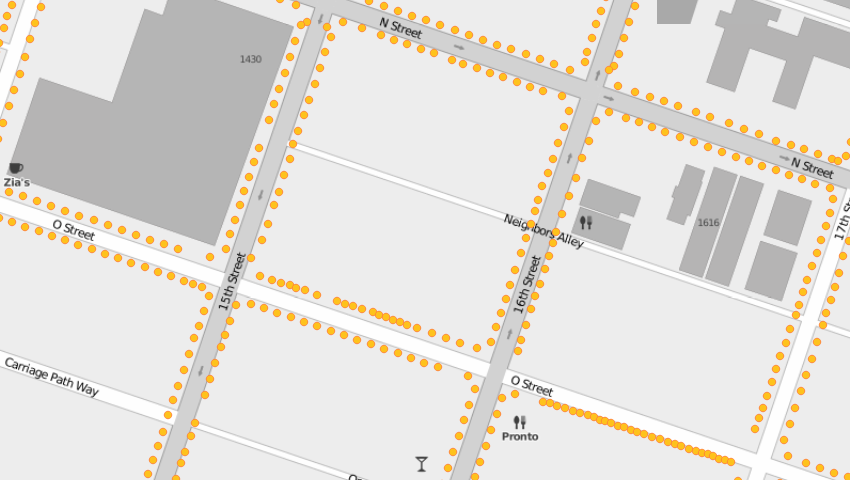
This is the beginning of the curb as a discrete feature on the map. Using OSM iD editor in a downtown area, we can spot a curb in the nearest Mapillary image, then follow the curb outline using Digital Globe Premium basemap. It can be marked as a regular curb, while it’s not certain if the brick edge counts as tactile. When noting the height, there’s a clear need to physically measure the particular curb. This curb and the one across the street are both yellow, indicating no parking is allowed—but there’s currently no way to indicate this in OSM.
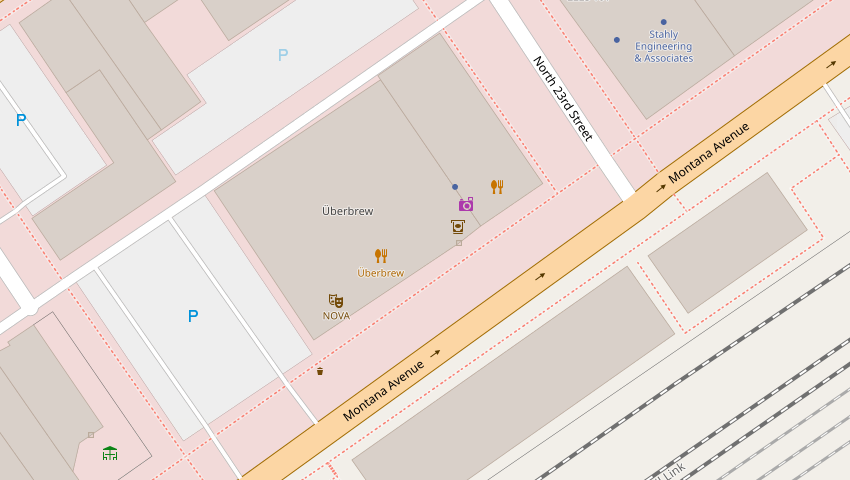
Examining the OpenStreetMap base layer, it’s easy to see how much detail is missing compared to a satellite map. Mapillary images are a reminder of how much rich detail is on the ground when doing some armchair mapping. And of course, if you’re on the ground, whether out for a walk, driving and parking a vehicle, or cycling just beside the curb, it’s obvious that the map isn’t very detailed about the “spaces in between”. In other words, there is a significant amount of information missing. When a machine needs to access map data—whether a routing service using the Overpass API, or a hypothetical autonomous vehicle—the OSM database is simply not very informative about the curb.
 There are ways to demarcate the diverse uses of a static location within OSM, such as through the use of “conditional tagging” such as parking:lanes:conditional. This, however, limits the mapping of the curb to adding conditions to existing line segments, in this case, lanes on the street. But, how do you map an actual polygon that emphasizes the dimensions of a specific curb space, and where do you then provide descriptions of its diverse uses? For example, two vehicle zones may serve as residential parking at nighttime, but function as TNC drop-off and pick-up zones as well as loading areas for deliveries during the day. Perhaps that whole zone additionally functions as a bus lane during peak hours in order to control congestion.
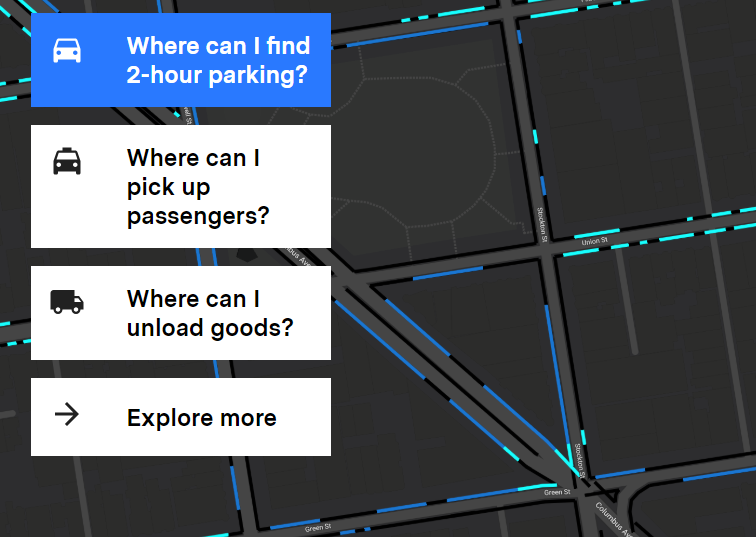
These are merely a few of many examples. The fact that OpenStreetMap has failed to embrace the curb is important for the entire OSM community. If this continues, another platform will inevitably take the lead. Mapping the curb is already becoming a game changer, seen for example in such cities as Los Angeles and San Francisco where Coord, powered by Sidewalk Labs, helped put intricate details of curb classification and regulations into an API that can empower applications that need to get information about the curb at a given longitude and latitude. While this data is painstakingly collected in order to be accurate and precise, curb data is also collected through more automated methods such as Mapillary’s computer vision, which intelligently detects and classifies curbs in street-level imagery.
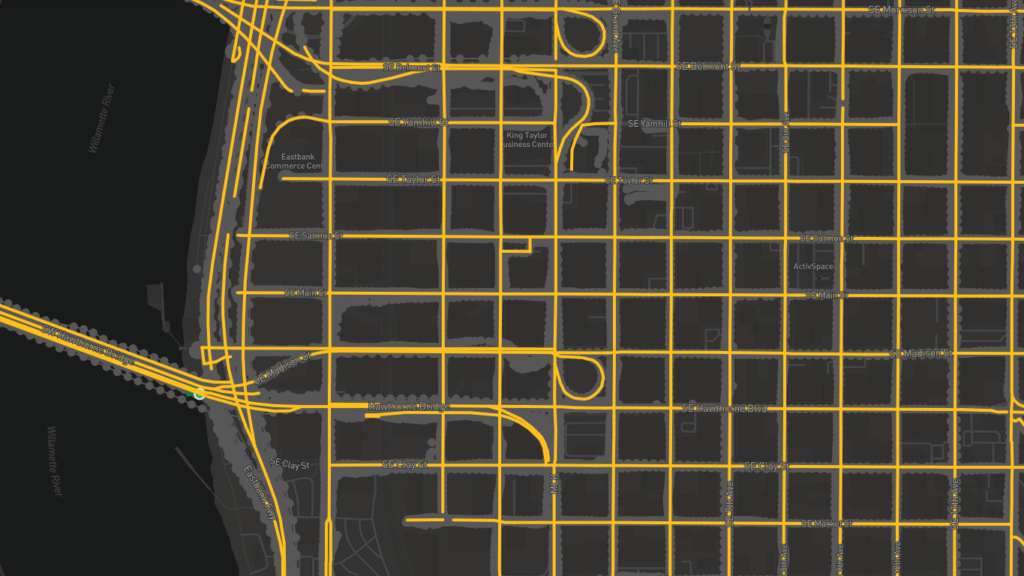
Collecting the data is a massive challenge, but organizing, analyzing, and sharing it is just as daunting. SharedStreeets is pioneering an open standard and data exchange for road network information, geared toward increasing private and public partnerships when sharing such data as curb regulations. Meanwhile, Remix specializes in helping cities to understand private data when enforcing regulations and planning policies. But why are we not doing this via an open platform, such as OSM? Most, if not all of this is happening in parallel to OpenStreetMap, rather than in collaboration. Where do these paths cross, between open public data, privately collected data, and the world’s decentralized, yet standardized open map (or database)?
The power of OSM is in its function as a map that can be commonly contributed to as well as commonly used. Having the ability to map the curb with tools improved and standardized by OSM, with the curb as its own tag and polygons specified certain curbside uses, would adopt the wonderful world of open source mapping into the rapidly changing present and future. Maps are certainly changing as technology evolves, and as maps are used less for human navigation than for machine navigation, their purpose needs to not shift but to expand. As Justin O’Beirne wrote in a 2017 analysis, “we’ll start caring more about the macro than the micro”. This indicates a shift in how humans read maps, yet while we are looking for POIs our transportation mode will be looking for the micro-level details that we don’t need to consciously consider as map consumers.
So, the question remains—will OSM embrace the curb? If OSM is to remain a map for humans, which it very much is, then the macro-level is sufficient. OSM’s status as the best map of the world, however, calls for unifying these macro and micro details together in a database of everything in the physical world—for humans and our machines. In order to achieve this, the question should be extended: how will OSM embrace the curb?
By Daniela Waltersdorfer J (@DWaltersdorfer), Transportation Analyst at Cambridge Systematics, and Christopher Beddow (@c_beddow), Solutions Engineer at Mapillary.