

So nowadays I think everyone has heard about the possibility to look at stuff near real time via satellite imagery. But does this really add value to my work? Is this in my company’s budget? See this short example as your first entry into the world of remote sensing.
The comparison includes screenshots from imagery taken mid April of the harbor of Cape Town. The software used is the Sentinel Hub EO-Browser. The EO-Browser of Sentinel Hub is a really useful piece of software funded by the European Union. In the browser-based application you can search, visualize and download satellite imagery with a focus on data from the EU Sentinel Missions.
The highest resolution of free data you will get with Sentinel 2 products (10m). For the harbor at Cape Town the result looks like this:
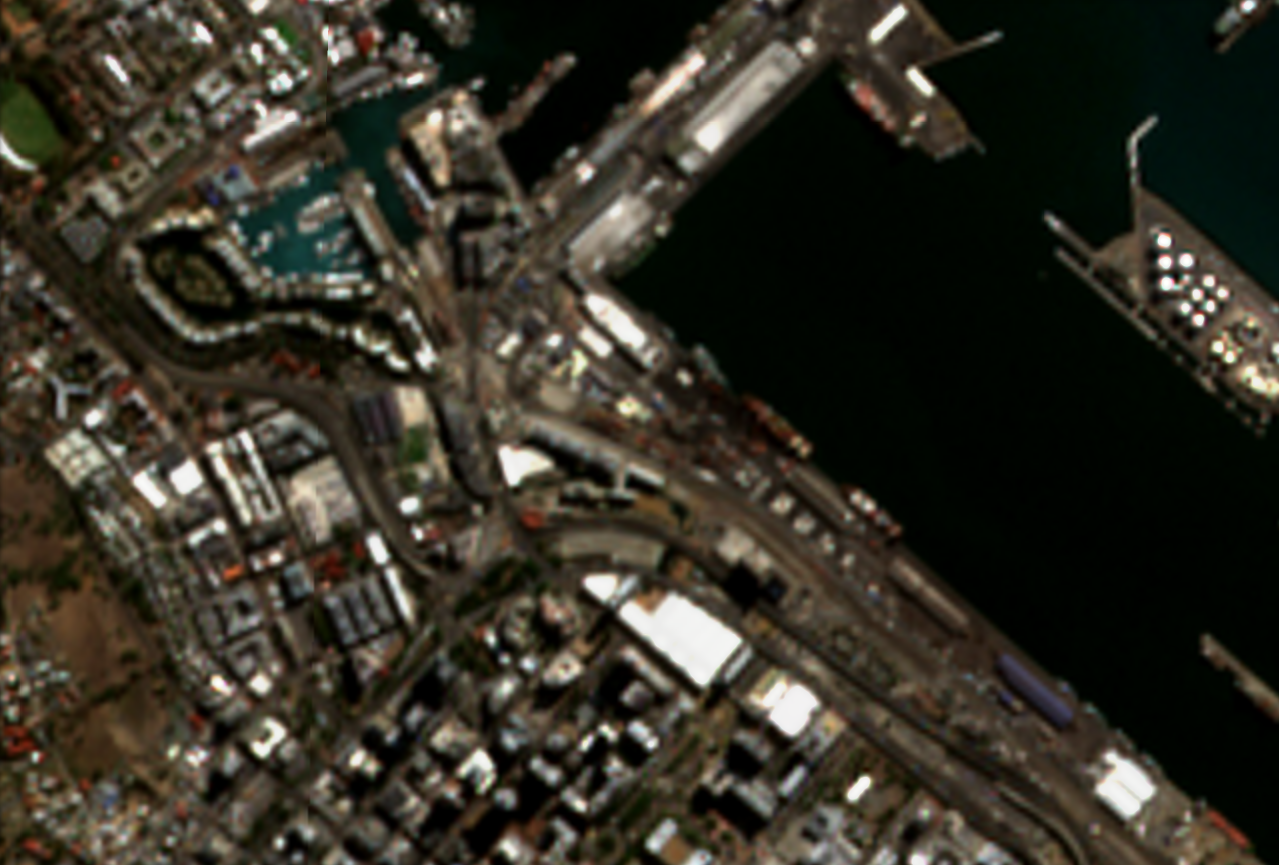
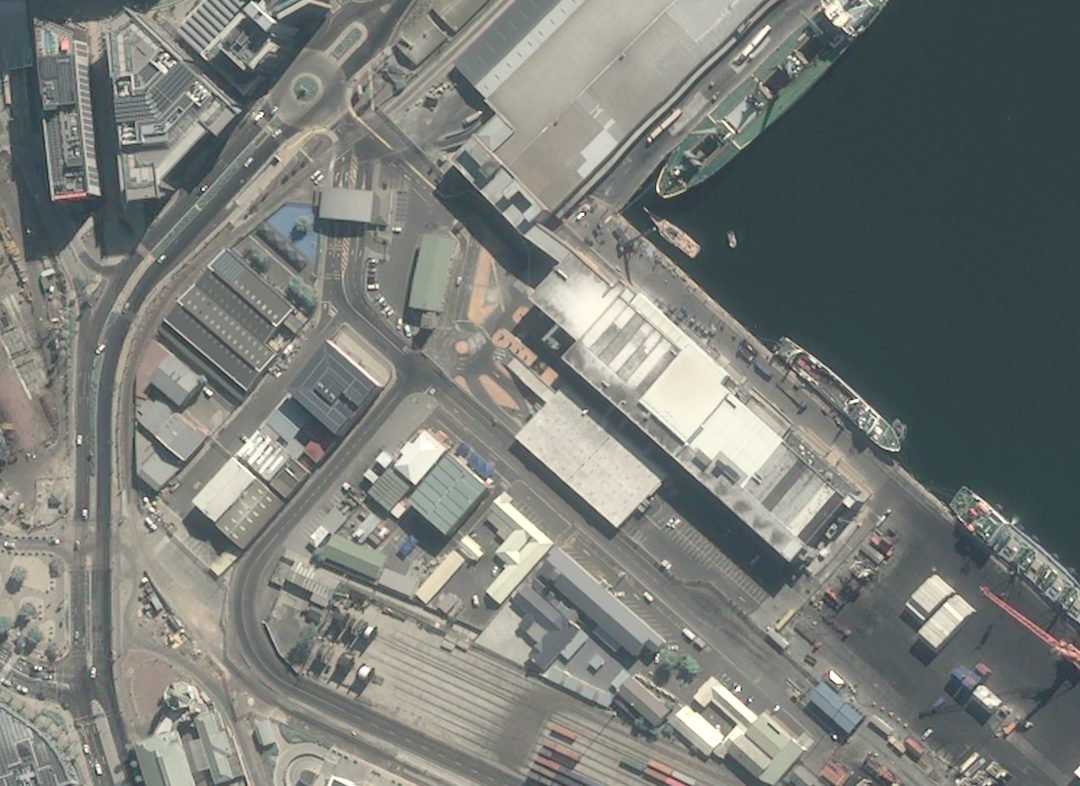
The image gives a good overview, but you cannot detect any details on e. g. a single building. If you thus manage a small construction site, this might not be enough. But this is the most you will get out of near real time remote sensing if you do not want to spend any money. However, if you have a budget you can subscribe to a service that includes imagery from other satellites. Popular is the Pleiades satellite with a resolution of 0.5m. In Cape Town an image from Pleiades looks like this:
If this is interesting for you, the next question is: What is the pricing of such construction monitoring? That depends on how much data you will need / how big your construction site is. Sentinel Hub offers a subscription package which includes Pleiades imagery at 999€ per year and you can also check it out with a free trial.
Did you like the article about construction monitoring? Read more and subscribe to our monthly newsletter!


#


Next article
“Tom Orrow”
This is how I read the word “tomorrow”, for a few weeks.
I was in primary school—nine years old, to be exact. I came across this ‘strange’ word whilst reading a story in an English textbook. The story was about Tom, Mary and a weaver bird, and I was convinced that “tomorrow” was a variation of Tom’s name.
The reason this has stuck in my memory could be because of the eccentricity of my reading—let alone understanding. This single incident seems to typify one element that makes going to school important.
According to the World Bank, half the children in low and middle-income countries can’t read and understand a simple text by age 10. They read below the minimum proficiency level. While it’s essential that children attend school, this alone isn’t sufficient to achieve the SDG goal of quality education.
The many students who read below the minimum proficiency level evidence weaknesses in education systems. With the pandemic and school shutdowns, the situation is worse.
With schools closed and with limited or non-existent infrastructure to connect to distance learning services, children’s education and therefore future opportunities are hampered significantly. Therefore, it’s critical to connect schools and pupils to the internet.
To do this, one needs to know the school’s locations, and how connected they are. Unfortunately, often, these records don’t exist, are incomplete or have errors. Furthermore, creating detailed maps is an expensive and time-consuming process.
Fortunately, advances in Earth observation—both in resolution and frequency—and new computational techniques, such as deep learning, present an opportunity to do things that weren’t possible before.
By integrating human knowledge in machine learning models, the school mapping process can be faster and cheaper. It’s a new step toward using automated mapping tools to solve important social problems.
Development Seed, an engineering and product company that applies earth data, developed artificial intelligence (AI) models that use Maxar high-resolution satellite images to rapidly and automatically map schools in nine countries.
The project is part of Giga, a Global initiative by UNICEF to connect every school to the internet.
The ultimate goal is to map every school in the world and show their connectivity in real-time. Such a map can help reduce the digital divide in education and improve access to information, digital goods, and opportunities for entire communities.
The nine countries covered by the Development Seed project are only a little piece of the map.
You must be wondering, what results did Development Seed achieve by using AI?
The Outcomes
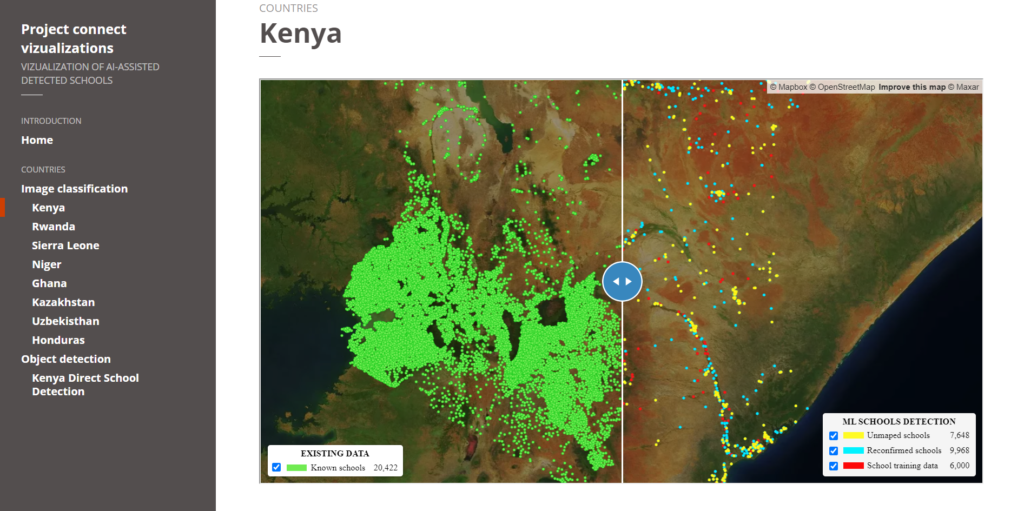
Approximately 18,000 previously unmapped schools across five African countries—Kenya, Rwanda, Sierra Leone, Ghana, and Niger—were identified in the satellite imagery by a deep learning classification model. Thereafter, expert mappers validated the schools before Development Seed added them to the map.

Screenshot of the image classification results. Source.
Furthermore, Development Seed added and validated nearly 4,000 unmapped schools in Kazakhstan and Uzbekistan (in Asia) and 1,100 schools in Honduras (Central America).
In addition to finding previously unmapped schools, the percentage of already mapped schools correctly identified by the model ranged from 43% to 79%, depending on the country.
Here’s how they did it.
The Approach
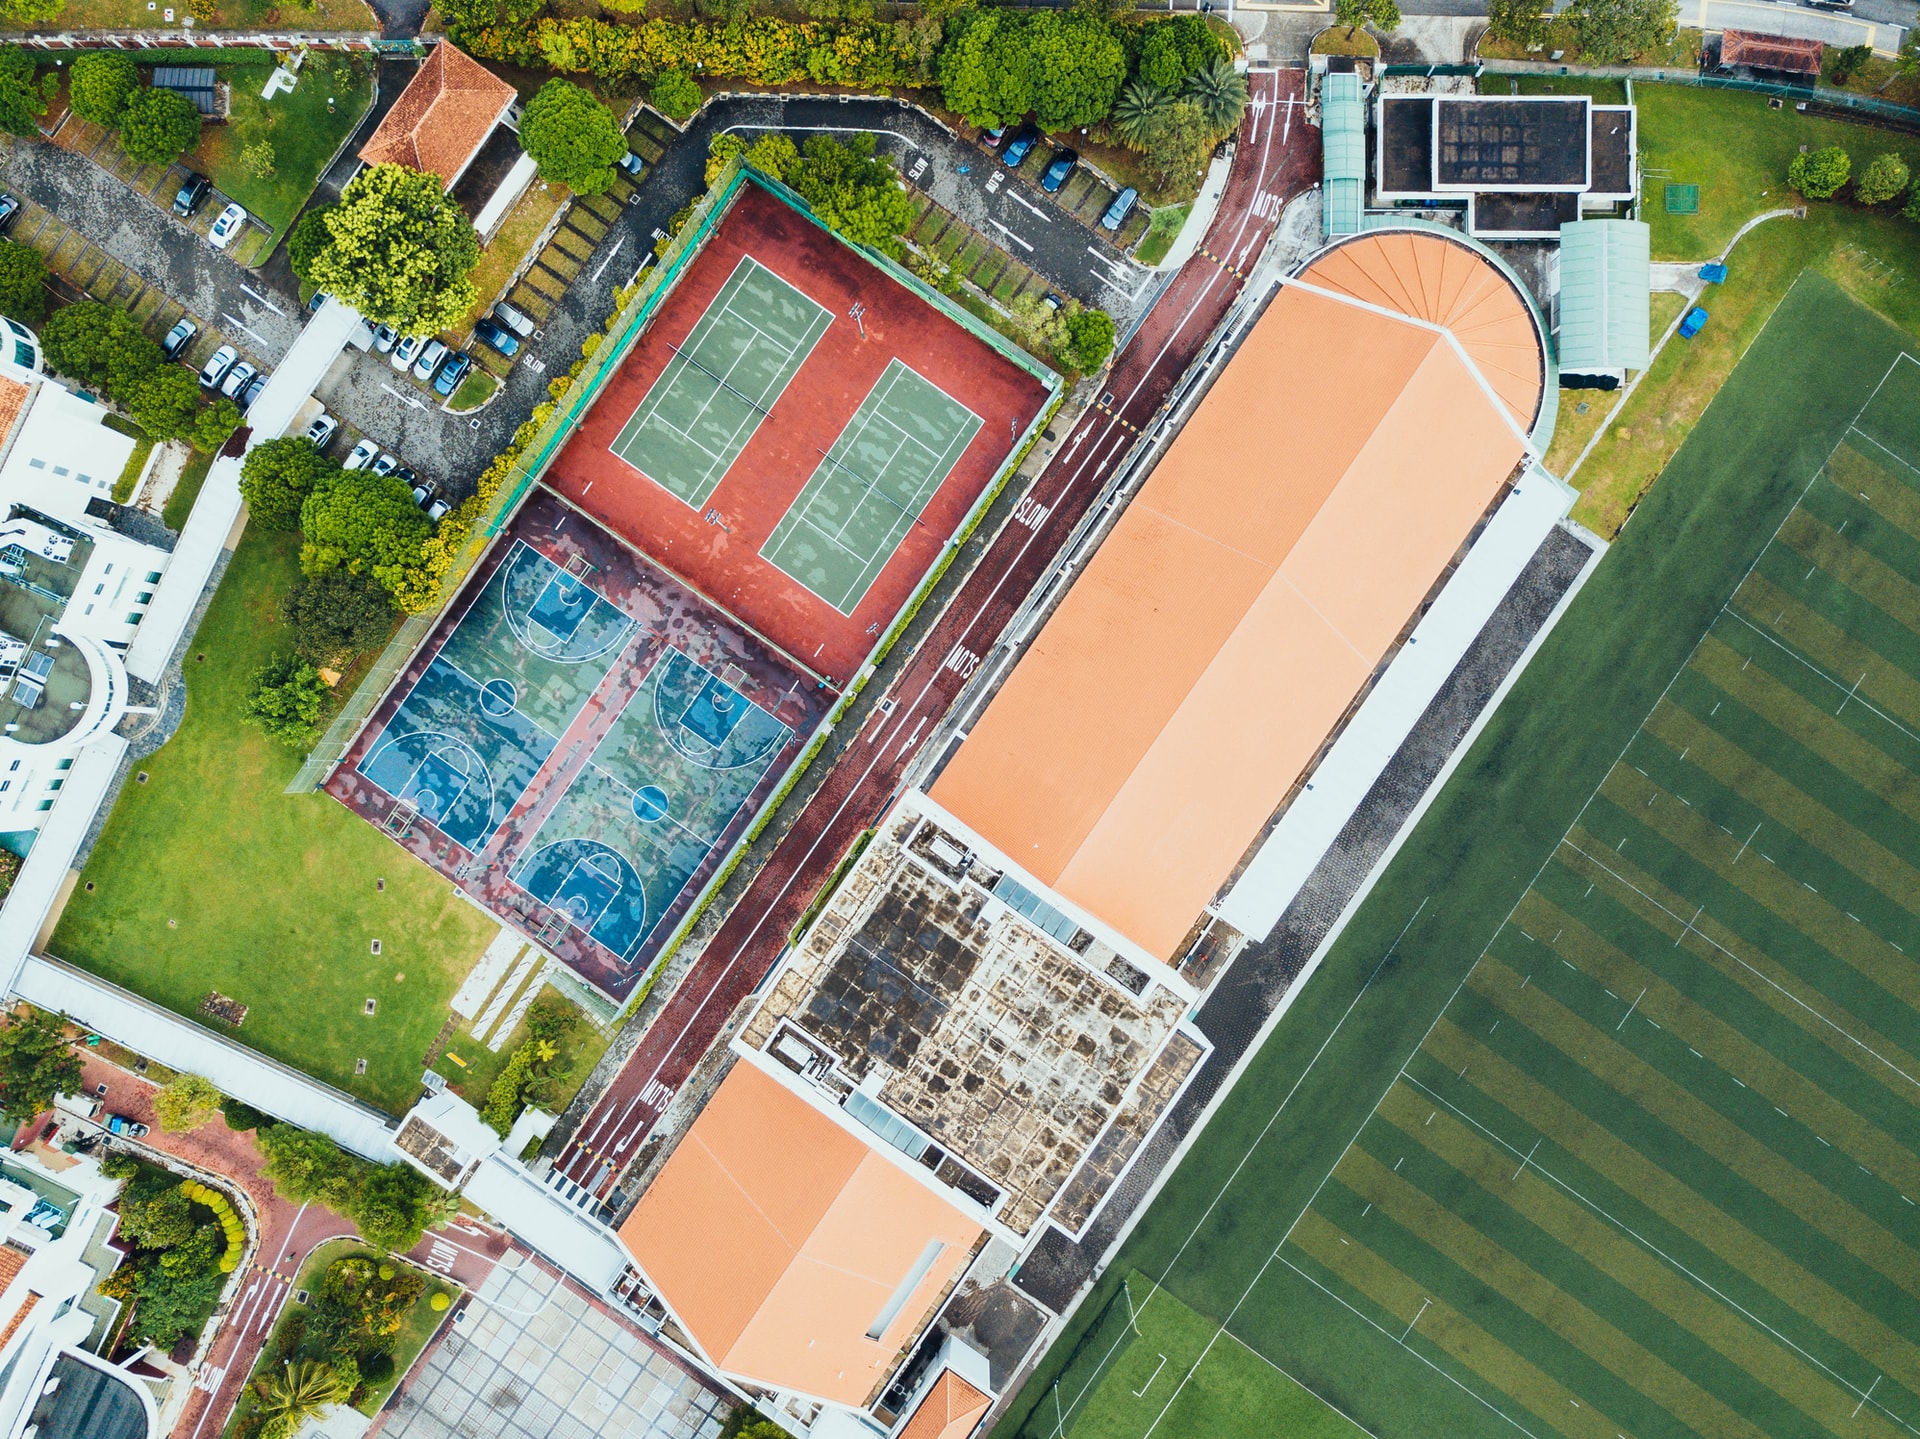
Despite their varied structure, many schools have identifiable overhead signatures that make them possible to detect in high-resolution imagery. Development Seed used deep learning techniques to search for schools from 60cm high-resolution Maxar imagery.
They developed and trained six country models, two regional models, and a global model.
Generally, the regional models outperformed the country-specific models, showing that models trained with more varied data are likely to be more accurate.
The Models
While most of the models used were image classification models, one was an object detection model.
So what’s the difference?
- Image Classification helps us to classify what is contained in an image. In this case, a binary classifier that classified image tiles as ‘school’ or ‘not-school’ was used.
- Object Detection specifies the location of multiple objects in the image. Object detection models take an image as input and generate bounding boxes, predicted classes, and confidence scores for each prediction.
A high-quality training dataset is essential for machine learning models. Therefore, preparing a set of images with verified school locations and another with non-school locations was necessary to train the model.
Model Training
Training dataset generation went through the following steps:
Step #1: Sourcing Data on the Location of Mapped Schools From UNICEF
They supplemented this data with additional schools from OpenStreetMap (OSM).
Step #2: Validation of School Locations, On the Imagery, By Expert Mappers
CHUTTERSNAP on Unsplash
Development Seeds’ experience from the successful school mapping exercise in Colombia informed the selection of identifiable school features from high-resolution satellite imagery.
The mappers compared the school location dataset with high-resolution satellite imagery. Based on identifiable features, they classified each location as either:
- ‘YES’, overhead imagery contains a school
- ‘NO’, overhead imagery doesn’t contain a school
- ‘Unrecognized’, it’s uncertain whether or not overhead imagery contains a school
Some of the school features that they used as criteria are:
- Building with sport fields
- Group of the same type of buildings
- Building with U shape
- Buildings with L shape and empty field
- A large building with an empty field
- Buildings with a big sport field
- Buildings around an empty field
- Buildings with complex shape
Step #3: Generation of Training Data and Analysis
CC BY-NC-SA 3.0
This step varies depending on whether the model is the tile-based school classifier or direct school detection.
Tile-Based School Classifier Model
Two categories of datasets, ‘school’ and ‘not-school’, were generated as the training dataset. Category ‘school’ tiles were downloaded based on the location of schools that were tagged as “YES”.
The “not-school” category was more diverse than the “school” category because it included features such as forest, desert, critical infrastructures, residential buildings and oceans.
Next, the spatial resolution of the satellite image was maximised by zooming into the satellite image tiles to achieve a spatial resolution of 0.6m.
Afterwards, they evaluated whether the training images are a representative sample of the desired deployment region.
Lastly, to assess the model’s performance, the two categories of the training dataset—‘school’, and ‘not-school’ tiles—were split in a 70:20:10 ratio as train, validation, and test datasets respectively.
Direct School Detection Model
The training dataset was created by drawing bounding boxes around school buildings using Computer Vision Annotation Tool (CVAT). They then exported XML files from CVAT and generated training records for model development.
In this project, Development Seed only developed a direct school detection country model for Kenya.
So what’s the catch?
The Challenges
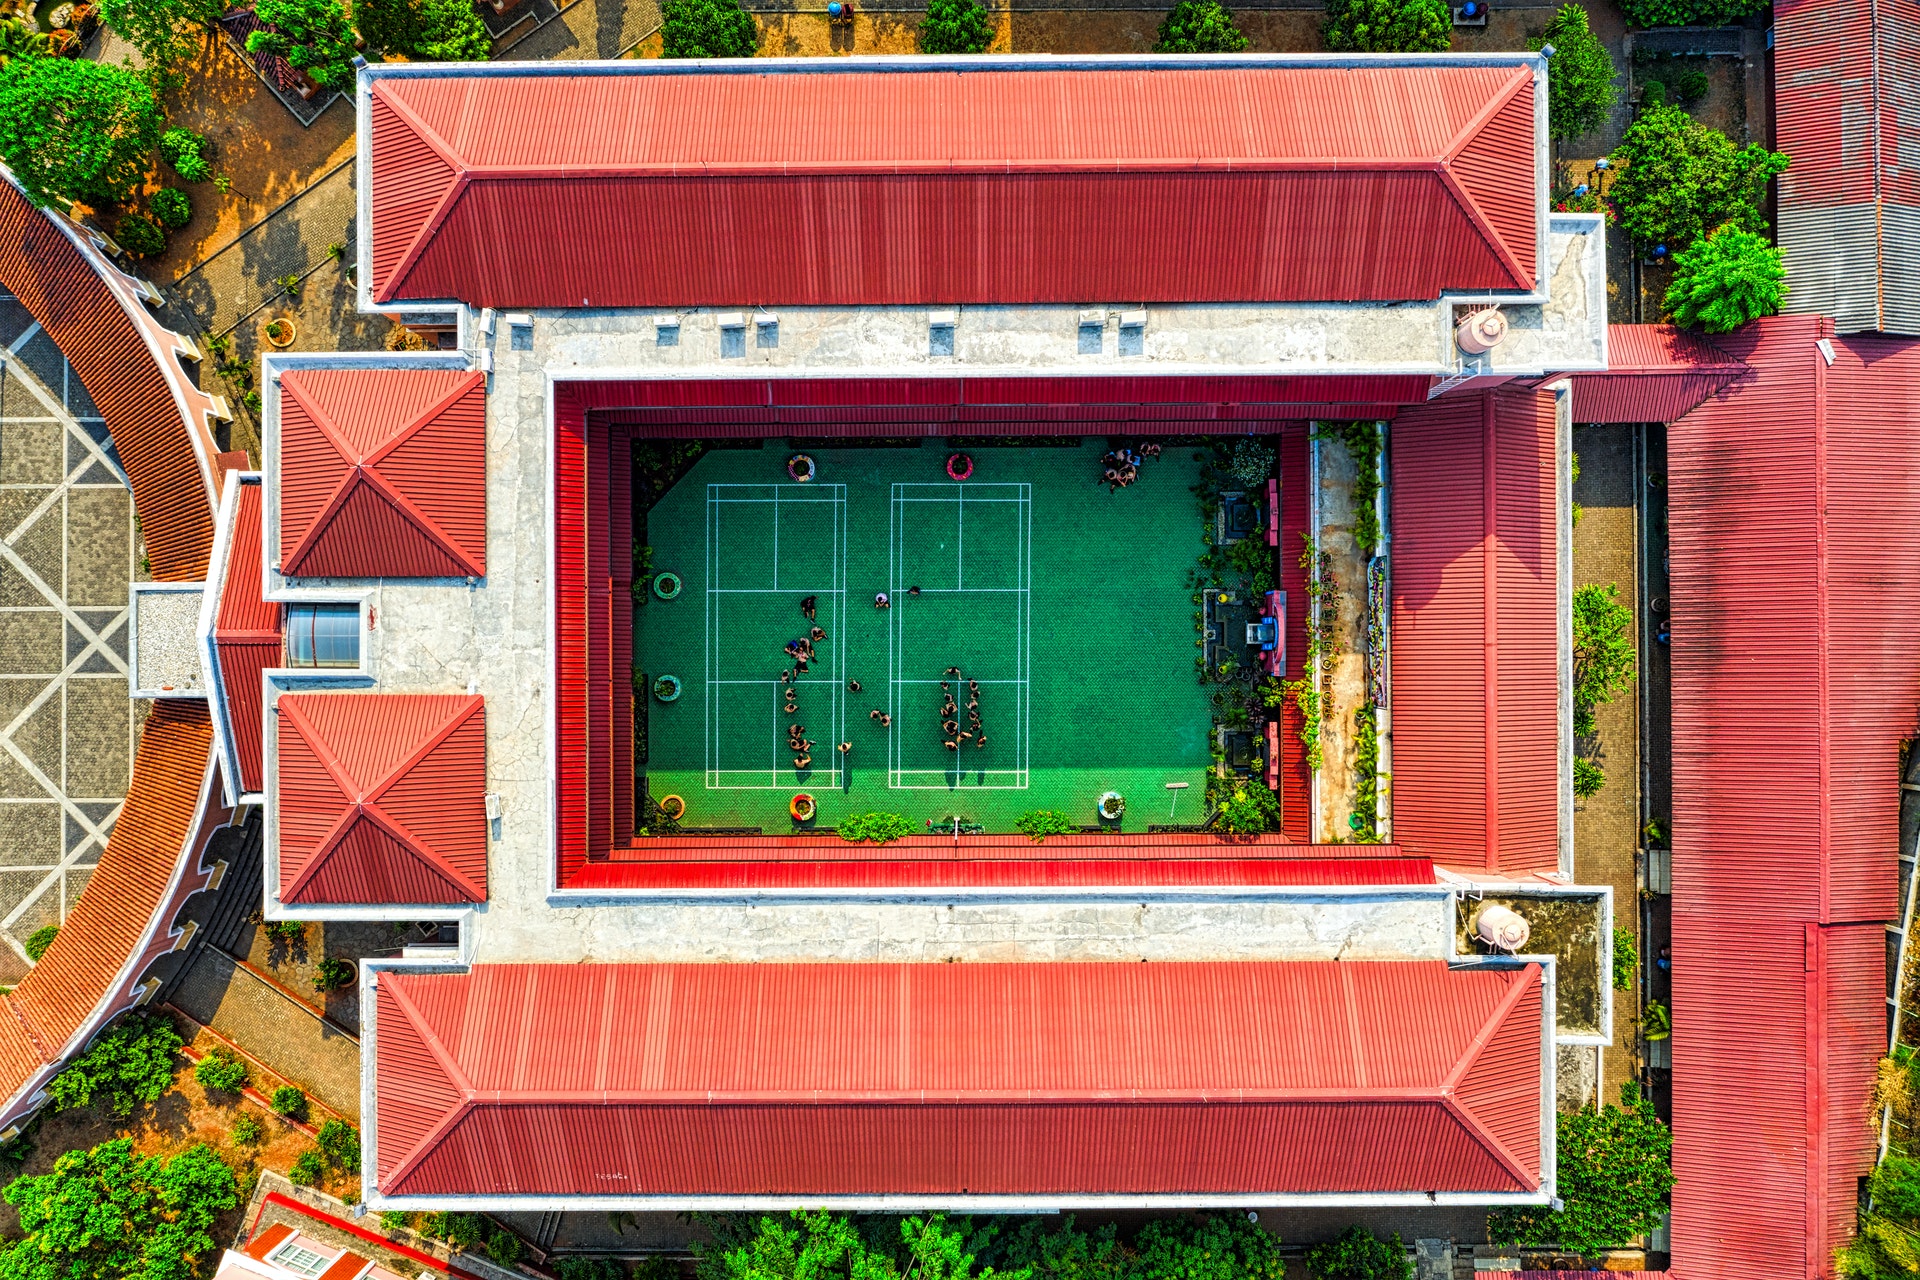
Photo by Tom Fisk from Pexels
In any AI model—as with human beings—bias always exists.
A significant limitation of the approach is that it relies on human input for both training data creation and school validation. As a result, there’s a bias towards schools that follow common patterns and are therefore recognisable from space.
Consequently, while the model can recognise schools by features such as a cluster of buildings with similar rooftops or swimming pools or basketball courts, it may perform poorly at recognising schools with smaller building size, in densely populated urban areas, or housed in “non-traditional” structures.
This bias would not exist in the alternative—and more costly—approaches like field surveys and community mapping.
The Way Forward—Human-AI Integration
Different parts of the world have different school structures. Therefore, to improve the models’ prediction power, it’s necessary to bring in people with local knowledge of the area being mapped. Human-AI integration will ensure that the machine learning model can quickly identify unmapped schools.
Using people to map schools may take forever. However, as evidenced by this project, combining human knowledge in machine learning models can speed up the mapping process.
Note that UNICEF is always looking for more partners to validate—and add—to their existing school mapping datasets. Interested? Contact the School Mapping team.
Which GeoAI applications are you excited about? Let us know in the comments!
References
Development Seed technical report on enabling rapid school mapping from space in Asia, Africa, and South America with AI
Development Seed blog article on using AI to map every school on the planet
UNICEF’s Giga Initiative which endeavours to map every school on the planet
MIT blog article on the use of AI to automatically tag road features from satellite imagery
UNICEF’s Project Connect initiative, whose aim is to map school connectivity globally and eliminate the digital divide
The Atlas of Sustainable Development Goals, 2020
Maxar blog article on Geospatial Big Data platform (GBDX) for sustainability challenge: Mapping every school in the world and reducing the digital divide in education
School Mapping Visualisation: Map showing the data collected so far