
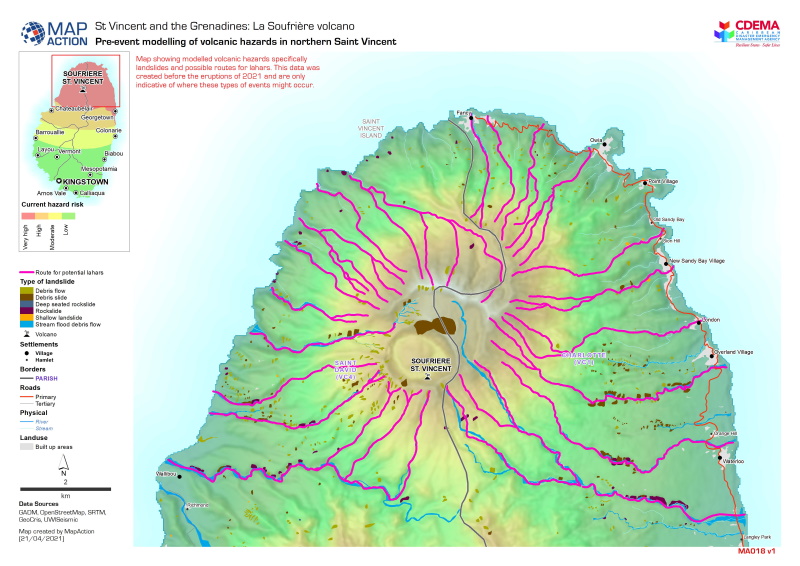
St Vincent and the Grenadines La Soufriere volcano: pre-event modelling of volcanic hazards in northern St Vincent
International humanitarian geospatial charity MapAction has been providing mapping and information management support to the La Soufrière volcano emergency on the Caribbean island of St Vincent, in St Vincent and the Grenadines. We’ve been helping the Caribbean Disaster Emergency Management Agency (CDEMA) and the UN’s Environment Emergency Teams understand the evolving impacts of the crisis.
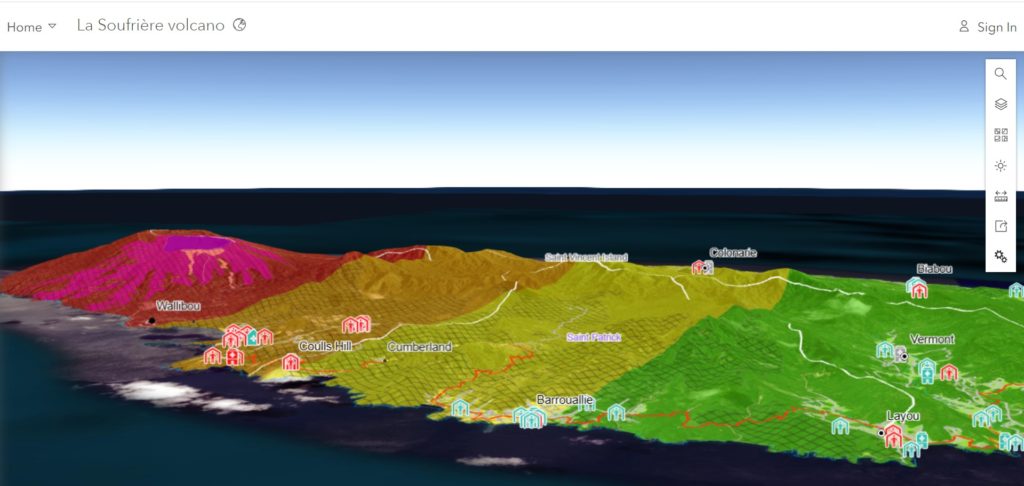
3D web map shows the observed volcanic events from remote imagery
Explosive eruptions from La Soufriere beginning on 9 April caused ash clouds to cover much of St Vincent, Bequia and southern St Lucia, as well large parts of Barbados. The volcanic dome collapsed and pyroclastic flows descended from the mountain top. By 7 April, around 16,000 residents had been advised to evacuate following early signs of activity.
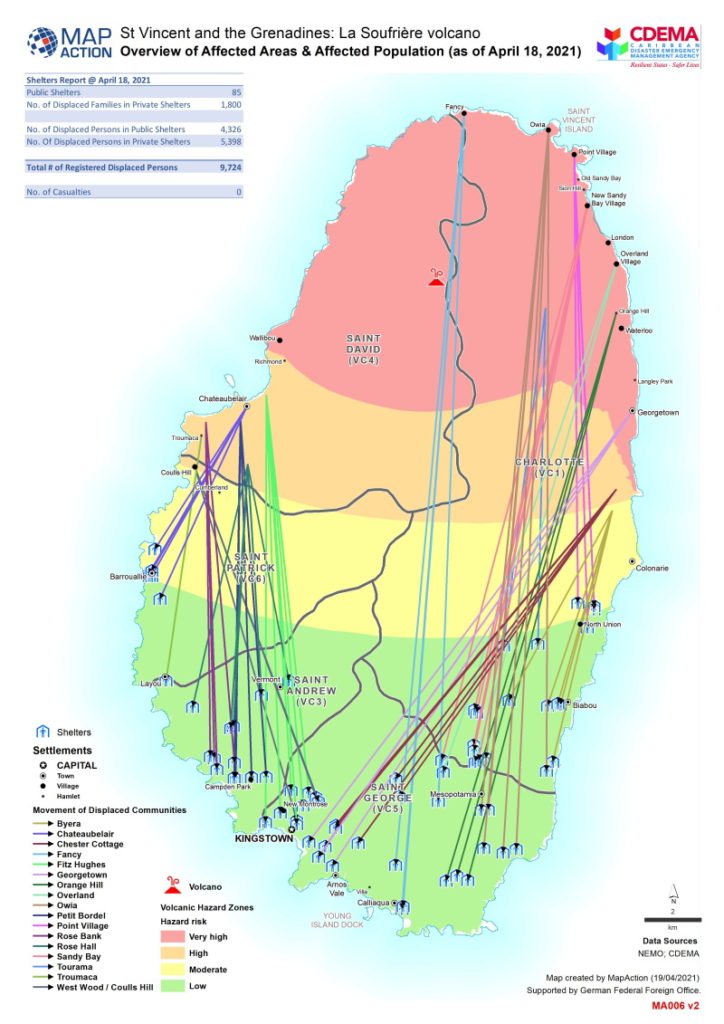
Overview of Affected Areas with volcanic eruption & Affected Population (as of 18 Apr 2021)
Monitoring of the volcanic eruption has been difficult as existing seismic stations were knocked out and it became dangerous to travel into the area. Recent rains have washed the ash into rivers and the surrounding sea, causing environmental damage. Mudflows (lahars) pose a dangerous threat to river valleys surrounding the volcano.
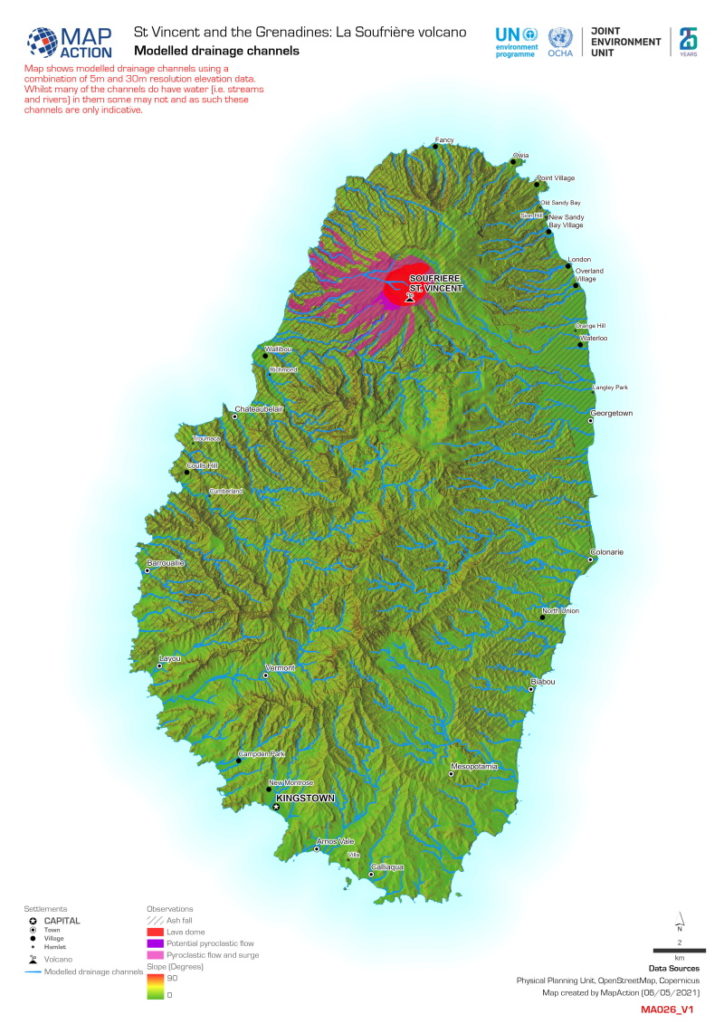
St Vincent and the Grenadines La Soufriere volcano: modelled drainage channels
 View all the volcano mapping relating to this emergency here or read the blog by MapAction volunteer Lavern Ryan about her experience of being a part of the response team.
Did you like the article? Read more and subscribe to our monthly newsletter!


#


Next article


So nowadays I think everyone has heard about the possibility to look at stuff near real time via satellite imagery. But does this really add value to my work? Is this in my company’s budget? See this short example as your first entry into the world of remote sensing.
The comparison includes screenshots from imagery taken mid April of the harbor of Cape Town. The software used is the Sentinel Hub EO-Browser. The EO-Browser of Sentinel Hub is a really useful piece of software funded by the European Union. In the browser-based application you can search, visualize and download satellite imagery with a focus on data from the EU Sentinel Missions.
The highest resolution of free data you will get with Sentinel 2 products (10m). For the harbor at Cape Town the result looks like this:
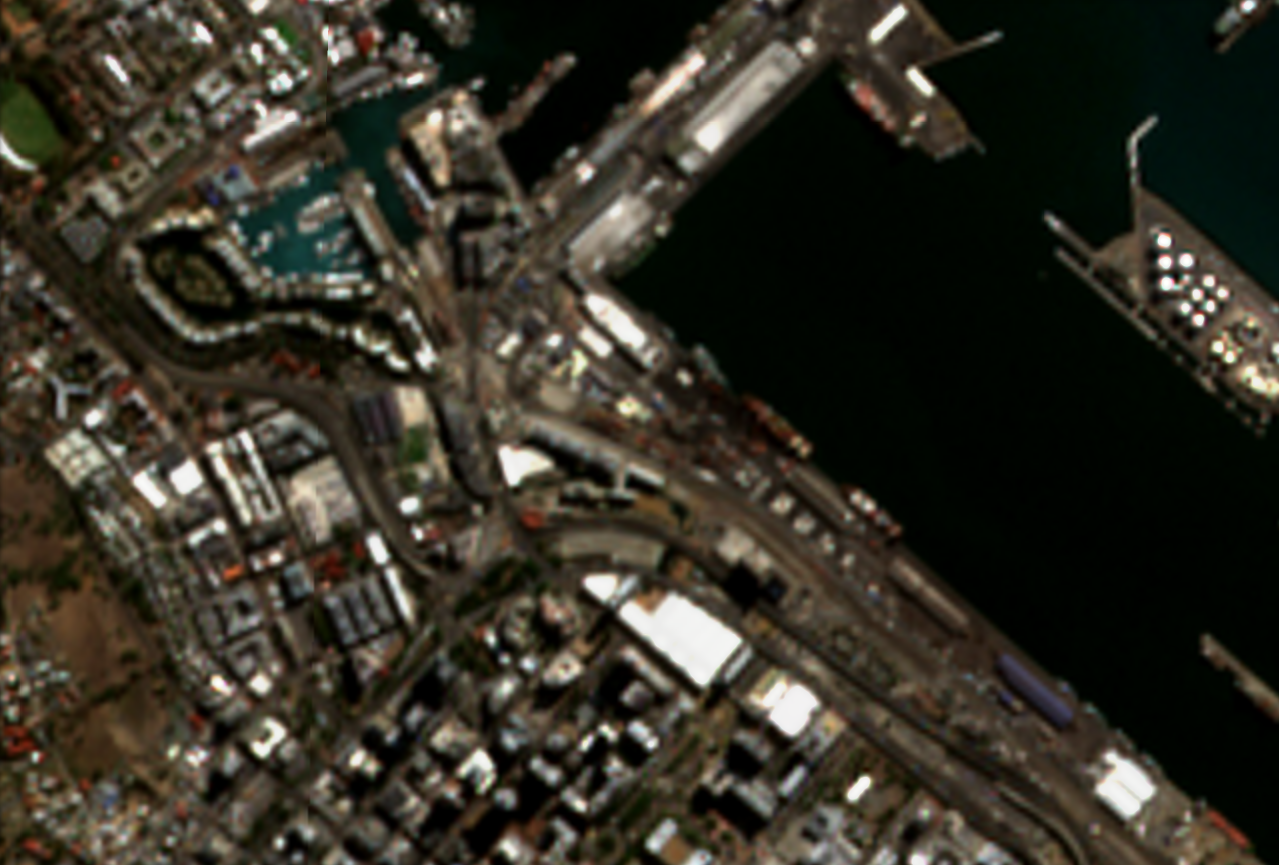
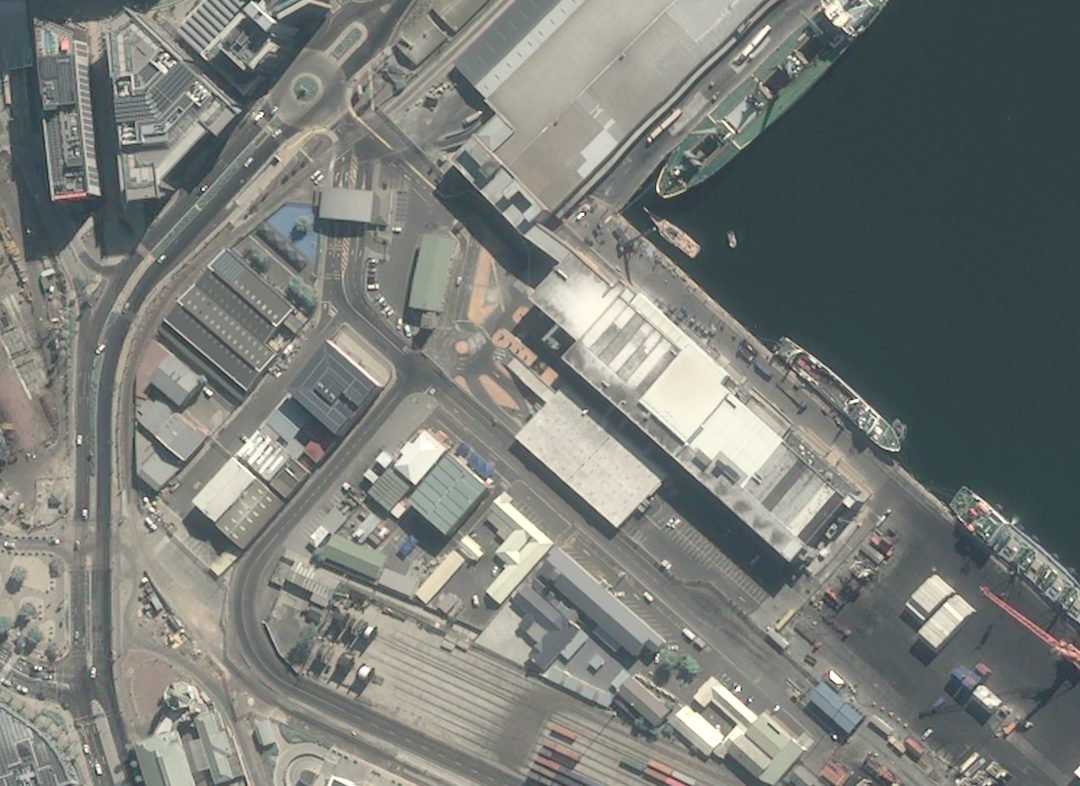
The image gives a good overview, but you cannot detect any details on e. g. a single building. If you thus manage a small construction site, this might not be enough. But this is the most you will get out of near real time remote sensing if you do not want to spend any money. However, if you have a budget you can subscribe to a service that includes imagery from other satellites. Popular is the Pleiades satellite with a resolution of 0.5m. In Cape Town an image from Pleiades looks like this:
If this is interesting for you, the next question is: What is the pricing of such construction monitoring? That depends on how much data you will need / how big your construction site is. Sentinel Hub offers a subscription package which includes Pleiades imagery at 999€ per year and you can also check it out with a free trial.
Did you like the article about construction monitoring? Read more and subscribe to our monthly newsletter!