
Venice’s subsidence was recognised already some decades ago, when the pumping of ground water from beneath the city combined with the compaction from centuries of building caused the city to settle. In succession, the extraction of groundwater was officially stopped banning further dropping of Venice as found in a study from the 2000s conducted by Yehuda Bock, a research geodesist with Scripps Institution of Oceanography at the University of California, San Diego.
However, the subsidence is on the tip of everyone’s tongue today primarily due to the increased number of inundations that nowadays afflict Venice each year. In 2013, a new study from the University of Miami aspired to reveal most recent deformation trends and used data between 2000 and 2010. The analysis combines GPS and InSAR methods and clearly captures the displacements over the last decade that neither GPS nor InSAR could do alone. Interferometric Synthetic Aperture Radar (InSAR) is able to gauge the changes of travel paths as a function of the satellite position and the time of acquisition. InSAR measures the backscattered phase signal over time, from emission to re-entering. If a point on the surface shifts, the distance of the same location to the sensor changes and so does the phase value. Phase differences taken from two scenes of the same area allow the detection of minimal land deformations as satellites are moving on a fixed orbit. InSAR is beneficial in showing changes on the earth’s surface around volcanoes and earthquake fault lines or above mining galleries. InSAR indicates the amount of transformation but not its direction and delivers elevation calculations relative to other points. GPS enables to take absolute measurements and in the portrayed study even showed that Venice and the surrounding lagoon is tilting, an information that the satellite images could not provide.
In total numbers, the city of Venice was found to subside on average 1 – 2mm per year. The whole lagoon including the 117 islands is moving, the northern parts with a rate of 2-3mm per year a bit less than the southern parts that are dropping 3 – 4 mm per year. Indeed, Venice was found to sink still today!
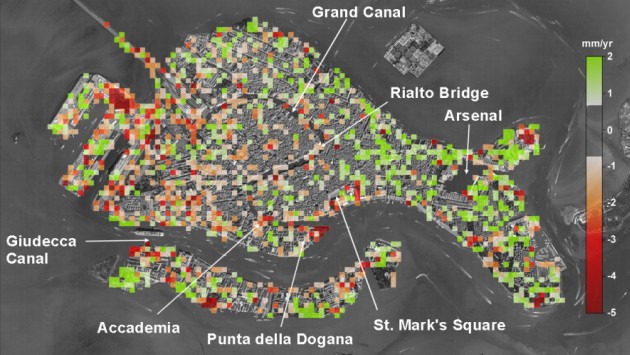
Venice’s displacement rate (mm/yr), as detected by satellites from March 2008 and January 2009.
Image: Tosi and colleagues. Source: Spatialsource

InSAR data proves stability of Venice. Land subsidence rate of Venice between 1992 and 1996 in mm/year. (ERS Data Copyright ESA 1998, Processing by GAMMA)
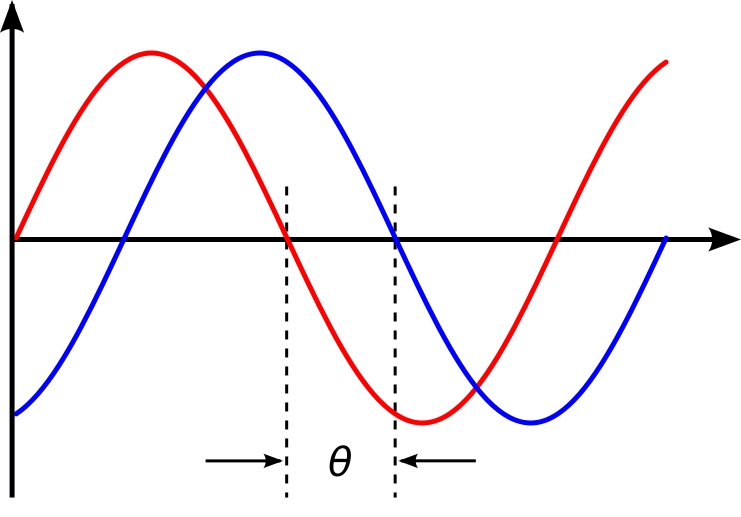
Phase difference of a radar signal due to a different distance fromthe sensor to the reflecting object. Source: Wikipedia
Why is that?
The reasons are of natural origin. Scientists mention the plate tectonic as a possible cause for the movements as the Adriatic plate that Venice stands on dips underneath the Apennine Mountains. Also, the compaction of sediments due to building still remains a factor.
Home-made flooding
Pietro Teatini from University of Paduva argues that the subsidence today is delicately less compared to times when ground water pumping was still practiced. Nevertheless, inundations in Venice are occurring more frequently today than before. Sea level rise is an indirect human influence causing those ‘wet’ periods in Venice. There is also a home made reason for the enhanced number of inundation produced by the digging of deep water channels into the lagoon for shipping. Originally, a system of oblong islands formed an almost continuous belt around the lagoon and protected the inner parts from floods that, spurred by heavy winter storms, steered towards the north Adriatic coast. Flooding also occurred in past epochs, but as the narrow access points into the lagoon obstructed the water from quickly entering, they happened less frequent. The natural obstacles were removed at least at three points allowing as a result big ships but also floods to enter the lagoon rapidly.

Site overview of Venice and the lagoon: the outer islands are artificially interrupted at three locations (until down to hte city of Chioggia). Source: bsn
In total, in the 20th century Venice subsided about 120 mm due to natural processes and groundwater extraction, in addition to a sea level rise of about 110 mm at the same time. Scientists calculated that the city and surrounding land could sink by about 80 mm relative to the sea in the next 20 years if the current rate holds steady.
Source: Spatialsource

#

Next article
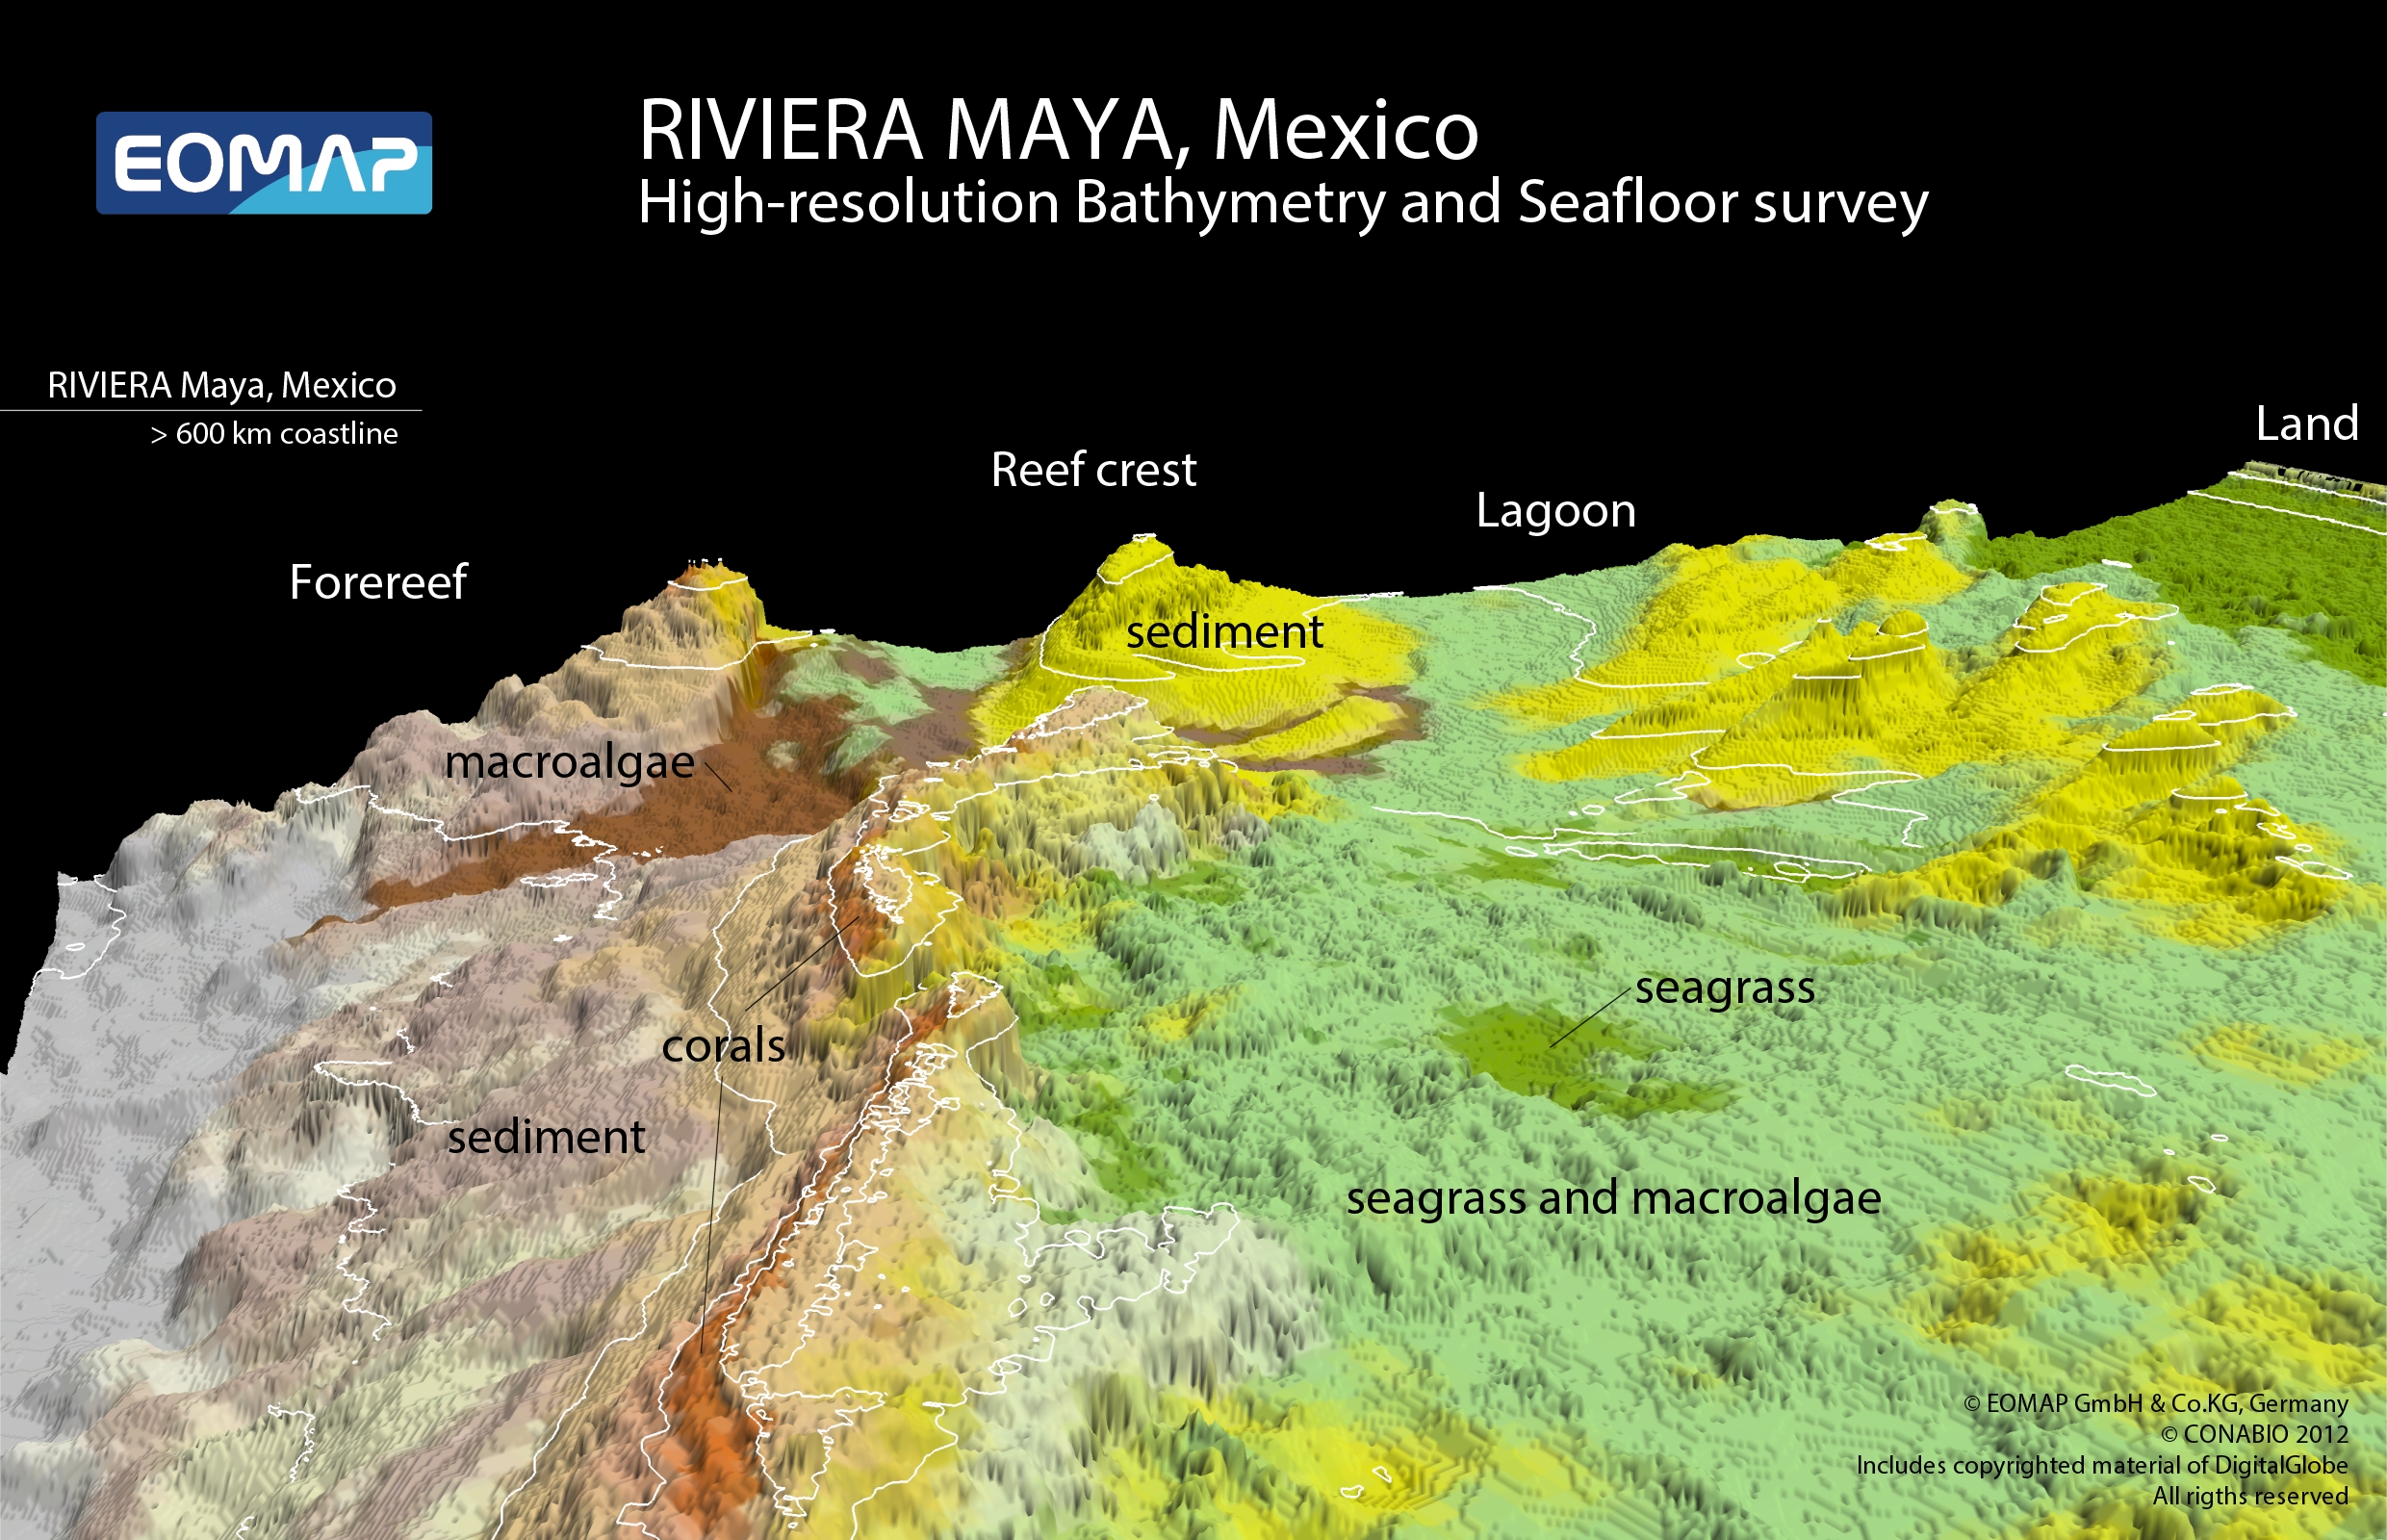
Coral reefs belong to one of the most anthropogenic impacted ecosystems that have been terribly suffering damage while offering great wealth of habitats, diversity of species and limitless environmental services. Examples of the destructive forces can be oil spill from petroleum platforms, considerable changes in ocean temperature and an increase in the incidence and the intensity of hurricanes as an effect of climate change causing bleaching an finally a decrease of coral colonies. The current threats and at the same time the worldwide importance of coral reefs have generated methods to develop this kind of ecosystem on a large scale, whereas remote sensing means have become important to map underwater habitats specifically with regard to the remote location of coral reefs, their vast extension and then shallow waters making navigation dangerous.
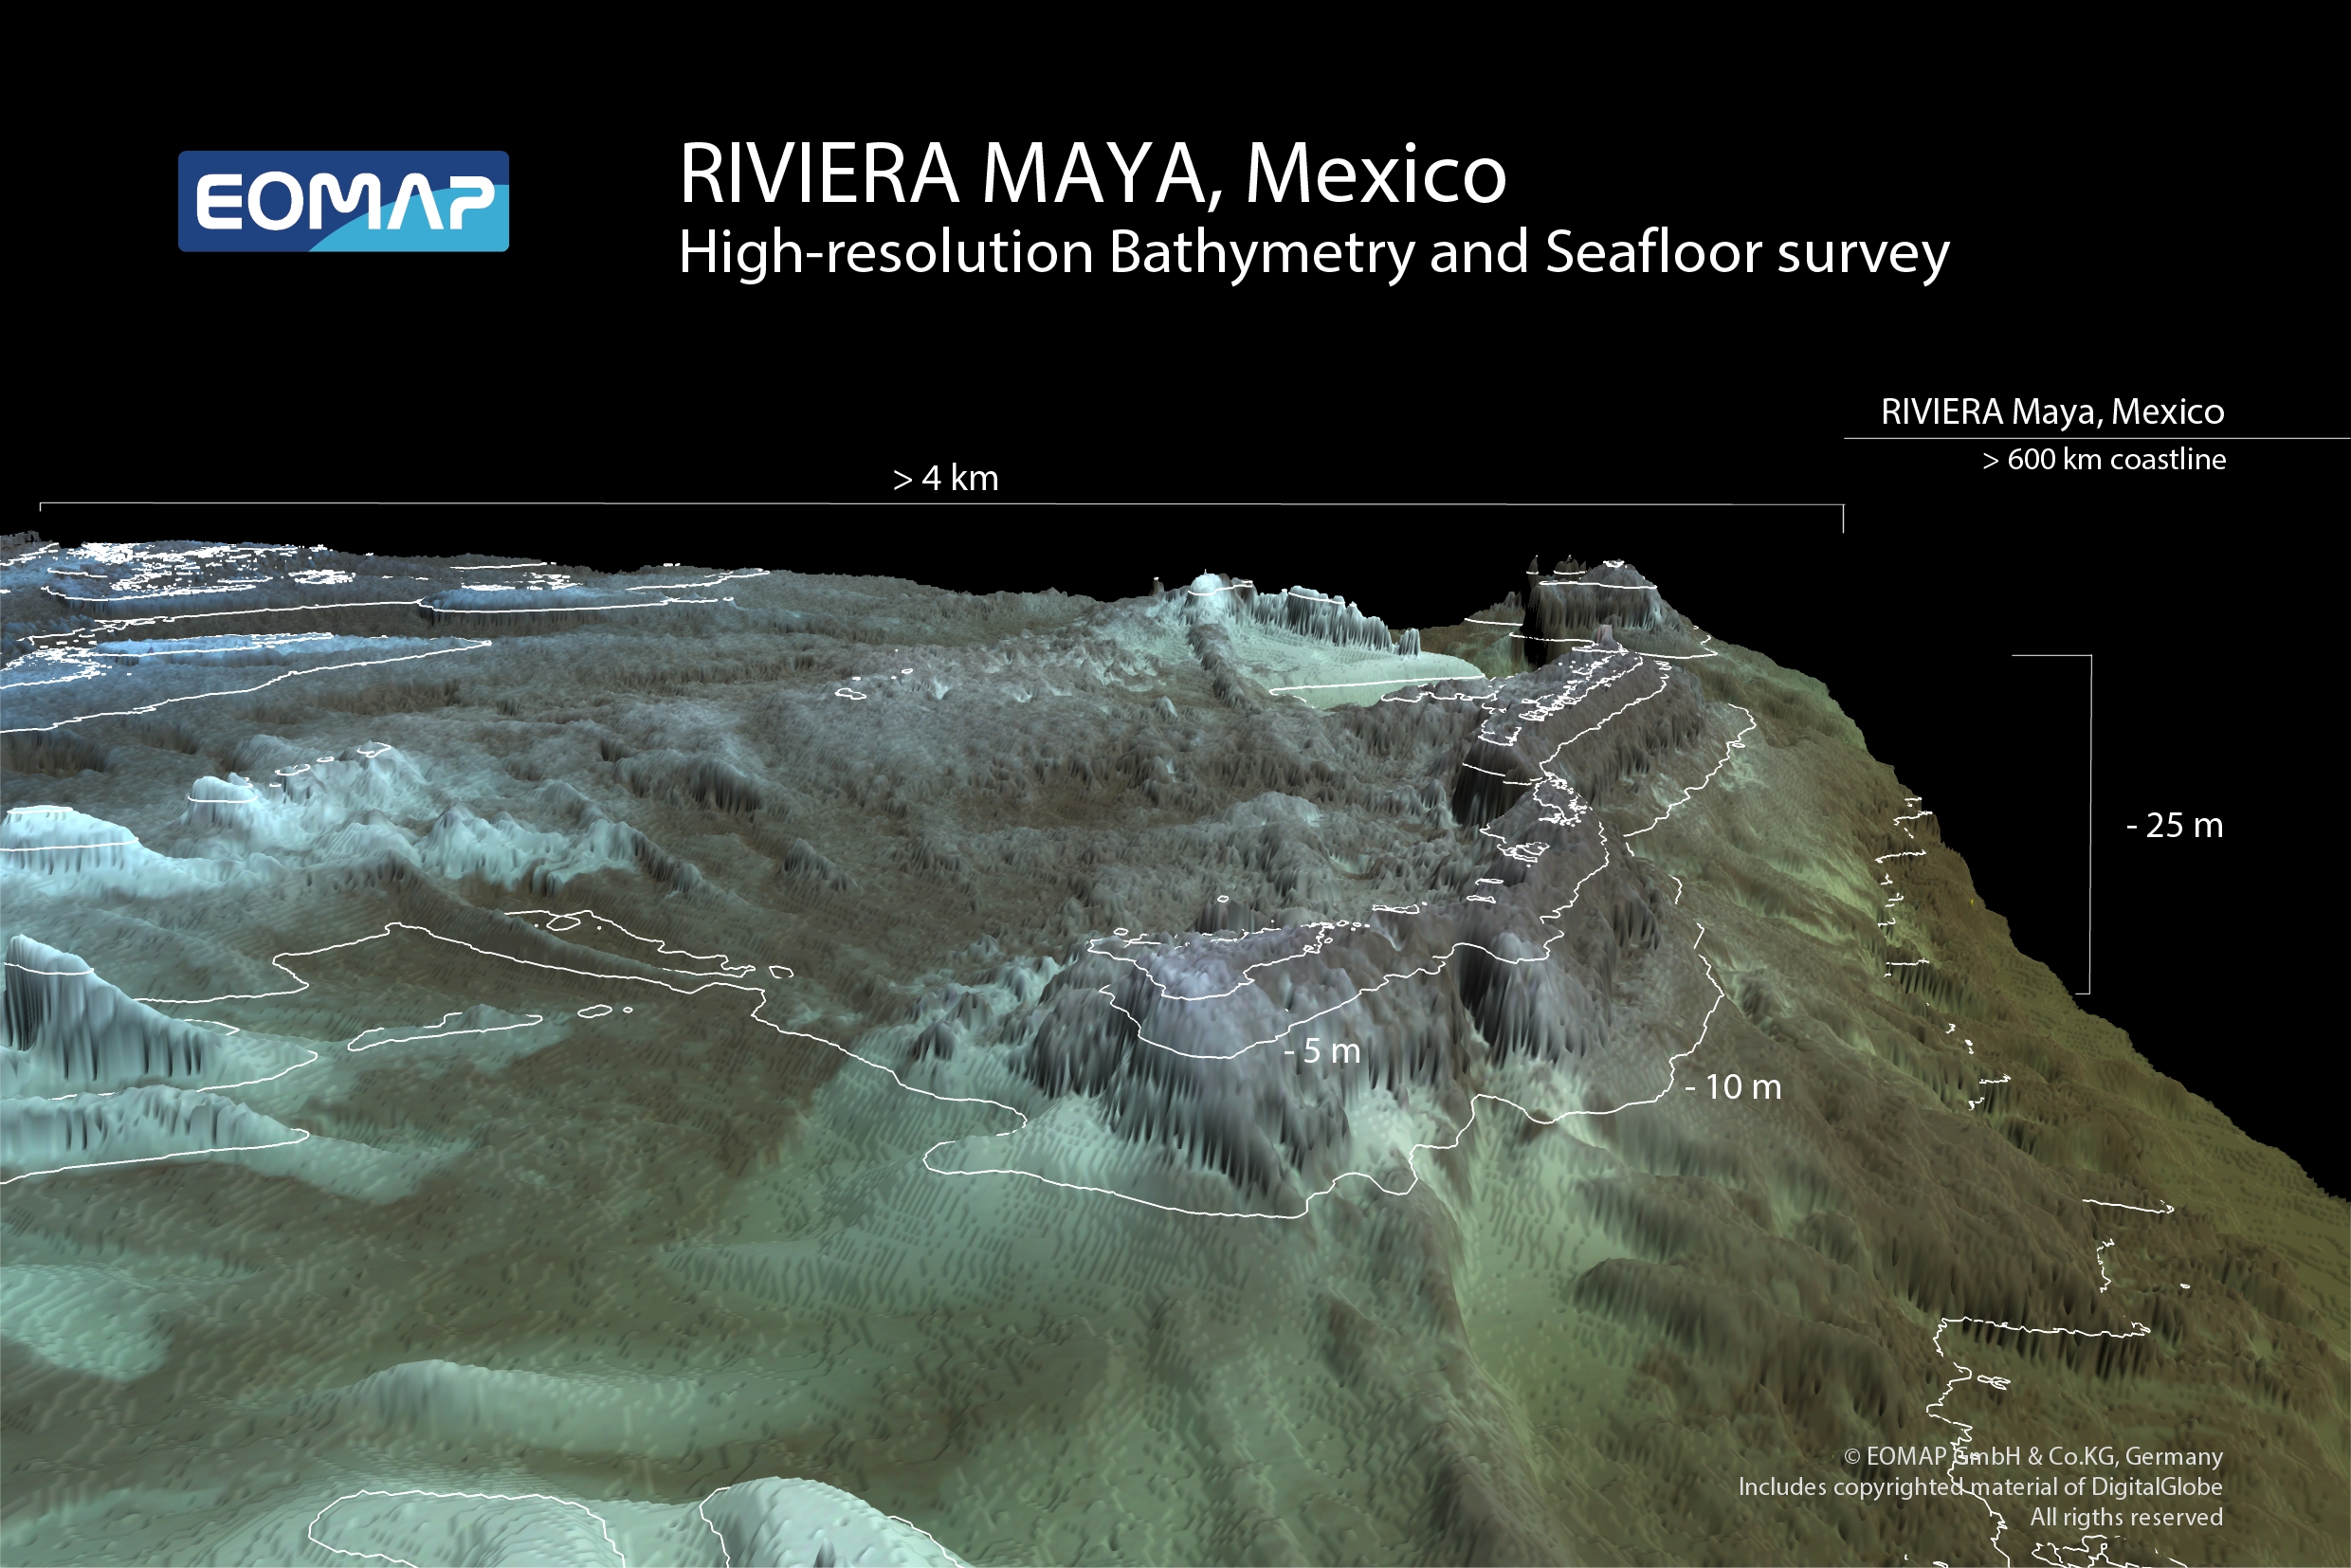
In an article in December I reported on the first bathymetry of the entire Great Barrier Reef, which was accomplished by the German-based company EOMAP. Right at the beginning of the new year they announced another achievement, which is the first high resolution seafloor and bathymetry survey of the Mexican Riviera Maya including a benthic map and environmental baseline study. I obtained a communiqué including facts and some background information about the interesting initiative along the Mexican coast. Therefore, let’s jump into those tropic waters!
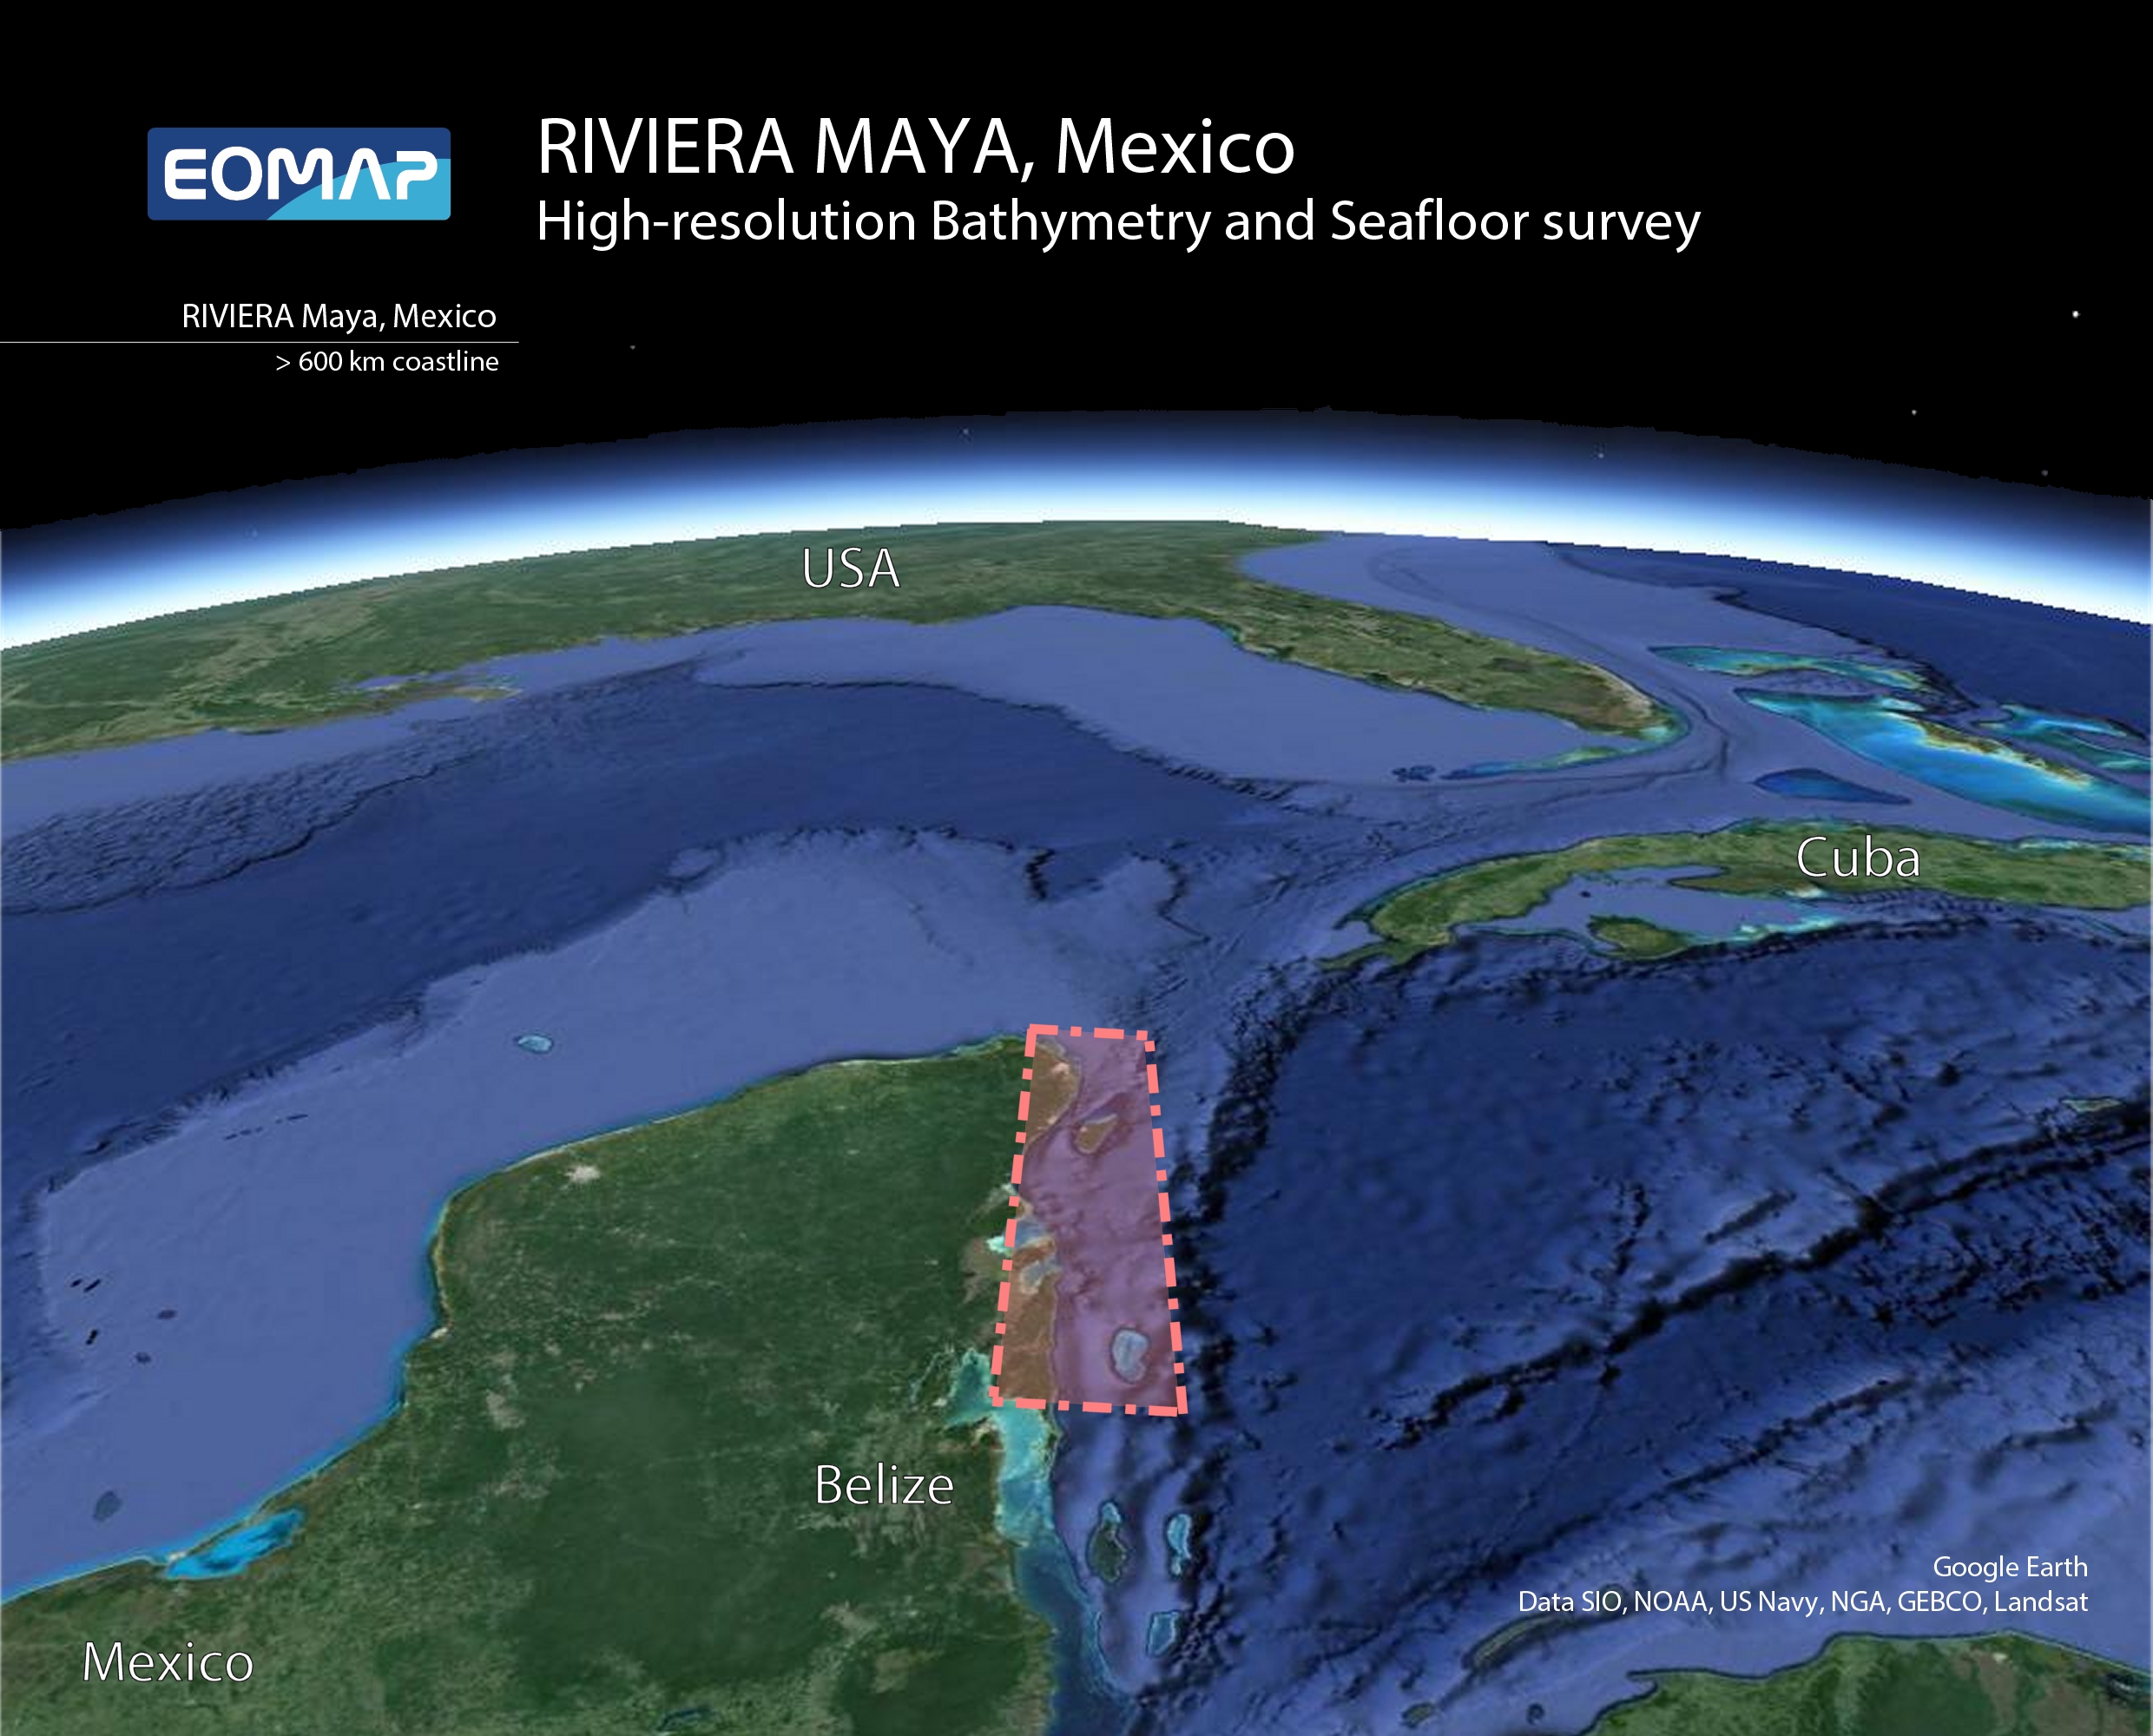
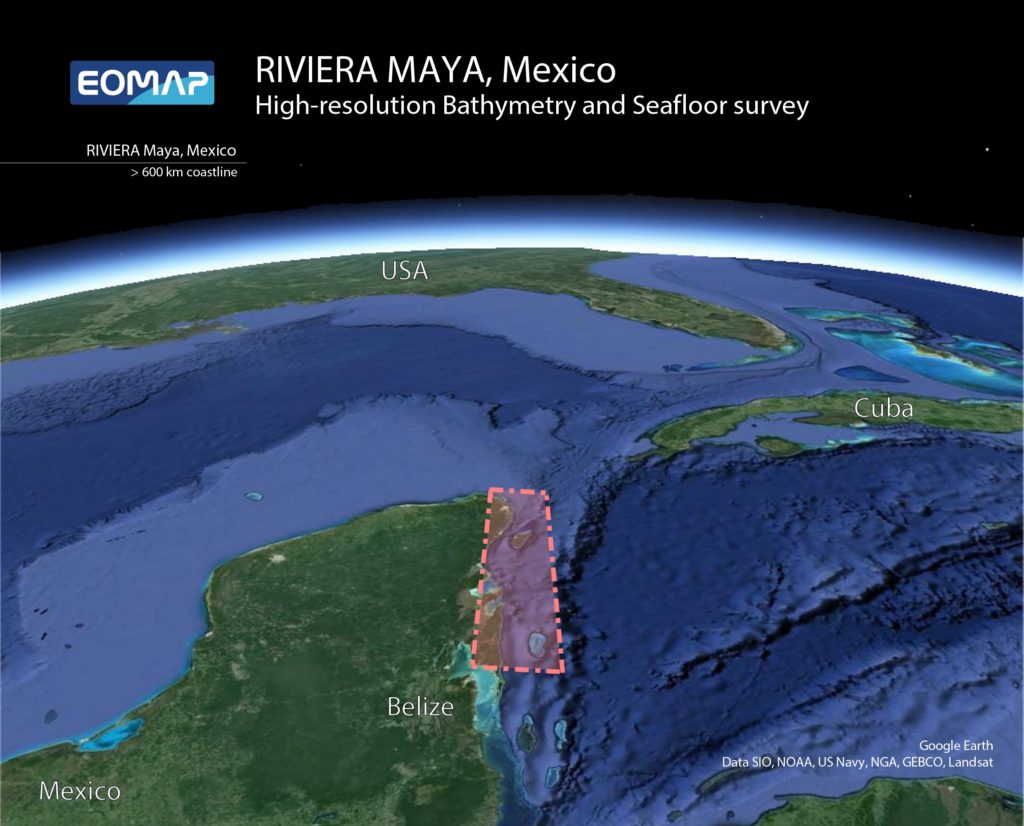
Surveyed stripe along the coast of the Yucatan Peninsula, Mexico.
THE FIRST HIGH RESOLUTION SEAFLOOR AND BATHYMETRY SURVEY ON THE MEXICAN RIVIERA MAYA
EOMAP, a value-added service provider of satellite data was contracted by the Mexican National Commission for Knowledge and Use of Biodiversity (CONABIO) to deliver high resolution environmental information for the entire Maya coast. This coastline extends 600 km south from the Yucatan Peninsula to the border of Belize. In total more than 5000 sq km of the marine environment, including ecosystems such as corals, seagrass and mangroves, were mapped in water depths down to 25 m.
“The fine-scale spatial information, derived for the entire coastline, will serve as the first baseline dataset of the Maya coast, and will help to understand and preserve the vulnerable ecosystems.” Said Dr. Thomas Heege, CEO of EOMAP GmbH & Co.
CONABIO is a permanent interdepartmental commission promoting, coordinating and carrying out activities aimed to increase awareness of biodiversity and its conservation and sustainable use. To fulfill its mission CONABIO relies on accurate and fine scale baseline maps for land and sea. For Mexico’s extended coastlines, traditional surveys were by far too time consuming and expensive and CONABIO therefore decided to use a satellite-based approach. In early 2012, EOMAP’s technology was applied for bathymetry and seafloor mapping, using the highest spatial multi-spectral resolution satellite data available (DigitalGlobe’s WorldView-2 eight-band sensor).
“EOMAP was selected because we have seen their satellite-derived, high resolution seafloor and bathymetry products in very successful, previous projects. The services and products delivered for the Mexican Maya coast are exceptional and will be fundamental in developing our seafloor habitat baseline. Such a baseline is critical in assessing short and long term impacts to the environment from both man-made and natural causes.” Said Dr. Rainer Ressl, Director Geomatics Department of CONABIO.
The project was completed in three phases: satellite data was first ordered and checked for its mapping feasibility, then EOMAP delivered spatial datasets of bathymetry and seafloor properties, and finally the validated habitat classification was performed.
“Mapping the seafloor habitats and bathymetric information for such extended areas is of growing interest for both environmental as well as engineering applications. Our algorithms are operational and standardized, enabling us to survey, map and monitor extended or inaccessible areas at a fraction of the cost of traditional survey methods,” said Dr. Magnus Wettle, Chief Scientist of EOMAP Asia Pacific.
EOMAP GmbH & Co. KG has been delivering satellite-derived bathymetry and seafloor habitat services worldwide for a growing number of customers in the oil and gas, engineering, environmental and hydrographic sectors.
For more information on EOMAP, see www.eomap.com or email info@eomap.com.