
Editor’s note: This article was written as part of EO Hub – a journalistic collaboration between UP42 and Geoawesomeness. Created for policymakers, decision-makers, geospatial experts and enthusiasts alike, EO Hub is a key resource for anyone trying to understand how Earth observation is transforming our world. Read more about EO Hub here.
Ever since the Explorer 6 satellite captured the first image of Earth in 1959, organizations have been finding ways to exploit and add value to Earth Observation (EO) data. Although still described as ‘emerging’, the sector has seen significant growth in recent years, and is now a booming market, with EO data being used to monitor land, sea and atmospheric factors; and finding numerous applications, from agriculture and the environment to logistics and security.
Explorer 6 — photo from NASA
The market is expected to grow even more rapidly over the coming decades, in part due to recent technological breakthroughs regarding data collection and storage, as well as new business models, including online data marketplaces and cloud infrastructure to process data. However, the single most important factor has been unlocking the bottleneck right at the beginning of the EO ‘value chain’: the initial cost of launching a satellite into space.
Understanding the EO value chain is critical in providing context, from explaining how the industry got to where it is today to predict where it is headed next.
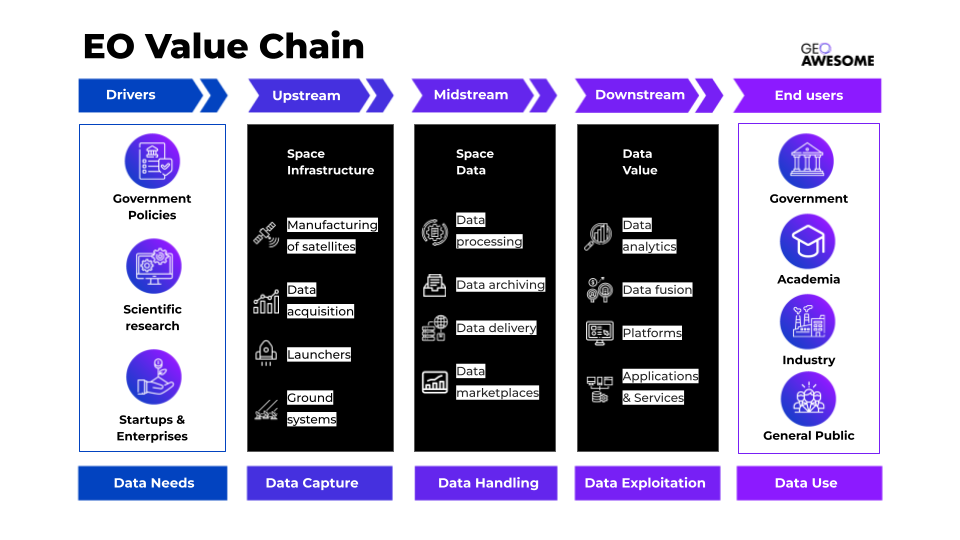
Defining the Earth Observation value chain
When it comes to the EO industry itself, the core value chain can be divided into three main segments: upstream, midstream and downstream.
The upstream component encompasses data capture. In practice, it refers to the manufacturing and operation of satellites, also covering the launch and ground systems and any other relevant space infrastructure.
The EO midstream is all about data handling. This effectively means how data is received by the ground infrastructure, then how it is stored, pre-processed, catalogued and archived. Midstream also involves data distribution and delivery through EO marketplaces like UP42, among others.
Downstream is where data is exploited—or, in other words, has value added to it, by being processed and converted into products, applications and services. This involves big data and analytics, and will often mean integration with other sources of data.
To paint the full picture, we should also include initial drivers and end users. The market is driven by scientific analysis and R&D, as well as government policies and the mandates of individual agencies and departments. End users at the end of the chain are critical elements, as they are generating the demand for the sector to grow in the first place. In recent years, we are seeing an interesting shift. It is no longer the reserve of the military and science; we are now seeing governments, academia, industry and even the general public as customers for EO products.
The evolution of the Earth Observation value chain
We are currently witnessing a rapid evolution of the EO value chain, with three main drivers: broad technological development, an increasing need to monetize that technology beyond its traditional applications in the military and government, and the entrance of new players into the market.
As a result, there are currently multiple examples of both horizontal and vertical integration occurring in the EO market. Understanding where and why this is happening plays a major role in analyzing how the EO sector operates and where its future lies.
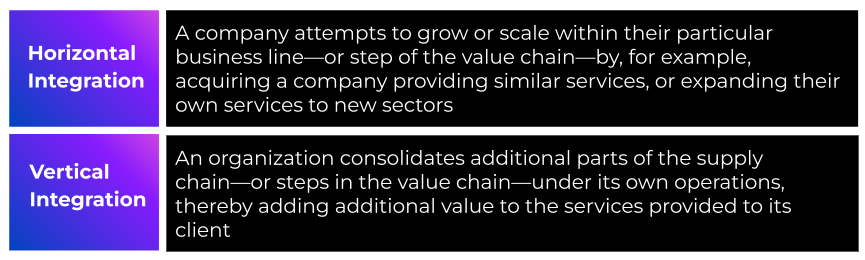
Downstream, there has been an explosion in the number of independent startups who are providing niche data analytics services; partnering with large satellite operators or marketplaces to access their enormous archives and then processing the data for clients. Many of these, like LiveEO, Orbital Insights, and Satelligence, are integrating horizontally as they expand their offering to new sectors. Orbital, for instance, now focuses on retail, finance, insurance and defense
Upstream, on the other hand, many satellite manufacturers are in the process of vertical integration. In theory, the aim is to simplify the way that clients purchase, extract, and leverage their data, but from a business point of view it’s about capturing a higher share of value. Planet, for example, is expanding its data processing and analytics capacities with the hope of adding both value and differentiation to its offering, by providing basic tools including change detection, object classification, and more. Another example is Maxar. Back in 2016 the satellite data giant acquired geospatial analytics company Radiant Group, with the aim of strengthening their presence in the intelligence field, especially in the US.
Some large incumbents are integrating both vertically and horizontally. For example, since the early 2000s, Airbus has been investing in the development of the Farmstar platform to capture the agricultural market. In doing this, Airbus is expanding their offering across the value chain right the way to the downstream, by creating software which enables end clients to easily access and analyze the data from their Pleaides and SPOT constellations. At the same time the company has been involved in multiple SAR and optical satellite projects.
Vertical integration is currently the topic of much discussion within the industry. It certainly has advantages, creating customer loyalty and providing the end client with easy access to data. It can also be cost-effective:
However, for the industry more broadly, there are also downsides to vertical integration. There is an argument that satellite manufacturers, for example, should focus on their core business offering of data capture and allow other companies to create solutions which add value. If a satellite operator provides additional services, it is able to offer the data itself at a discounted price, whereas a startup has less flexibility, as it needs to buy the data and then offer analytics on top.
By incorporating data analytics, satellite manufacturers tend to close down opportunities, blocking the market for new entrants and, in a way, cannibalizing their own market. Additionally, from a customer point of view, buying data directly from the satellite operator is likely to restrict clients to a given ecosystem of data and solutions rather than giving them the flexibility of choice.
The importance of the midstream
The midstream has the potential to provide balance to the EO value chain: Marketplaces and data handling solutions provide a service to the upstream value chain players (the satellite operators) by expanding the market for their data, whilst also serving the downstream value chain by making the data more affordable, accessible and practical, so downstream companies can build their own solutions for clients.
Open access programs—like the EU’s Copernicus and NASA’s Landsat—have made EO data freely available to both end users and downstream operators. However, the data from these programs is only of low–medium resolution, and it, therefore, has limited applications. EO data marketplaces like UP42, on the other hand, provide access to high-resolution data, as well as the infrastructure and capacity to process and analyze it.
Marketplaces such as UP42 integrate multiple data providers, including Airbus, Capella Space, and more. This ensures that clients are not limited to a single vendor but are able to take advantage of whichever provider best suits their requirements—adding huge value when it comes to analysis of the data. UP42 is also integrated with Esri, and other significant geospatial software providers; this increase in advanced analytical service integrations will also provide huge value to end users.
This data democratization enables companies across the value chain to expand horizontally; it allows satellite companies to focus on making the best satellites and win the market by having the best data, and allows startups and companies that build data solutions and analytics to do just that, rather than spending energy on solving problems around access to data and data processing. As a result, it accelerates innovation—which in turn brings significant growth to the whole industry.
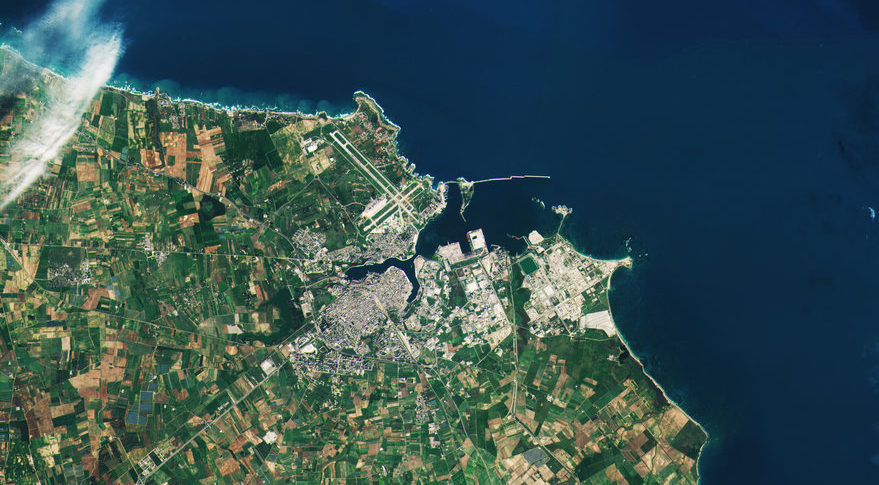
Satellite image from UP42 platform
Big Tech and EO
One more major development that shouldn’t be overlooked isthe arrival of Big Tech on the EO scene. Digital titans like Amazon (with Amazon AWS) and Google (Google Cloud) began by offering data storage and cloud computing services to players at every stage of the value chain, and are now investing in additional functionalities.
In partnership with Capella Space, Amazon has launched AWS Ground Station, a service which enables clients to “control satellite communications, process data and scale operations”, all without the hassle of creating their own ground station infrastructure.
Google, meanwhile, has been integrating vertically in both directions, investing in satellites and providing data to end users: Having recently acquired an equity stake in Planet, the digital giant has now also secured a multi-year deal to buy EO data from Planet for use in its own services, including Google Maps and Google Earth Engine.
A collaborative ecosystem for a better future
The role already played by Earth Observation data in our society cannot be underestimated, but there is still tremendous opportunity for improvement.
When it comes to EO data, each segment of the value chain (upstream, midstream, and downstream) brings the information held within the data closer to its end user. A value chain perspective is hugely useful in recognizing the interconnectivity of different parts of the EO ecosystem—it helps define how individual pieces of the industry fit into the larger whole.
There is an increasing availability of EO data and processing infrastructure, not only provided by satellite companies themselves but also by marketplaces like UP42 and tech giants including Google. A healthy ecosystem is essential in providing an environment where new entrants can explore new ways to harness the power of EO data. Through collaboration, horizontal integration, and fostering interoperability, access to data can become even more widespread—and EO can thus play a critical role in helping humanity.
Did you like the article? Read more and subscribe to our monthly newsletter!

#Categories
Next article
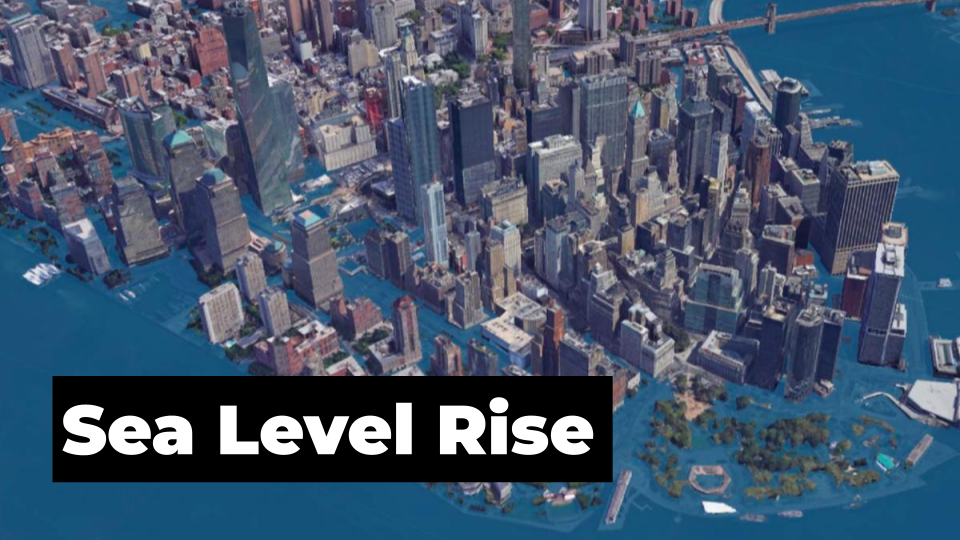
How satellite data is used to understand sea level rise

Editor’s note: This article was written as part of EO Hub – a journalistic collaboration between UP42 and Geoawesomeness. Created for policymakers, decision-makers, geospatial experts and enthusiasts alike, EO Hub is a key resource for anyone trying to understand how Earth observation is transforming our world. Read more about EO Hub here.
Unfortunately, the world’s sea level is constantly rising. This is not due to a single cause, but is influenced by many factors, including intense consumption of stored water. Factors such as loss of wetlands and deforestation are crucial to the sustained flow of water into the oceans from constructed artificial reservoirs. As an example, let’s consider the situation in the Aral Sea region. Water consumption in agriculture is so high that it has lowered the level of stored water in reservoirs, consistently raising the sea level. Changes in land movement caused by the subsidence of the earth’s crust are also a contributing factor. Rising tectonic plates will also inevitably raise the sea level. However, this process occurs on large time scales and is very slow. Scientists surveying areas in Florida have estimated that the land near coastlines has been rising at a rate of 0.02 to 0.05 mm per year over the past 1.6 million years.
There is no doubt that the main reason for rising sea levels is the warming of the oceans caused by climate change. As water molecules absorb heat, they increase in size (thermal expansion) and eventually cause the oceans themselves to become larger, and sea levels to rise. Another effect of global warming is the melting of glaciers, which return water to seas and oceans, thus leading to their expansion. Scientists are now carefully studying the ice caps, and estimate that melting ice contributes 0.35 mm per year to rising sea levels. To better show the scale, it is worth mentioning that if the ice caps melted completely, the level of the oceans would rise by about five meters from the West Antarctic ice sheet, 7 meters from the Greenland ice sheet, and 53 meters from the East Antarctic ice sheet!
Satellites have been recording the height of the ocean surface since 1992. Since then, according to NASA, the average sea level has risen by 10.1 cm. In addition, the rate of the increase in the sea level continues to rise. In the 20th century the sea level increased by 1.5 mm per year; in the early 1990s it was 2.5 mm per year, but in the last decade it has accelerated to as much as 3.9 mm per year! According to NASA, every 2.5 cm rise in sea level results in the loss of 2.5 m of coastline.
Unfortunately, a 30-year study shows just how much man is to blame for this situation. In the words of Josh Willis, a NASA oceanographer, “Sea level rise caused by human interference with climate is now eclipsing natural cycles… and it’s happening faster and faster every decade.” The truth is that the human impact is 10 times greater than the natural rise in sea level, and much depends on us. The Intergovernmental Panel on Climate Change predicts that sea levels could rise by as much as 1.1 meters by the end of this century.
The chart below shows the upward trend of global average sea levels and future projections.
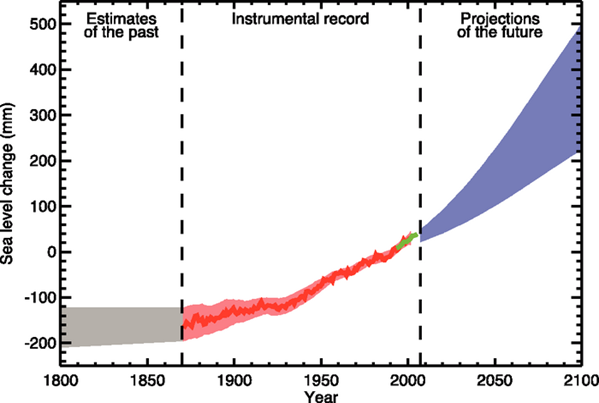
Time series of global mean sea level in the past and future. Source: Intergovernmental Panel on Climate Change (IPCC)
If we consider the history of our planet, we can see that the sea level has risen and fallen many times in the past. The cause was mainly natural processes, tectonic movements and climate warming. However, the stakes have never been so high, and the Earth has never been so heavily populated.
Rising sea levels are already having catastrophic consequences. We can see these with the naked eye by looking at coastal flooding and shrinking beaches. Some countries, such as Bangladesh, are losing crop species due to sea water polluted land. For coastal communities, the situation poses a danger in the form of erosion, storms and flooding.
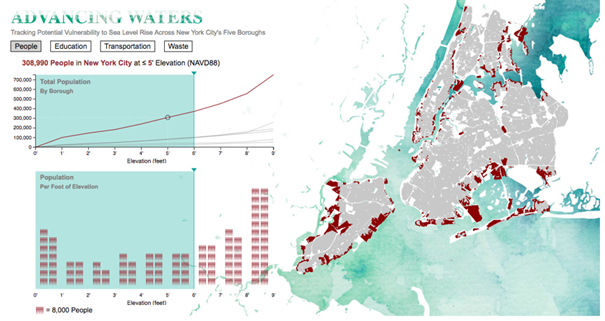
In addition, many major megacities, home to billions of people, are located right on the coast. Shanghai, New York and London are just some examples of heavily urbanized cities that are potentially at risk. The example of an interactive visualization by Landscape Metrics illustrates what this means for a city’s residents and infrastructure.
The situation poses an even greater risk to smaller islands, where people have limited space to relocate. The main center of life is located on the coast, where flooding equals a major disaster.
Satellite data forecasts a warning scenario
It is an indisputable fact that there is no better method to observe the big blue ocean than through satellites orbiting the earth. Water covers 70% of our planet, and getting the same information at the same time from the surface is impossible. With satellite data, we can see the extent of changes over time, and we can thus prepare for the effects. Maps and analyses generated from satellite images make it clear how serious the problem of rising water levels is, and how quickly we can feel the consequences. The changes are happening right now, and it is necessary to take action to minimize the potential damage.
Surging Seas Global Risk Zone Map
The predicted breakup of the ice caps will lead to at least a meter of acceleration in global sea level rise over the next two centuries, and at least a three-meter rise at the end. Ever wondered what your city will look like in such a scenario? Climate Central has created a Surging Seas Global Risk Zone Map that allows you to study the risk of flooding up to 30 meters along the world’s coasts. The map can be searched by city, state, zip code and other location criteria. For areas of the United States, the map includes the latest high-accuracy, high-resolution LiDAR data provided by NOAA. In addition, the layers include information showing social vulnerability and population density. However, for areas outside the United States, altitude data from NASA’s Shuttle Radar Topography Mission (SRTM) was used. The visualizations presented in the app provide thought-provoking insights, which help us better understand the impact of rising water levels on our lives.
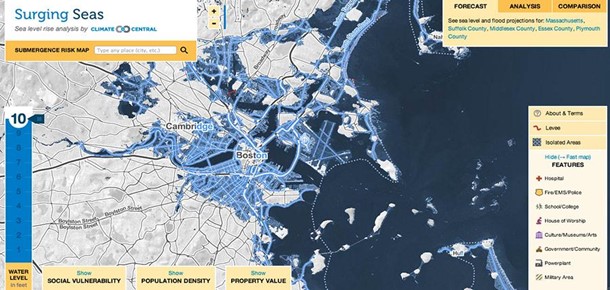
Boston projections showing water level 3 meters above the high tide line; Source: https://riskfinder.climatecentral.org/
Vulnerability to sea level rise in the tropics
According to a recent article published in Nature Communications, 267 million people live on land less than two meters above sea level. The study used a remote sensing method called LiDAR, which uses light in the form of a pulsed laser to measure the distance to an object. These light pulses, combined with other data recorded by the system, generate precise, three-dimensional information about the studied object’s shape. Based on the results, the researchers predicted that, if the rise in sea level is one meter and the population remains the same, then by 2100 the number of people at risk will increase by more than 140 million! According to the maps presented in the article, 62% of the most vulnerable land is located in the tropics. Unfortunately, the forecasts are not optimistic and assume that 59% of the population is at risk in tropical Asia, and as much as 72% in the tropics!
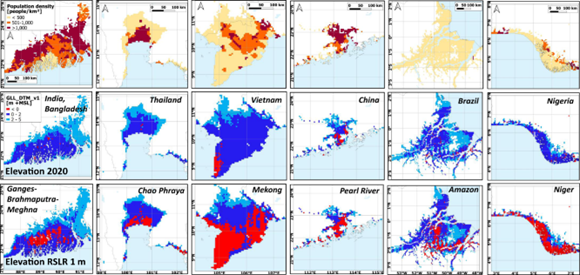
(Top) Population in 2020 (middle) land surface elevation in 2020 (bottom) land surface elevation after 1 m relative sea-level rise (RSLR); Source: Hooijer, A., Vernimmen, R. Global LiDAR land elevation data reveal greatest sea-level rise vulnerability in the tropics.
But with measurable data, more parts of the world can better plan for rising seas, and take thoughtful steps to protect disaster-prone areas. According to Dr. Aljosji Hooijer, lead author of the study, “As long as there’s not really good data on the table, you cannot have a proper discussion about that, but nowadays, data is there, and the accuracy is much higher.” LiDAR technology has theoretically existed since the 1960s, but has evolved considerably in recent years, and survey results are much more accurate. Hooijer was able to use terrain elevation measurements around the world with a much smaller margin of error. Today, data and processing functions are accessible to everyone on geospatial platforms such as UP42. Technology, data quality and the geospatial market are constantly evolving, which allows for even more investigative research.
The Baltic SEAL
The usefulness of satellite data in better understanding the changes taking place is also confirmed by an ESA project called the Baltic SEAL. A group of scientists from the Technical University of Munich, in cooperation with partners from around the world, set out to develop algorithms to work with data on water level changes.
The researchers chose the Baltic Sea as a model region for the study. “Data from this region works exceptionally well for developing new methods to analyze them, because many factors – such as the winding coastline, sea surface ice and wind – make analysis complicated. In addition, there are many local sea level measurements needed to confirm the results,” said Marcello Passaro, project lead. “The method that works for the Baltic Sea will be easily adaptable for other regions.”
With the availability of the aforementioned algorithms, it will be possible to plan a preventive strategy in the event that parts of the coast are inundated. The new way of processing satellite data will make it possible to determine sea levels by the millimeter each year. In the current situation, if the water level continues to rise at such a rapid pace, the information obtained in advance will provide a valuable guide for decision-making bodies in planning and taking action.
Conclusions
Thus, as can be seen from the Baltic Sea, as well as other examples, satellite data has a number of applications related to rising sea levels. With the use of advanced algorithms and LiDAR data, we can track sea and ocean levels. Consequently, what we know is the scale of threats and where potential threats may occur. In addition, awareness of the situation allows for early warning and preventive action based on advanced models created using satellite data. This provides us with an awareness of the problem, shows how the map of threats is spread, and how we should react and cooperate in a possible response.
Without the use of specialized instruments, it is not possible to accurately and quickly investigate the phenomenon described. Even if we fail to stop the rise of ocean waters, we will be prepared for the possible consequences. This is what precise and reliable satellite data enables.
Did you like the article? Read more and subscribe to our monthly newsletter!