
Wait, what?
Yeah, you read that right. Recent launches of two Galileo satellites have gone terribly wrong. Due to unexpected reasons (well, no one could have really expected that to happen!) with a launch malfunction, two fully operational satellites were launched 2000 miles off their intented positions.
Galileo is European Space Agency’s navigation system. The coolest part of it is that they are interoperable with both the existing Global Navigation Satellite Systems (GNSS) – USA’s GPS and Russia’s GLONASS. The launched satellites were the 5th and 6th ones to go into orbit. Once completed, the constellation will have a total of 30 satellites.
Arianespace, the organization responsible for the launch released a press release stating “The targeted orbit was circular, inclined at 55 degrees with a semi major axis of 29,900 kilometers. The satellites are now in an elliptical orbit, with excentricity of 0.23, a semi major axis of 26,200 km and inclined at 49.8 degrees; Arianespace, in association with ESA and the European Commission, will designate an independent inquiry board to determine the exact causes of this anomaly and to draw conclusions and develop corrective actions that will allow us to resume launches of Soyuz from the Guiana Space Center “
Interesting problem on the position of a Global Positioning System. Talk about irony!
To learn more, click here.


#


Next article

The improvement of spaceborne radar technology has prompted the cryosphere research in recent years. So called radar altimeters are used to examine the thickness of ice sheets: They emit pulses at X-band wave length or lower that bounce off the ice surface and go back to the satellite. The measurement of time difference between emission and receipt of the pulse yields the distance between the sensor and earth’s surfac (ice surface), which knowing the altitude above the geoid allows to calculate the height of ice.
New study from CryoSat data
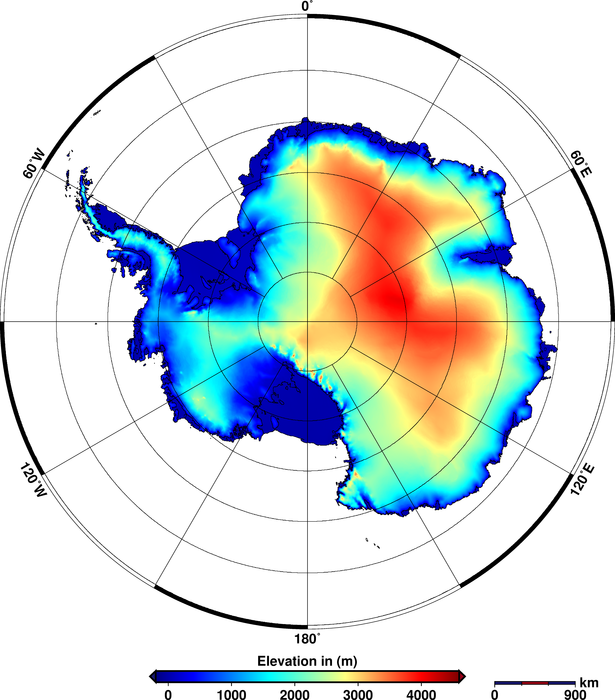
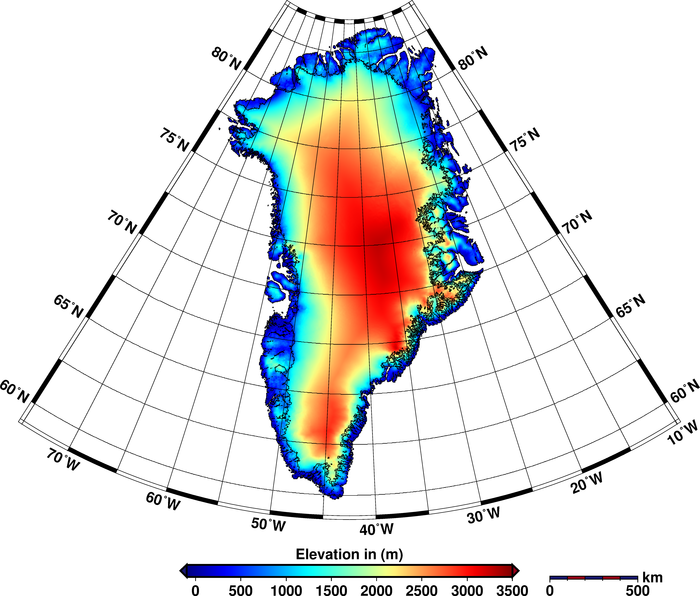
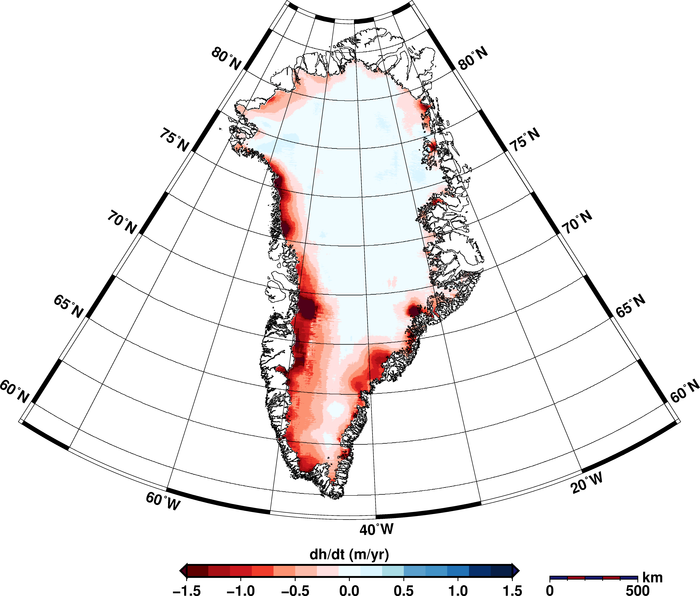
In the context of climate change the assess of ice-sheet elevation and thickness alternations in Greenland and the Antarctica is important in order to estimate the impact on sea level rise. A new study relying on data from CryoSat-2 satellite carried out by Alfred Wegener Institute Helmholtz Centre for Polar and Marine Research in Bremerhaven, Germany, reports in an article from August 2014 in the geoscientific journal The Cryosphere that from 2012 to date the loss of ice masses occurs at an unprecedented rate. The mentioned study relies on 7,5 million elevation measurements over Greenland and over 61 million in Antartica collected by CryoSat-2 in 2012 facilitating the most complete maps from a single satellite mission of the cold areas to date. They are very accurate and cover an area of over 16 mio. km², which is approximately the size of Spain (500.000km²) more compared to previous elevation models from altimetry. The maps reveal highs and lows of the ice sheets and therefore are powerful how sheets have changed since 2012.
Reaching latitudes of 88° CryoSat-2 orbits closer to the poles than earlier missions. It carries the SIRAL sensor, an interferometric radar altimeter that unlike conventional altimeters sends a burst of pulses ten times faster within 50 microsenconds than only one pulse in 500 microseconds. The signals are organised in overlapping stripes that can be superimposed on each other and averaged to reduce noise, which therefore is called a SAR mode. Due to the installation of two receiving antennas that capture the echo simultaneously the phase differences between those two sensors can be measured. Simple geometry and precise knowledge of the orientation of the sensors and the satellite allow to calculate the distance between the sensor and the earth’s surface (interferometry).
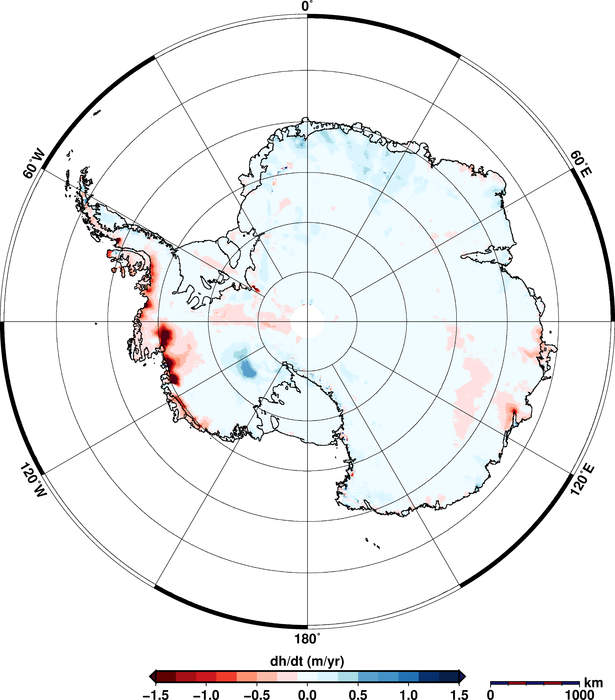
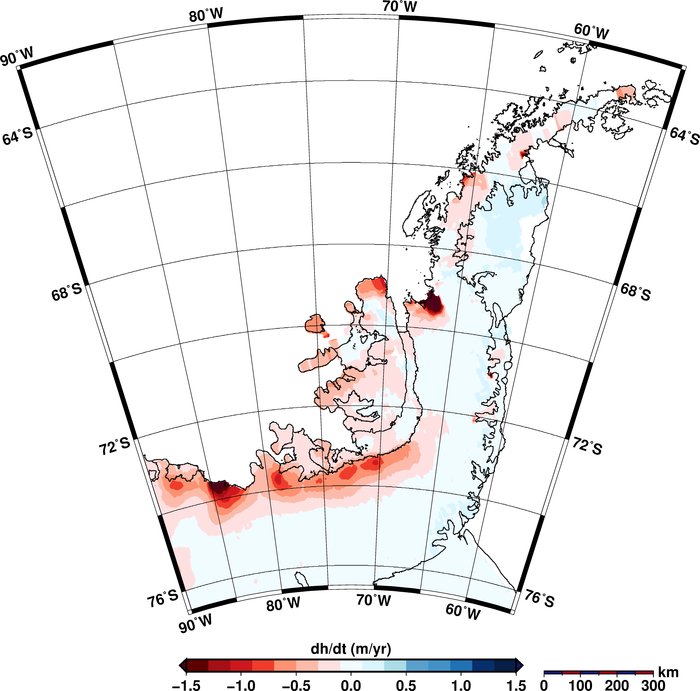
The results reveal that both ice sheets denote a volume loss of 500 cubic kilometres a year, whereas 375 of them are registered only over Greenland. It is the highest rate observed since altimetry satellite records began about 20 years ago and since 2009 the impactof annual ice sheet reduction on sea level rise has doubled according the authors of the study. At a closer look the authors found that West Antarctica and its Peninsula are rapidly loosing ice volume, whereas the Eastern parts record a moderate gain that is far away to compensate for the losses in the other side of the continent.
After all, many of us are already conscious about the reality of climate change and its impact on environment. The actual satellite missions as the CryoSat one run by ESA facilitate to obtain explicit numbers and to get clear impressions of what is really happening on our planet.
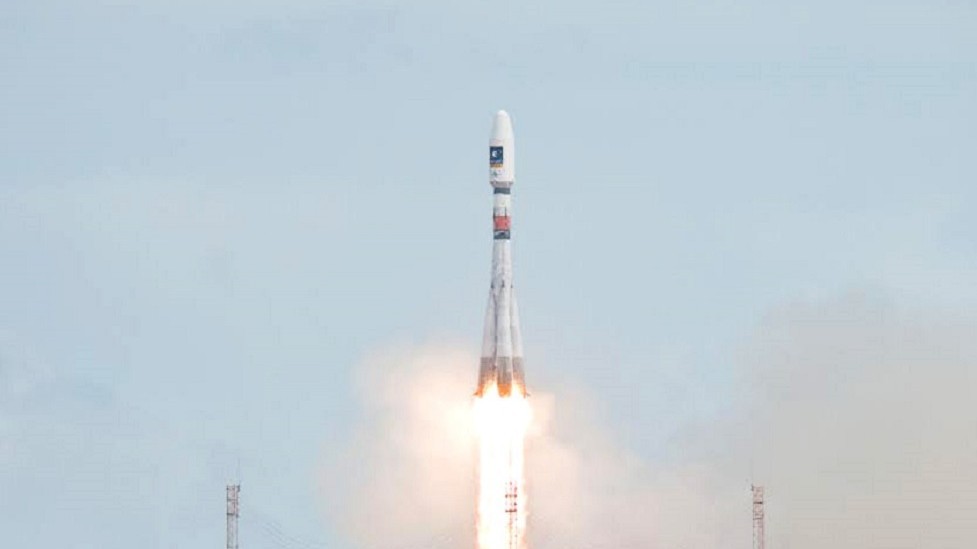
CryoSat-2 is a satellite of ESA and was launched on 8 April 2010 to precisely monitor the changes in the thickness of marine ice floating in the polar oceans and variations in the thickness of the vast ice sheets that overlie Greenland and Antarctica. Planned for a life time of three years the mission was extended to 2017 due to the good performance of sensor and satellite. The satellite was built by Germany based Company Astrium (now Airbus Defence and Space).
Source: ESA
Source of all figures: ESA
Information on the article